Introduction
Data visualization has become an indispensable part of enterprise decision-making and business monitoring. An intuitive, dynamic, and customizable data dashboard project can significantly enhance information transmission efficiency, helping teams quickly grasp business dynamics.
This article recommends a data dashboard project built on the Vue, DataV, and ECharts frameworks. This project not only supports dynamic data refresh rendering but also provides powerful features such as chart replacement and global style adjustments, offering an efficient and flexible data presentation solution for developers.
Project Overview
The project is a comprehensive data dashboard that integrates data display, chart rendering, and dynamic updates. It utilizes the reactive features of Vue 3, combined with the rich visualization component library of DataV and the powerful charting capabilities of ECharts, to achieve real-time rendering and dynamic display of data.
The project supports full-screen display, ensuring users can obtain the best data browsing experience on large screens through carefully designed layouts and interactions. Additionally, the project provides detailed documentation and examples to facilitate quick onboarding and custom development for developers.
Project Features
1. Dynamic Data Refresh
Through component-based development in Vue, real-time data acquisition and dynamic rendering have been achieved, ensuring that the dashboard data remains synchronized with business data at all times.
2. Free Chart Replacement
The internal charts of the project can be freely replaced, supporting various chart examples from the ECharts official community to meet different data display needs in various scenarios.
3. Global Style Adjustments
Through a global CSS file, developers can easily adjust the styles of the entire project, including fonts, colors, layouts, etc., enabling rapid customization.
4. Component Reusability
By encapsulating reusable chart components, redundant code has been reduced, improving development efficiency. For example, the task pass rate and task compliance rate modules use the same chart component, achieving differentiated displays simply by passing different parameters.
5. Responsive Design
The project adopts a scale scaling solution, supporting adaptation to screens of different resolutions, ensuring a good display effect on various devices.
Project Details
Main Files
| File/Directory | Functionality |
|---|---|
| main.js | Main directory file, imports ECharts/DataV and other dependencies |
| utils | Utility functions and mixins (e.g., adaptive logic) |
| views/index.vue | Main structure file of the project |
| views/other files | Components for various interface areas (named by location, e.g., <span>center.vue</span>) |
| assets | Static resources directory (Logo, background images, etc.) |
| assets/style.scss | Global common CSS file |
| assets/index.scss | <span>Index</span> interface specific CSS file |
| components/echart | All ECharts chart components (named by location) |
| common/… | Globally encapsulated ECharts and screen adaptation plugins (e.g., <span>flexible</span> alternatives) |
Project Usage
1. Start the Project
Dependency requirements: Node.js + pnpm
Steps:
After downloading the project, run <span>pnpm install</span> in the main directory to pull dependencies.
Start command: <span>npm run serve</span> (or start via <span>vue-cli</span>).
Manual full-screen: press <span>F11</span>.
Troubleshooting: If the compilation prompts a missing DataV dependency, install it manually:
npm install @jiaminghi/data-view # or yarn add @jiaminghi/data-view
2. Encapsulate Components to Render Charts
Base components: All charts are encapsulated based on <span>common/echart/index.vue</span><span>, supporting:</span>
-
Dynamic data listening (using debounce functions to optimize performance).
-
Adaptive to screen size changes.
Default styles: Configuration file path <span>common/echart/theme.json</span><span>.</span>
Component parameters:
| Parameter Name | Type | Function |
|---|---|---|
<span>id</span> |
String | Unique identifier for the chart (optional, defaults to <span>$el</span>) |
<span>className</span> |
String | Custom style class name (optional) |
<span>options</span> |
Object | ECharts configuration options (required) |
<span>height</span> |
String | Chart height (recommended to fill) |
<span>width</span> |
String | Chart width (recommended to fill) |
3. Dynamic Chart Rendering
Example path: <span>components/echart/[chart name]/chart.vue</span>
Core logic
<template>
  <div>
    <Echart :options="options" id="id" :height="height" :width="width" />
  </div>
</template>
<script>
import Echart from'@/common/echart';
exportdefault {
  data() { return { options: {} } },
components: { Echart },
props: {
    cdata: { type: Object, default: () => ({}) }
  },
watch: {
    cdata: {
      handler(newData) {
        this.options = { /* ECharts configuration */ };
      },
      immediate: true,
      deep: true
    }
  }
};
</script>
4. Reuse Chart Components
Example: The “Task Pass Rate” and “Task Compliance Rate” modules in the middle section
Implementation method:
Parent component passes parameters (e.g., <span>views/center.vue</span><span>):</span>
<centerChart :id="rate[0].id" :tips="rate[0].tips" :colorObj="rate[0].colorData" />
<centerChart :id="rate[1].id" :tips="rate[1].tips" :colorObj="rate[1].colorData" />
<script>
export default {
  data() {
    return {
      rate: [
        { id: "centerRate1", tips: 60, /* other configurations */ },
        { id: "centerRate2", tips: 40, colorData: { /* color configurations */ } }
      ]
    };
  }
};
</script>
Child component receives parameters (e.g., <span>components/echart/center/centerChartRate.vue</span><span>):</span>
<script>
export default {
  props: ['id', 'tips', 'colorObj'],
  // Dynamically render the chart based on parameters
};
</script>
5. Change Borders
Method: Use the border components provided by DataV, replacing the corresponding tags in <span>views/[area].vue</span><span>:</span>
<dv-border-box-1></dv-border-box-1>  <!-- Border type 1 -->
<dv-border-box-2></dv-border-box-2>  <!-- Border type 2 -->
More borders: Refer to the DataV official documentation.
6. Change Charts
Path: Directly modify the files under <span>components/echart/[chart name]</span><span>.</span>
Reference resources: ECharts official example library.
7. Mixins for Adaptive Adaptation
File: <span>utils/resizeMixins.js</span>
Application: Injected into <span>common/echart/index.vue</span><span>, implementing functionality extensions for </span><code><span>this.chart</span><span> (e.g., redrawing the chart when the window changes).</span>
8. Screen Adaptation Scheme
Version: 1.5 version deprecated <span>flexible</span><span> + </span><code><span>rem</span><span>, replaced by CSS3 </span><code><span>scale</span><span>.</span>
Logic:
Base size: <span>1920px * 1080px</span><span>.</span>
Proportional screens: 100% fill.
Non-proportional screens: Automatically calculate the proportion to center fill, leaving blank for insufficient parts.
Code path: <span>src/utils/userDraw.js</span><span>.</span>
9. Request Data (Recommended)
Tool: Axios
Global configuration example (<span>main.js</span><span>):</span>
import axios from 'axios';
Vue.prototype.$http = axios.create({
  timeout: 20000,
  baseURL: 'http://172.0.0.1:8080'
  // Backend API address
});
Project Experience
Experience Address: https://www.gaobug.com/bigscreen
Project Effects
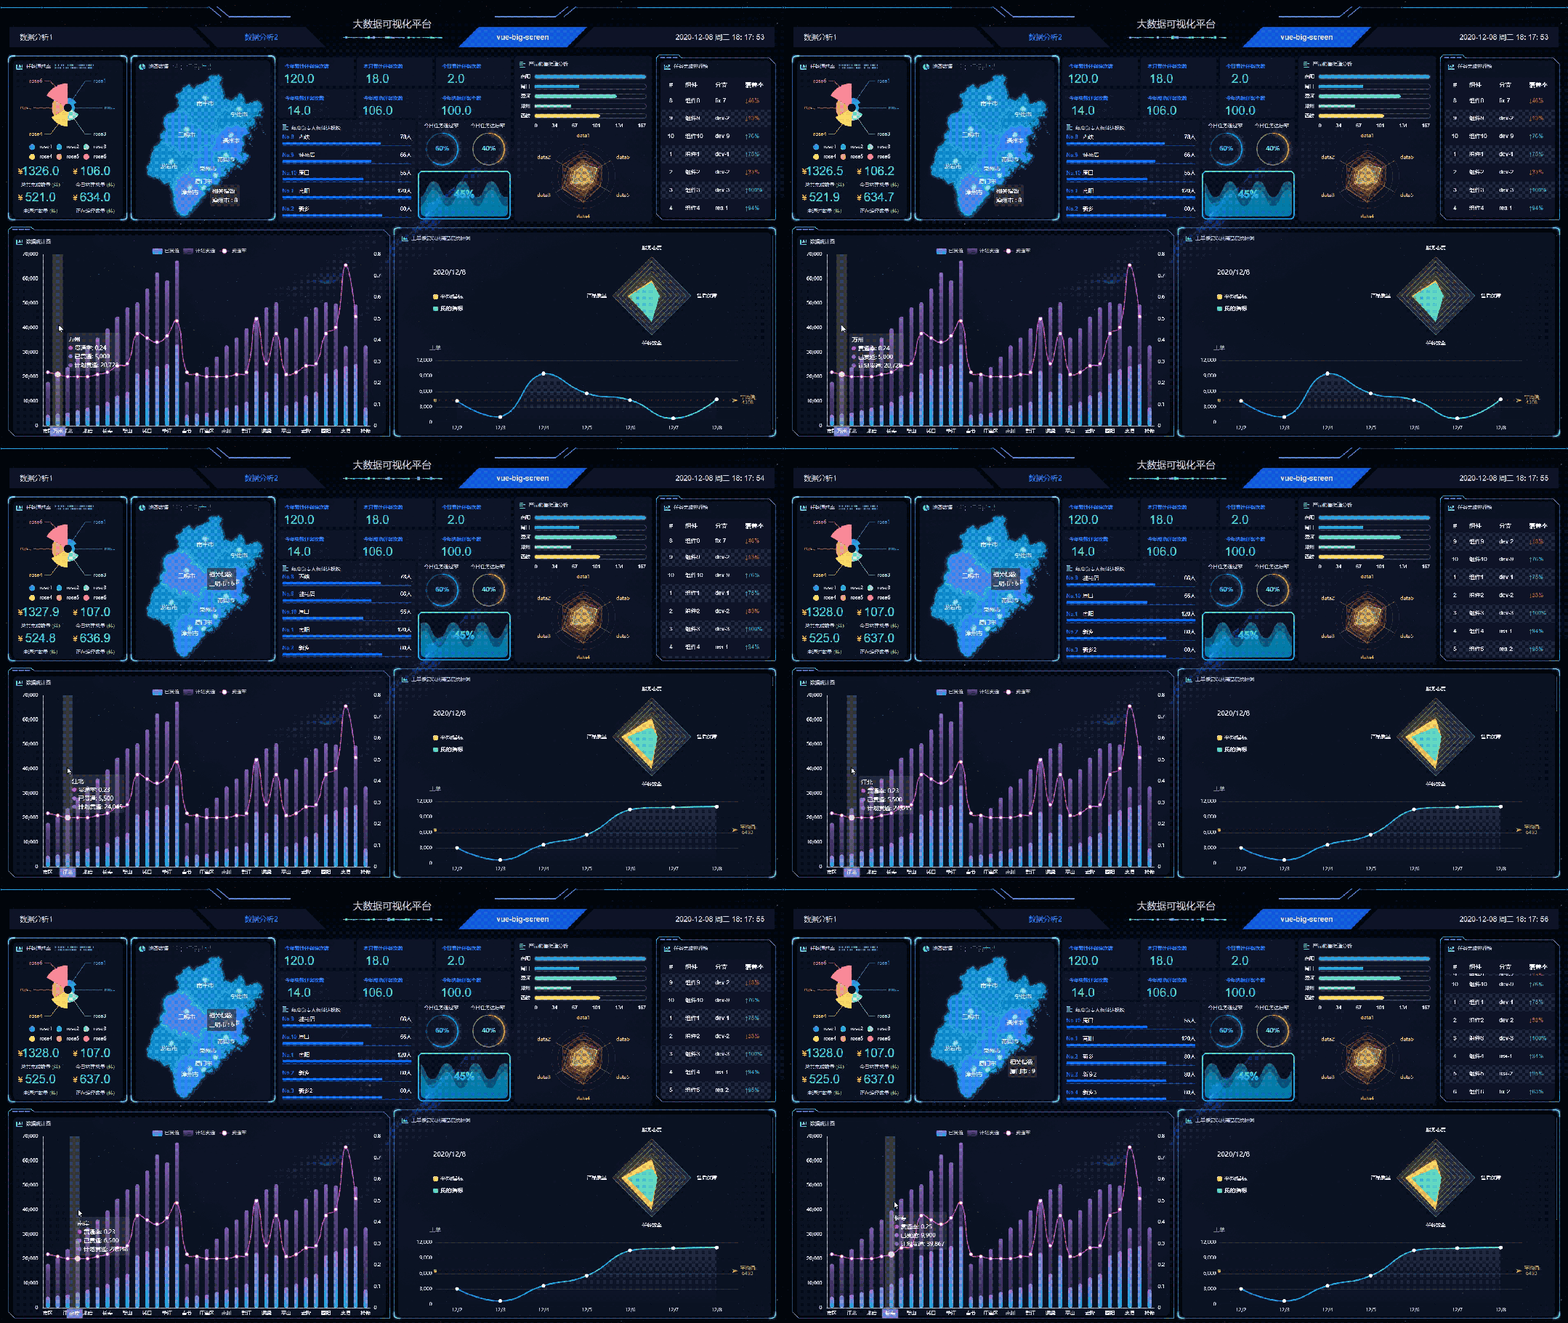
Big Data Visualization Platform
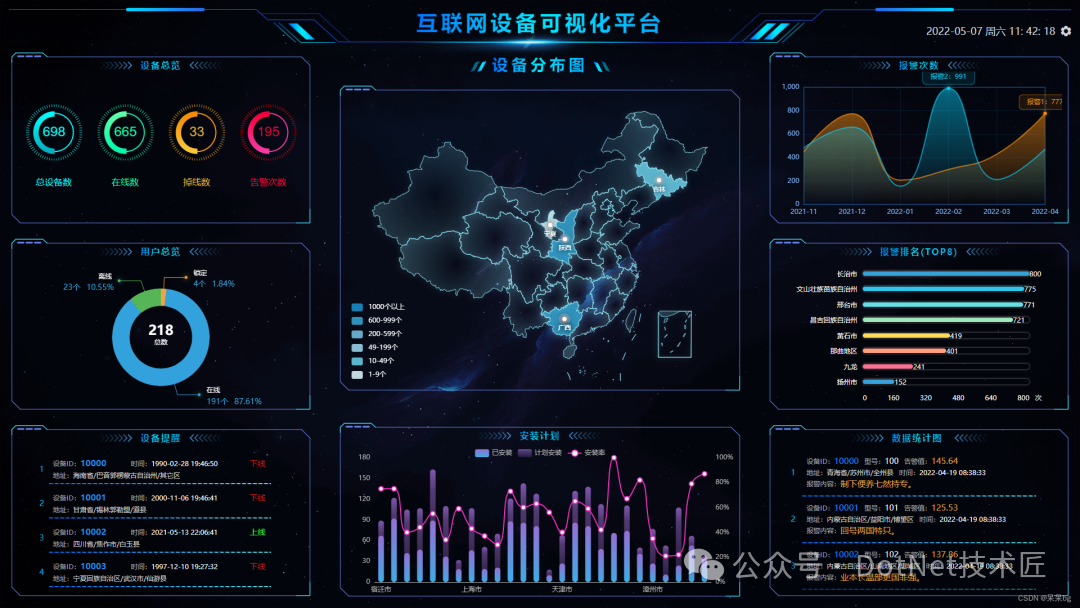
Internet Device Visualization Platform
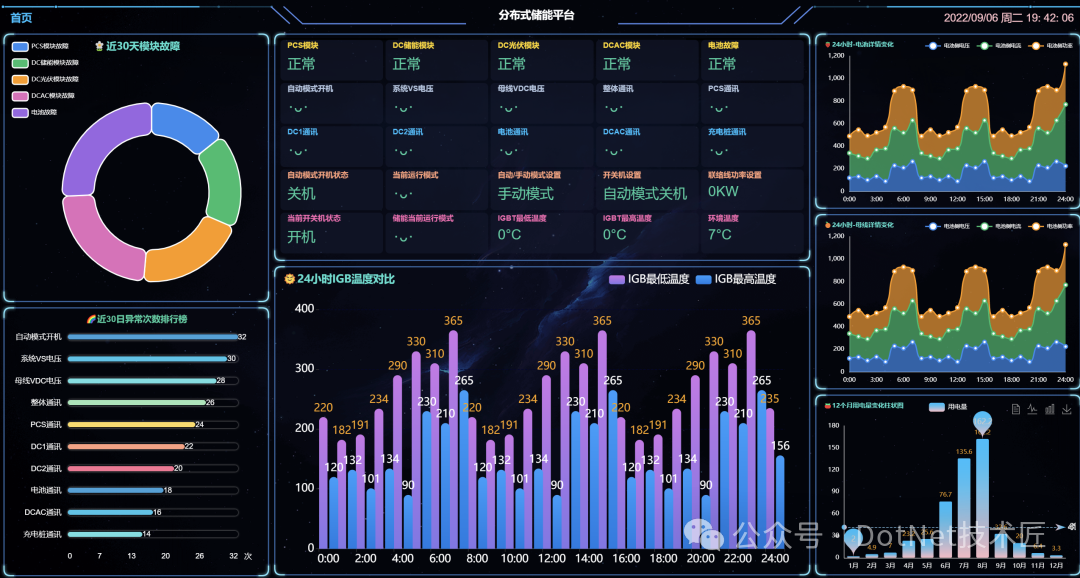
Distributed Energy Storage Platform
Project Source Code
The source code is hosted in a code repository, and the latest version can be obtained by pulling the master branch. The project structure is clear, containing multiple directories and files, including main directory files, utility functions, interface components, static resources, etc.
Everyone can quickly get started and customize development based on the project documentation and example code. During the development process, it is recommended to rename files according to functional areas for easier management and maintenance.
Gitee: https://gitee.com/MTrun/big-screen-vue-datav
Conclusion
A data dashboard project built on the Vue, DataV, and ECharts frameworks, featuring dynamic data refresh, free chart replacement, global style adjustments, and other powerful functionalities.
Through modular design and highly customizable features, the project meets the data display needs in various scenarios. Additionally, the project provides rich documentation and example code to facilitate quick onboarding and custom development.
Keywords
#Data Dashboard, #Vue, #DataV, #ECharts, #Dynamic Refresh, #Chart Replacement, #Responsive Design, #Project Source Code, #Open Source Project, #Visualization, #IoT, #Device Monitoring, #Big Data, #Large Screen, #Real-time Updates
Author: Xiaoma Bianjiang
Source: gitee.com/smallcore/DotNetCore
Disclaimer: Online content is for learning purposes only, respecting copyright. Infringement will be deleted promptly, apologies and thanks!
ENDPrevious Highlights: Ready to use! Lightweight and efficient front-end and back-end separated examination system, supporting Web and mini-programsRust implements an efficient and secure GB28181 video monitoring platform (compatible with 2016/2022)A powerful enterprise-level content management system based on SpringBoot3 + Vue2A PSI + WMS system for small and medium-sized enterprises | Low-code platform SpringBoot + Vue full-stack architectureAn open-source, fast, and free-to-use backend framework: one-click generation of CRUD/menu/API documentationSay goodbye to CRUD drudgery! Spring Boot 3 + Vue3 full-stack development framework, saving time, effort, and cost!AI + low-code dual-engine: SpringCloud + Vue3 enterprise platform, one-click generation with zero code!EasyAIoT: AI zero-threshold, all-scenario customizable IoT platformBuilding an IoT platform is too difficult? Try this one-stop enterprise-level IoT cloud platform based on Spring CloudIntelligent approval system based on SpringBoot + Flowable, comprehensive functionality, simple interface, supporting full-process managementNo more reinventing the wheel! Open-source uniapp + Java quickly builds a dedicated WeChat mini-program mallOpen-source free modern inventory management system (ERP)! Complete functions + high-quality interface, the first choice for enterprise digitizationOpen-source smart property management system Spring Boot + Vue achieves contract management, charging, and work order automationFully open-source AI + low-code dual-engine intelligent office systemEnterprise-level low-code platform, easily coping with 99.99% of programming challengesOpen-source electronic contract platform, supporting evidence chain signing and private deploymentA high-performance network framework suitable for IoT, IM, and customer service systemsFully open-source BI platform to create cool data dashboards in three steps (multiple data sources + drag-and-drop design)Visual workflow engine! Pure open-source, supporting dozens of databases, ready to useFree and open-source! SpringBoot + Vue builds a no-code questionnaire and business form systemLightweight IoT comprehensive management platform (card module management, three-network integration, full-process business)Open-source smart property management system, microservice architecture supports mini-programs, H5 multi-end, and secondary developmentOne-stop IoT access iot-ucy middleware covers all protocols, seamlessly connecting mainstream databasesOpen-source free public cloud file system, one-click deployment, supporting multi-cloud storage personal cloud diskTencent’s open-source masterpiece! Free, beautiful, ready to use, highly scalable enterprise-level middle and back-end templateAI + Vue3 low-code platform: bidirectional source code/DSL intelligent conversion engine, zero intrusion, ready to useDomestic lightweight workflow engine Warm-Flow, comprehensive functionality, flexible expansion, designer one-click integrationAn open-source, powerful low-code generator, custom templates, quickly generating front-end and back-end codeAn open-source multi-functional document online preview solution, supporting mainstream formats for one-click deploymentAn open-source Web file management system, supporting permission control, historical versions, and Office online editingSpring Cloud + Uniapp charging pile management system: supporting microservices, multi-end deployment, and flexible expansionSpringBoot3.4 + Vue3 enterprise-level low-code platform (achieving efficient development experience of front-end and back-end separation)SpringBoot + Vue efficient project management system, integrating bidding progress and cost control into a unified OA platform100% open-source + low-code enterprise collaborative office OA platform, supporting flexible customization, trust certification, and white-label deployment
 Note【Open Source】
Facilitating communication, resource sharing, and mutual growth
Pure technical exchange group, please scan the code if needed
Gained something? Feel free to share to benefit more people
Follow “Programmer Open Source Stack”, and enhance technical strength together
 Click to Share
 Click to Collect
 Click to View
 Click to Like