Data-Driven Temperature Measurement Experiment Teaching
Song Bo
Beijing Jingyuan School, 100040
Author Introduction
Song Bo, Master, First-Class Teacher.
Table of Contents

Abstract
Through temperature change data at different time scales (daily, annually, over the past 150 years, 5000 years, and 5 million years) and temperature distribution data at different spatial scales (from global to a specific point in the campus), the teaching of “Temperature and Temperature Change” is conducted. A homemade IoT air monitoring device designed based on microcontrollers, sensors, IoT, and 3D printers collects real-time temperature data from the campus, allowing students to form a new data-driven understanding of their “familiar” campus environment.

Keywords
Geography Teaching; IoT; Sensors; Temperature; Weather Station
The new technology has brought many changes to education and teaching, including a learning environment characterized by experience. The enormous inertia of industrial society means that most schools today still use a production line method to teach fixed knowledge from textbooks. With the arrival of the knowledge economy era, knowledge is no longer scarce, and education has begun to shift from conventional group teaching to individualized learning. This means that learners need to extract effective information from existing experiences when faced with a problem, try different methods, and then, after solving the problem, reflect and consolidate the newly formed experiences to achieve an iteration of individual knowledge systems. This complete learning process is called experience.
Because of experience, learners will form their own understanding of a new thing or concept; also because of experience, the differences among learners will become apparent, allowing teachers to provide targeted guidance; and also because of experience, students will form correct reflections on failure or success, thus forming methods and strategies—human creativity will burst forth during this process.
The teaching of “Temperature and Temperature Change” serves both as a supplementary lesson and an extension lesson; it supplements the concept of “temperature” in the seventh-grade geography textbook while also expanding students’ cognition and cognitive methods. This lesson aims to help students understand the scientific concept of “temperature” through the observation conditions and methods in meteorology; describe the law of temperature change over time through temperature data at different time scales, gaining a more objective understanding of the present and the world; perceive geographical environmental differences by comparing real temperature data under different conditions and analyze their possible causes; and feel the impact of equipment selection design and placement environment on measurement data by comparing temperature data obtained under different conditions.
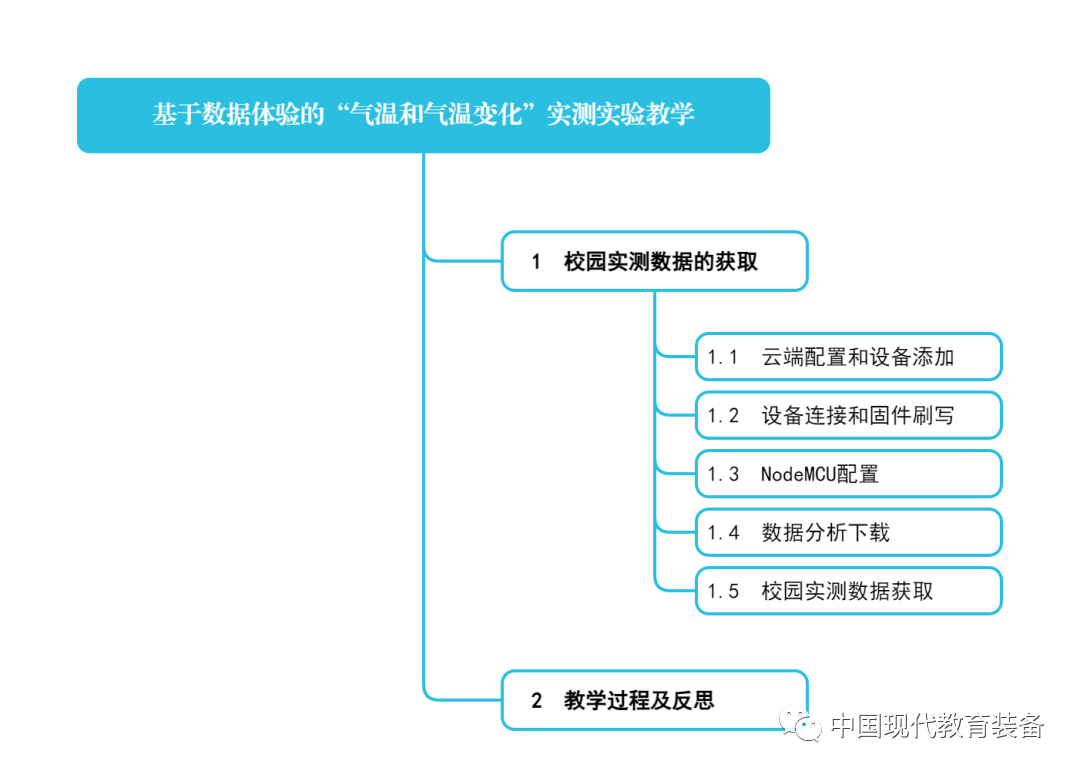
This lesson comprehensively derives the scientific measurement conditions of “temperature” and other real factors through experimental activities, allowing students to attempt to design a campus weather station construction plan in small groups. Therefore, this is also a data-driven “temperature” lesson, using temperature change data at different time scales (daily, annually, over the past 150 years, 5000 years, and 5 million years) and temperature distribution data at different spatial scales (from global to a specific point in the campus) to comprehensively understand the distribution and change of temperature, guiding students to speak with data, explain with data, and understand with data; enhancing their ability to recognize geographical environments with data. The focus of this lesson is to scientifically understand the concept of “temperature,” while the difficulty lies in the development of students’ data thinking and scientific thinking.
1 Campus Real-Time Data Acquisition
The collection of temperature data is based on digital temperature sensors (model DS18B20, SHT20, etc.), NodeMCU development boards (with the main control chip esp8266), and IoT cloud platforms. The temperature sensor data is collected by NodeMCU and sent to the IoT cloud platform via Wi-Fi, and then it can be viewed, downloaded, and analyzed on computers, phones, etc. (see Figure 1).
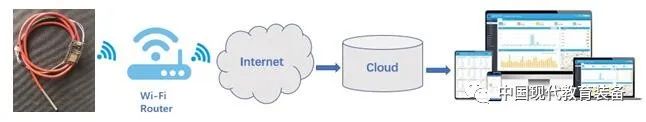
Figure 1 System Framework
1.1 Cloud Configuration and Device Addition
Using a certain IoT cloud platform as an example, complete the process of “registering an account, clicking login → user center → ‘My IoT’ → ‘My Devices’ → add new device → set identifier 01 (remember the identifier, needed later), type Arduino, data upload frequency 300 (depends on how often data is recorded, in seconds), select template HT, name (set according to demand) → save” (see Figure 2). The same method can also add multiple devices, and then click “My Account” to set personal information and record the Userkey.
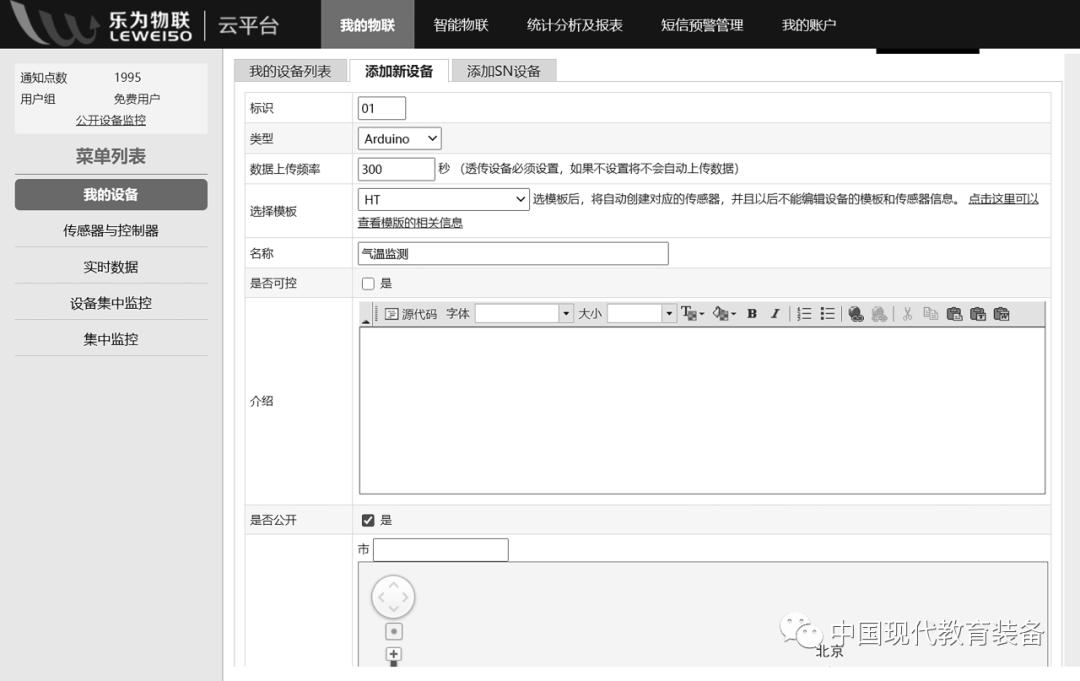
Figure 2 Device Addition Interface
1.2 Device Connection and Firmware Flashing
First, connect the sensor to NodeMCU, the positive (red wire) to the 3.3 V pin, the negative (black wire) to the GND pin, and the data wire (yellow wire) to the D5 pin. Then connect the NodeMCU to the computer’s USB port using a USB cable, and the module indicator light will turn on (driver needs to be installed first). Download the firmware (from GitHub), use FLASH_DOWNLOAD_TOOLS to flash the firmware to NodeMCU, fill in the firmware path in DownloadPathConfig, set ADDR to Ox00000, SPISPEED to 40Mhz, SPIMODE to DIO, FLASHSIZE to 32Mbit, COMPORT [COM* specific number (can be found by right-clicking “My Computer” → Manage → Device Manager → Ports)], BAUDRATE set to 115200, specific settings can refer to Figure 3, then click FLASH and wait for the firmware flashing to complete. Note: Incorrect parameter settings may damage NodeMCU.
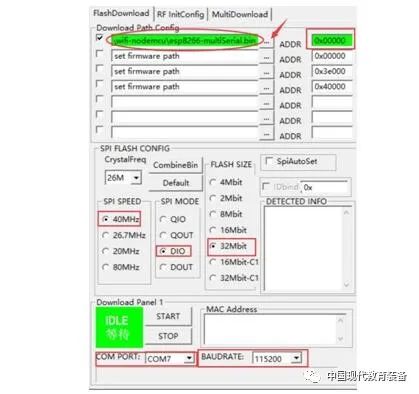
Figure 3 Firmware Flashing Parameter Configuration Interface
1.3 NodeMCU Configuration
Connect NodeMCU to power via the USB interface (supply voltage 5 V, can use a phone charger, power bank, etc.), wait for the device to start, then connect to the wireless hotspot eMonitor-xxxxxx (the number after the hyphen will vary) with a notebook or phone (password can be set to 12345678), open in the browser, enter the data preview page, click configure page to enter the parameter setting page. Enter the Wi-Fi name and password for home or campus internet. SN consists of the user’s Userkey and device identifier, formatted as Userkey_ID, e.g., 8888888888_01, with no spaces in between. IntervalTime(s) depends on the time interval for recording data, in seconds. Click Apply, wait for the device configuration to complete and restart (see Figure 4). If the setup is successful, wait a few minutes to see the data in the “My IoT” section under “Centralized Monitoring” on the IoT cloud platform.
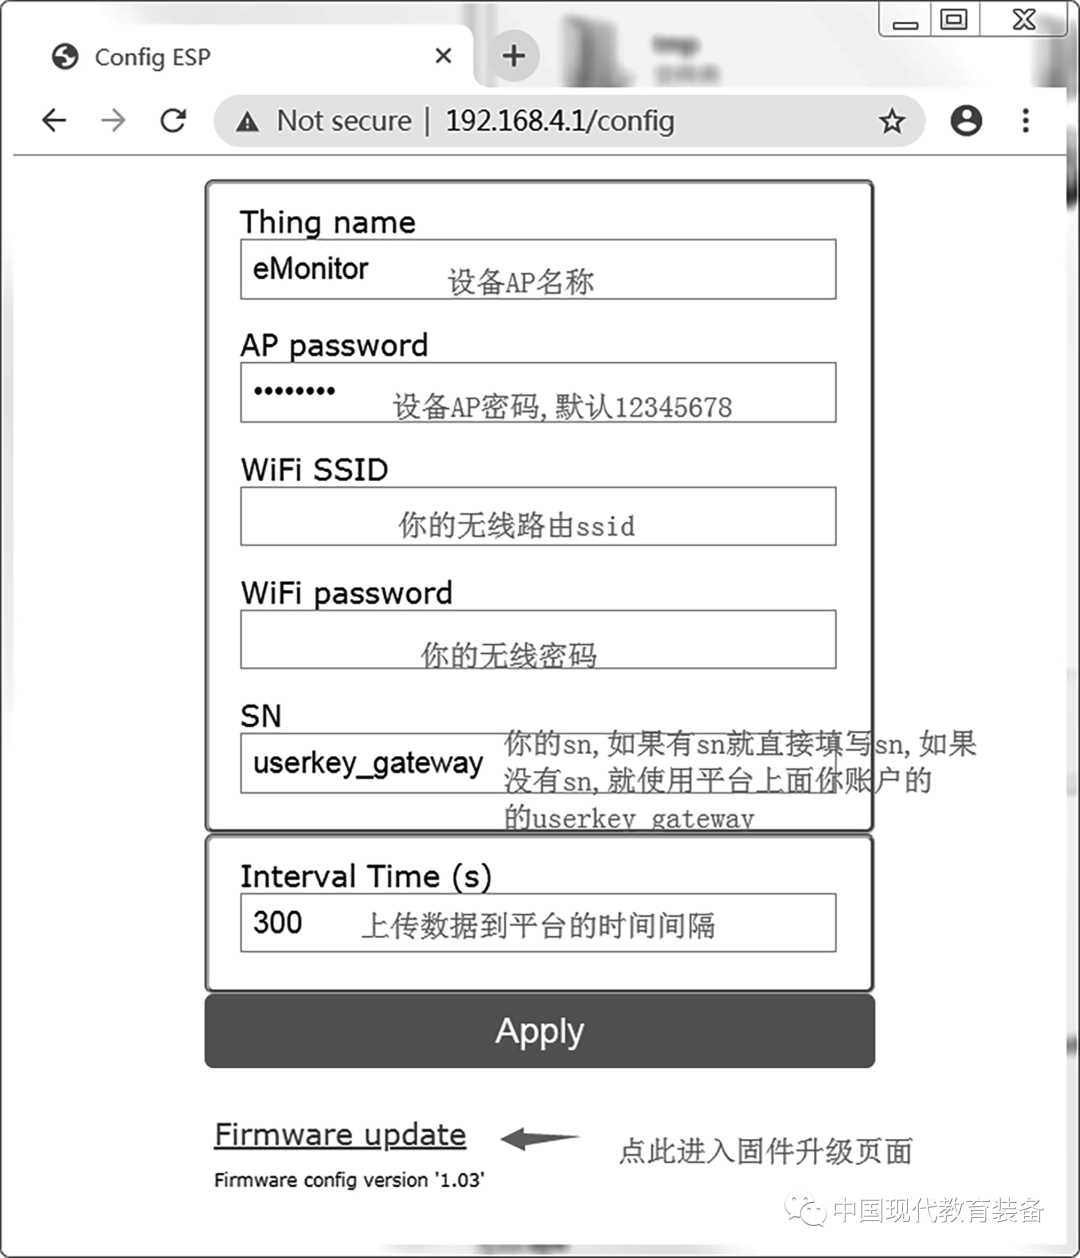
Figure 4 NodeMCU Configuration Interface
1.4 Data Analysis and Download
In the statistics analysis and reports of “My IoT,” there are functions such as historical trend analysis, historical data query, sensor comparison analysis, data distribution statistics, data export, etc., which can perform comparative analysis, download, and other operations on the data. In addition to temperature, more sensors can be connected to the IoT cloud platform, such as laser PM2.5 sensors, formaldehyde sensors, barometric pressure sensors, etc., for more information, refer to the KanCloud website.
1.5 Campus Real-Time Data Acquisition
The author has added 5 IoT devices through the operations above. Among them, 2 are connected to DS18B20 (silver stainless steel shell), and 2 are connected to SHT20 (black plastic breathable shell), divided into two groups, placed outside the geography office window facing east and outside the geography classroom window facing west (see Figure 5). Another one, as shown in Figure 6, is placed in the garden area on the west side of the south gate (in a 3D printed small louver box made of white PLA material, about 1.4 meters off the ground). Powered by a power bank, the device connects to the campus Wi-Fi network to upload data to the IoT cloud platform, obtaining continuous 11 days of temperature data recorded every 5 minutes from December 2 to December 12, 2021 (see Figure 7).
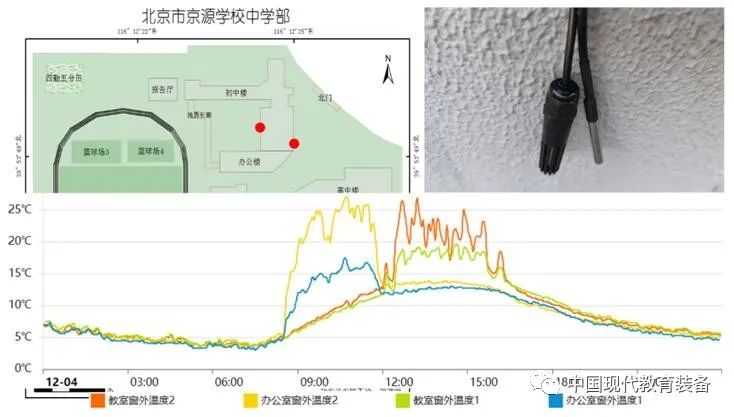
Figure 5 Sensor Placement Location (Top Left), Appearance (Top Right), Temperature Data Obtained on December 4, 2021 (Bottom)
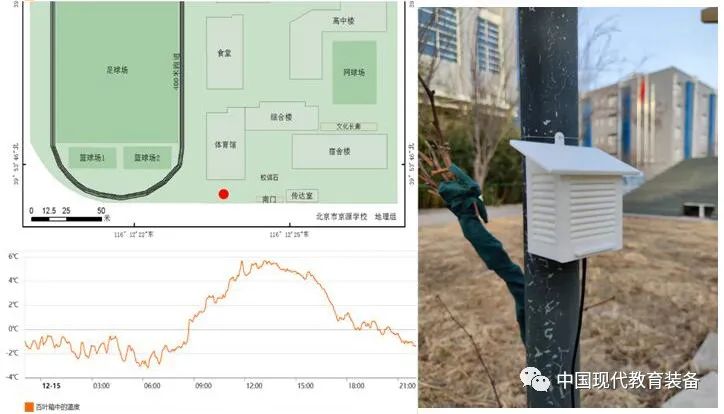
Figure 6 Sensor Placement Location (Top Left), Appearance (Right), Temperature Data Obtained on December 15, 2021 (Left Bottom)
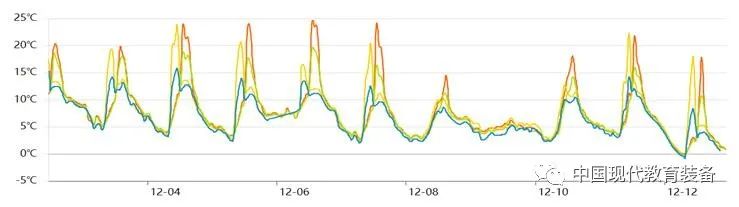
Figure 7 Continuous 11 Days of Temperature Data Recorded Every 5 Minutes from December 2 to December 12, 2021
2 Teaching Process and Reflection
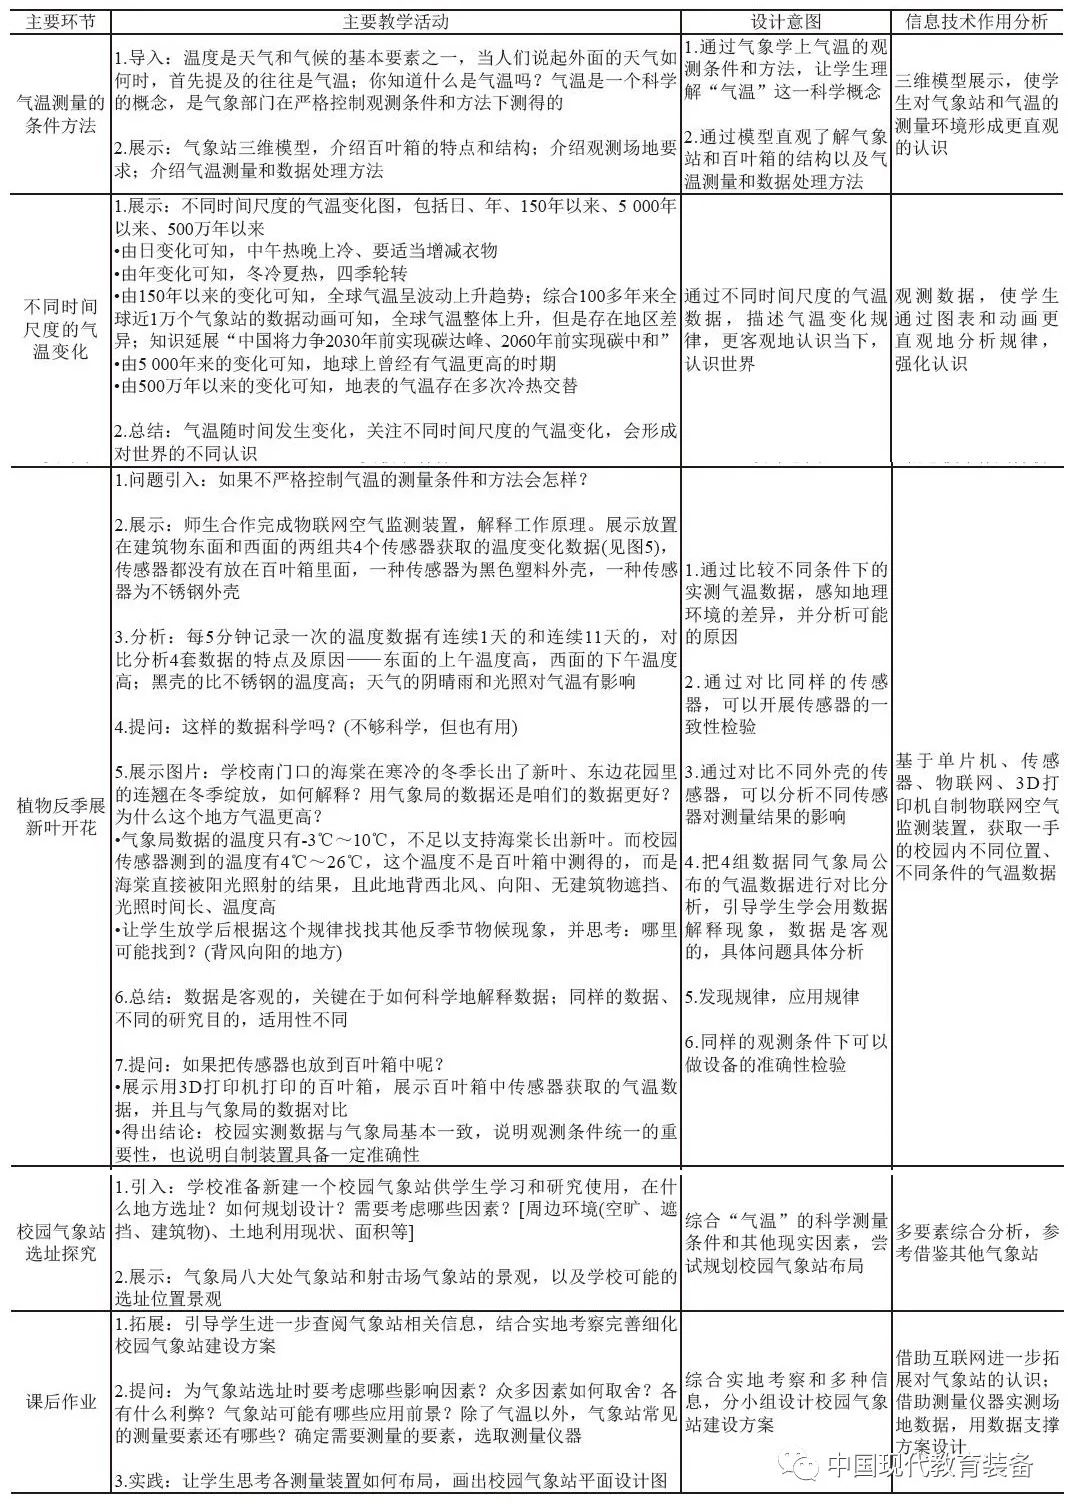
The main teaching process is shown in Table 1.
Table 1 Overview of the Main Teaching Process
The intervention of information technology solves problems that previous teaching could not address. The homemade IoT air monitoring device based on microcontrollers, sensors, IoT, and 3D printers allows students to gain new data-driven experiences in their “familiar” campus environment. This experience is both familiar and unfamiliar, making it attractive to students and enhancing their sense of participation.
The teaching arrangement of this lesson breaks subject boundaries and conventional models, addressing real problems and situations, and solving problems through technology-driven methods. Teachers teach based on their research, guiding students into research. Students participate in the assembly of the device (including sensor selection, program code settings, etc.), on-site equipment selection, installation and debugging, data collection, and uploading to the cloud server, processing and analyzing their data to explain phenomena, perceive environmental changes, and experience the entire research process, achieving good teaching results.
However, currently, due to factors such as textbook content, class time arrangement, related subject foundations, and students’ interests, students can only participate partially, so innovative teaching attempts still need further improvement.
Funding Project: Key Laboratory for Integrated Development of Publishing by the National Press and Publication Administration, Key Project of the People’s Education Press Digital Education Research Institute in 2022 “Development of Auxiliary Teaching System for Secondary School Geography” (Project Number: RJA0422001).
This article was published in the September 2023 issue of “Modern Educational Equipment”. Please indicate the source if reprinted.
Editor | Miao Xuanming
Typesetting | Zhang Xin
Published | Zhang Xin
