Graphical Interface Creation Wizard
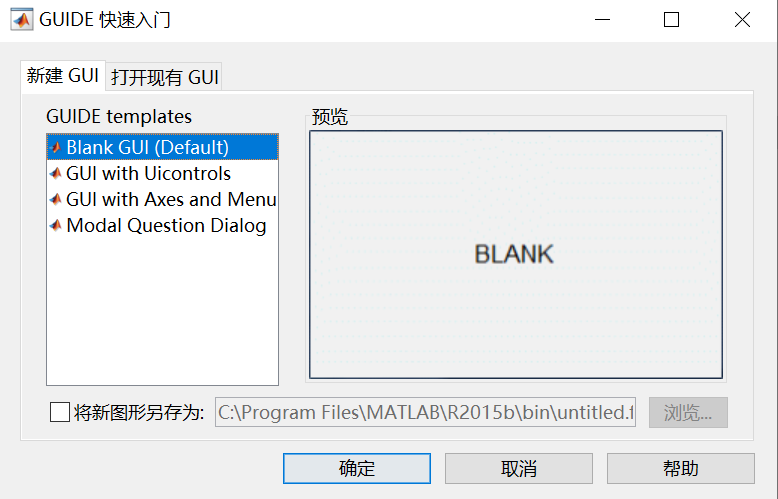
Type guide to open the GUI window, as shown in the figure below. The sub-dialog box has two options: New GUI and Open Existing GUI.
GUI Working Interface
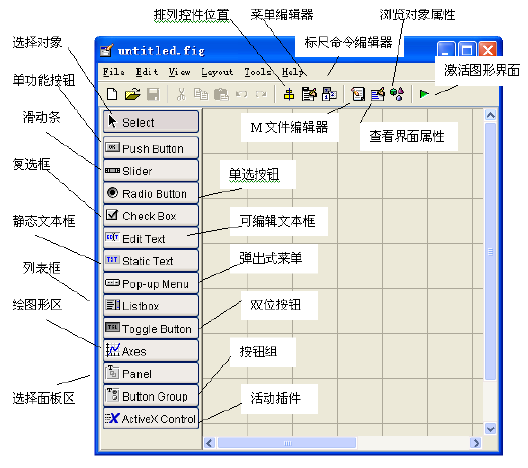
Select New GUI to open a new dialog box, as shown in the figure below. The left side of the dialog box contains various controls, while the top has menus and toolbars.
Creating Your First GUI Program
1. Button Control Functionality. Select the OK Button from the left and drag it to the appropriate area on the right.
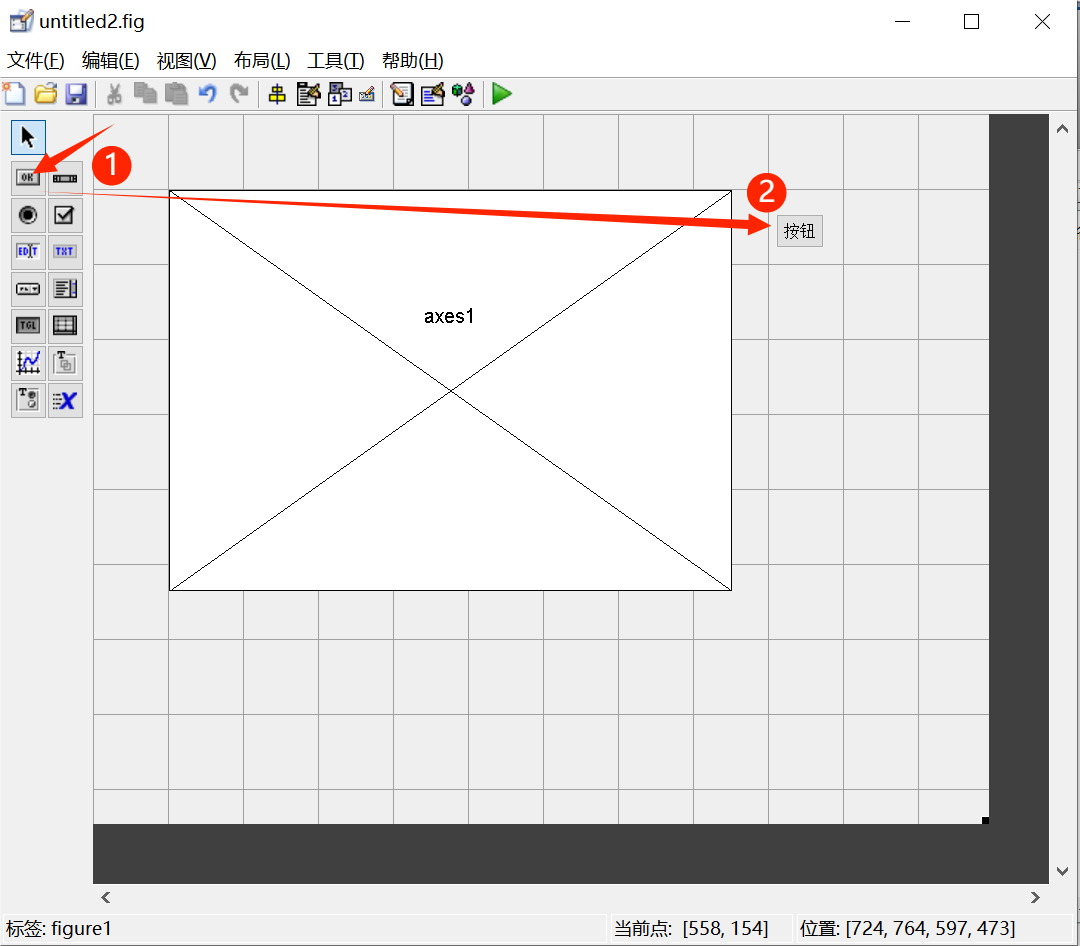
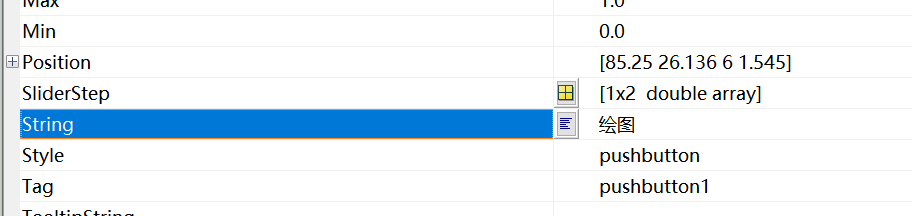
2. Double-click the Button to open the inspector, where you can see the string value of the button. Change the button text to Plot.
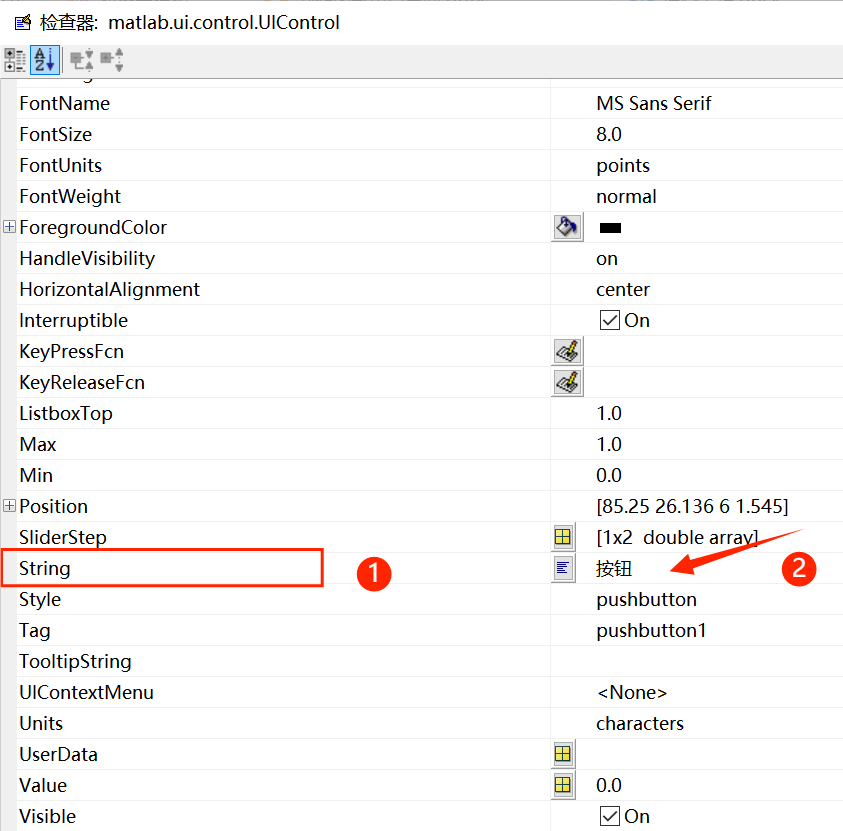
As shown in the figure below
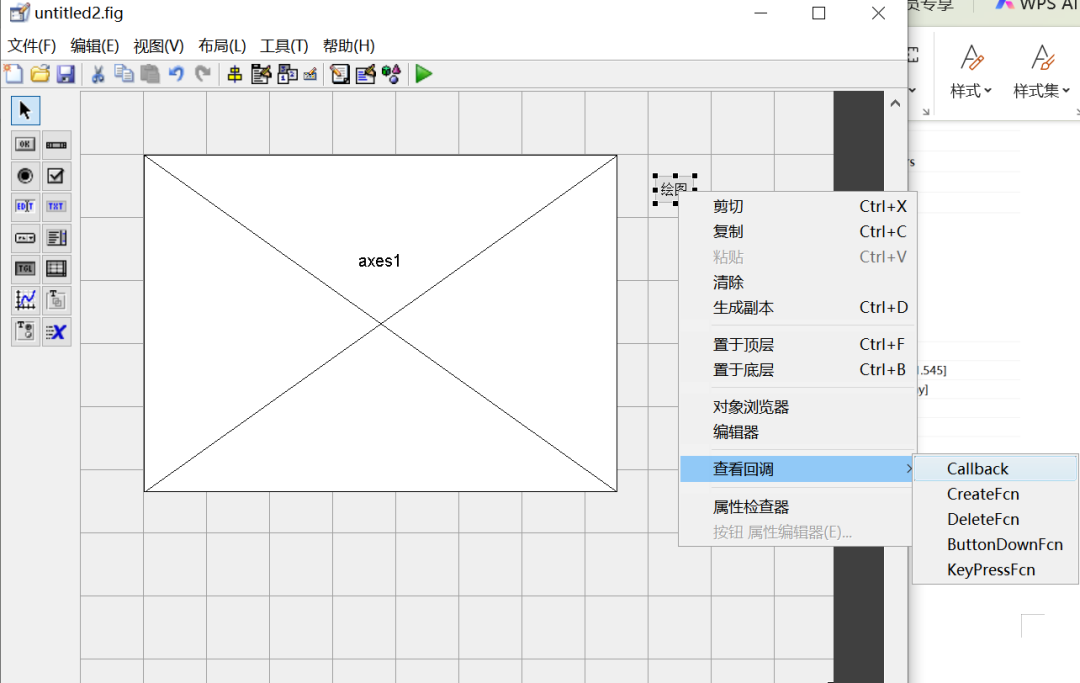
3. Write the Callback Function. Select the Plot button, right-click -> View Callback Function -> callback to automatically open the m-file. In the corresponding function, write the plotting program.
function pushbutton1_Callback(hObject, eventdata, handles)
% hObject handle to pushbutton1 (see GCBO)
% eventdata reserved - to be defined in a future version of MATLAB
% handles structure with handles and user data (see GUIDATA)

x = 0:0.01:2*pi;
y = sin(x);
plot(x,y,'b.');
xlabel('$t$','interpreter','latex');
ylabel('$sin(x)$','interpreter','latex');
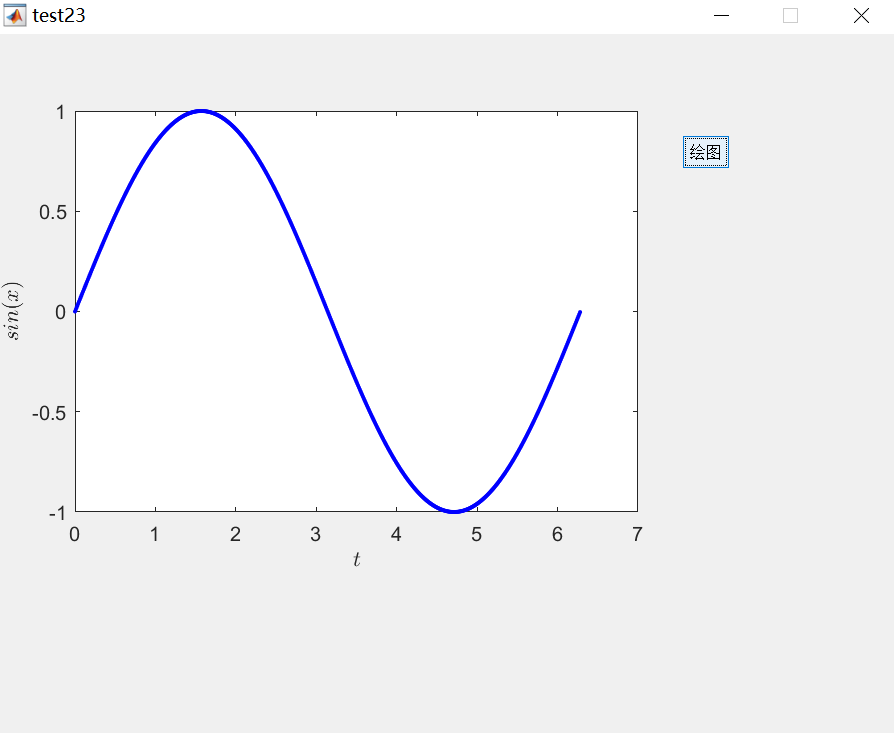
4. Click the Run icon (the green triangle icon) to activate the interface, which automatically generates two files with the same name but different formats. The file test23.fig saves the graphical information of the interface, while test23.m saves the program. Click the Plot button to observe the graph.
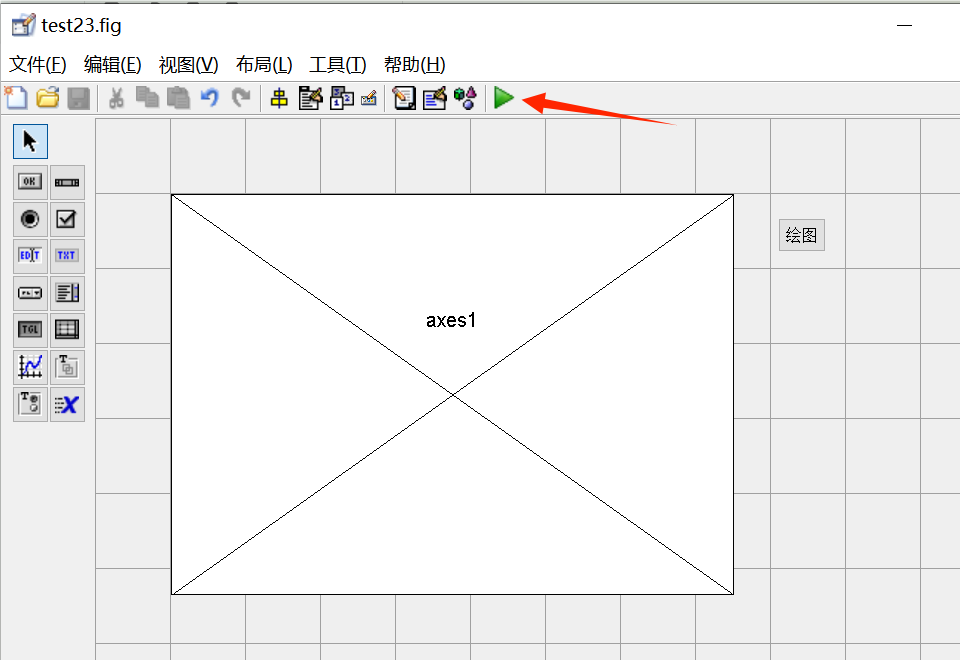
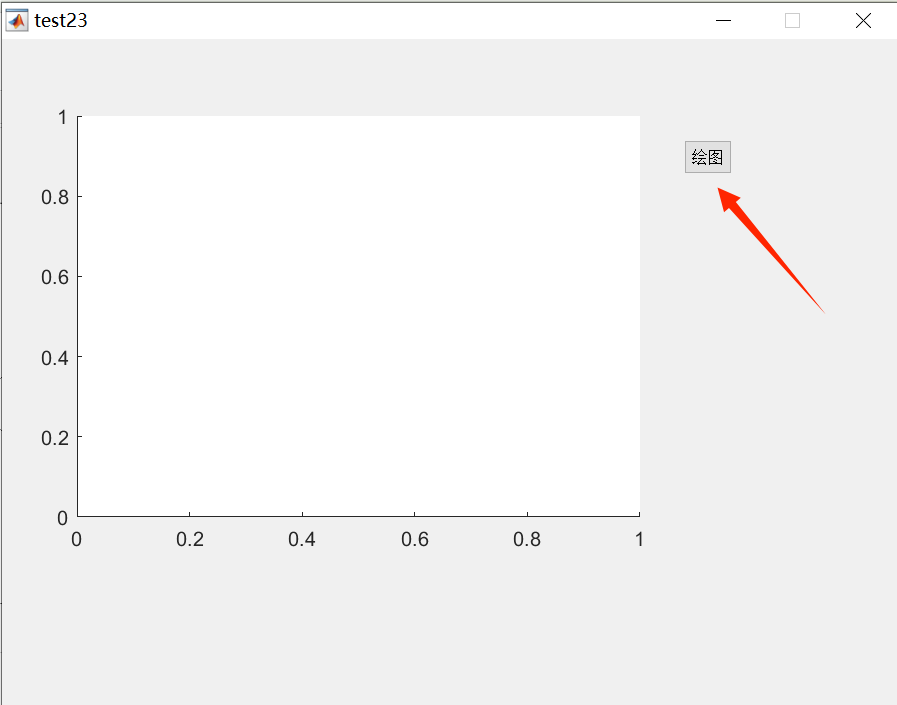
The result is shown in the figure below.
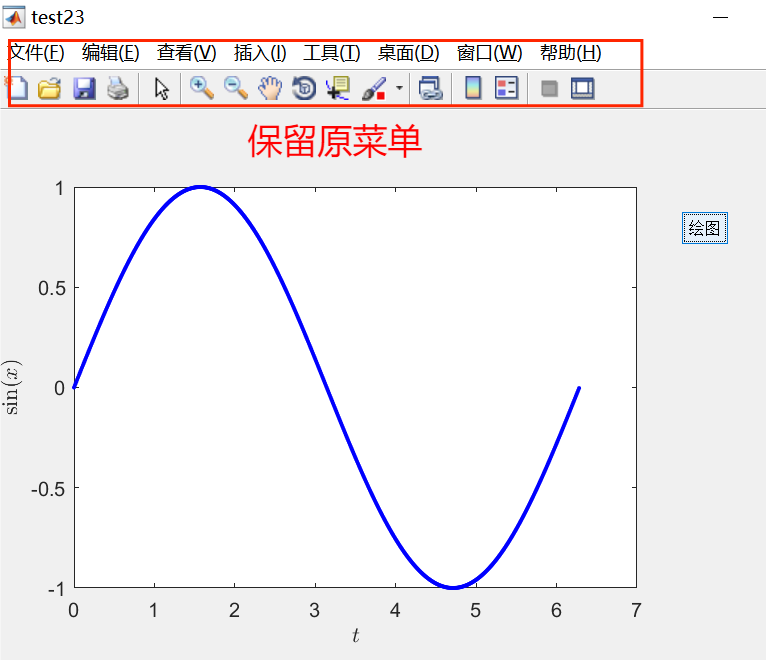
5. Retain the Original Menu. Click the Property Inspector and change the MenuBar property from None to figure to retain the original menu.
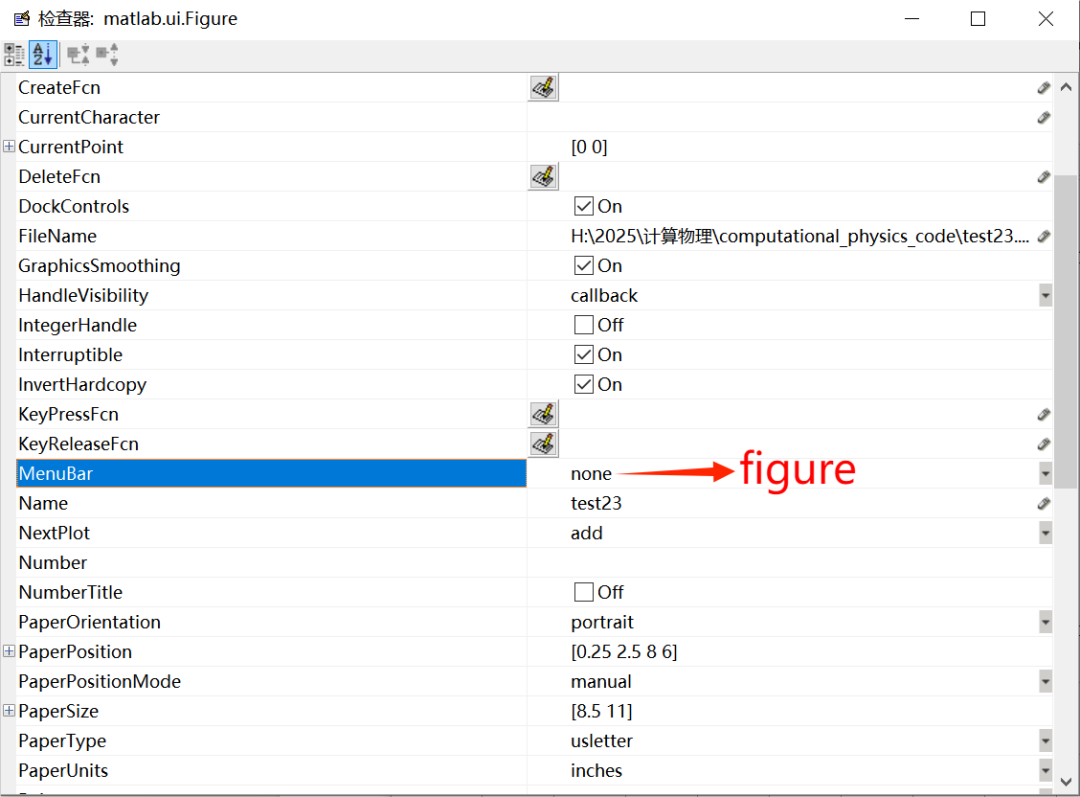
The running effect is shown in the figure below.
References
[1] Peng Fanglin, Fundamentals of Computational Physics (First Edition), Higher Education Press
 END
END

 Scan to Follow Us A complex world, simple rules