Linux | Red Hat Certified | IT Technology | Operations Engineer
👇 Join the technical exchange QQ group with 1000 members. Note 【Official Account】 for faster approval.

1: What is GDB / CGDB
GDB is a powerful and user-friendly debugging tool for Linux that allows developers to inspect the internal state of a program during its execution, control the flow of the program, and help locate and resolve bugs.
CGDB is a lightweight command-line visualization tool based on GDB that allows for graphical debugging of code in the terminal window, making it very convenient. Compared to GDB, it can greatly improve efficiency.
2: Installing CGDB
Linux – CentOS
Check if cgdb is installed on the machine.
[root@hcss-ecs-a9ee ~]# cgdb --version-bash: cgdb: command not foundIf you see the result above, Linux will kindly inform you that cgdb is not installed.
Install cgdb:
sudo yum install -y cgdb3: Background on Using CGDB
There are two ways to release a program: debug mode and release mode.
The binary programs generated by Linux gcc/g++ are, by default, in release mode.
To use cgdb for debugging, the -g option must be added when generating the binary program from the source code.
Below is the content in the Makefile used for automated compilation:
1 myexe: code.c
2     gcc -o $@ $^ -std=c99 -g
3 .PHONY: clean
4 clean:
5     rm -f myexe
4: CGDB Debugging Code – Instruction Learning
Below is the code to be used in this debugging session:
#include <stdio.h>
int Sum(int s, int e) {
    int sum = 0;
    int i = s;
    for(; i <= e; i++) {
        sum += i;
    }
    return sum;
}
int main() {
    printf("process is running\n");
    int start = 1;
    int end = 100;
    int result = Sum(start, end);
    printf("process is done, result: %d\n", result);
    return 0;
}
Generating Debug Files
Without debugging, the typical gcc command to compile a file is: gcc test.c -o test. However, if debugging is needed, the -g option must be added. The principle can be compared to the Visual Studio Code environment, where you know that when releasing a program, there can be both release and debug versions. Only when we choose the debug version can the program be debugged; otherwise, it cannot. Here, adding -g is equivalent to generating a debug version of the program, while omitting it defaults to the release version. The correct command is as follows:
gcc test.c -o test -g -std=c99Summary of Commands
This debugger operates in a pure command-line mode in the Linux environment, so there will be many commands.
Note: () indicates the full name of the command.
Name    Description
l(list)    Line number/function name    Displays corresponding code, 10 lines at a time.
r(run)    F5    Runs directly without breakpoints, starts from the first breakpoint if there are any.
b(breakpoint) + line number    Sets a breakpoint at the specified line.
b source file: function name    Sets a breakpoint at the first line of the function.
b source file: line number    Sets a breakpoint at that line in the source file.
info b    View breakpoint information.
breakpoint already hit 1 time    This breakpoint has been hit once.
d(delete) + current breakpoint number    Deletes a breakpoint (cannot use d + line number). If you haven't exited gdb yet, the breakpoint numbers will continue to increment.
d + breakpoints    Deletes all breakpoints.
disable b(breakpoints)    Disables all breakpoints (default is enabled).
enable b(breakpoints)    Enables all breakpoints (default is enabled).
disable b(breakpoint) + number    Disables a specific breakpoint.
enable b(breakpoint) + number    Enables a specific breakpoint.
enable breakpoint    Enables a specific breakpoint.
n(next)    Step over (equivalent to F10).
s(step)    Step into (equivalent to F11).
bt    Displays the process of function calls (function stack).
set var    Modifies the value of a variable.
p(print) variable name    Prints the value of the variable.
display    Tracks a variable, showing its value every time it stops (variable/structure...).
undisplay + variable name number    Cancels tracking of previously set variables.
Three Musketeers of Troubleshooting 🗡
Name    Description
until + line number    Jumps to the specified position, executing the code in the interval.
finish    Executes until the current function returns, then stops and waits for a command.
c(continue)    Runs directly from one breakpoint to the next (similar to pressing F5 continuously in VS).
Command Demonstration
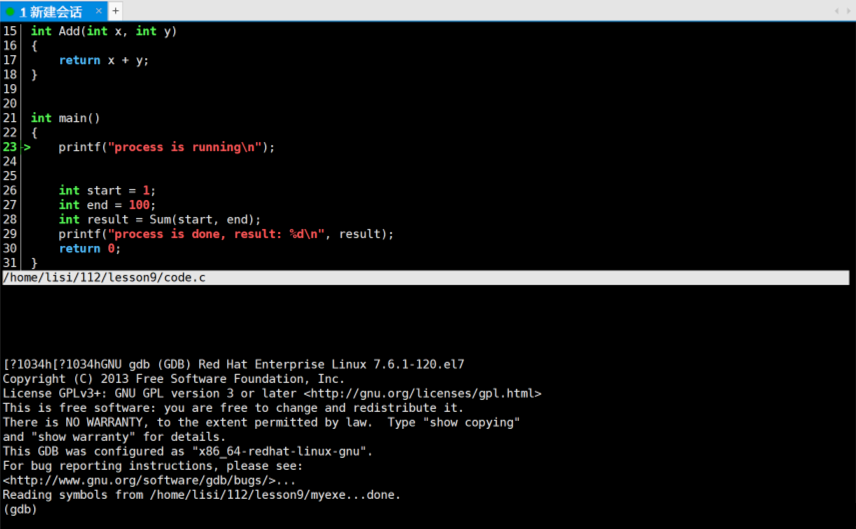
[lisi@hcss-ecs-a9ee lesson9]$ lscode.c  Makefile  myexe
[lisi@hcss-ecs-a9ee lesson9]$ cgdb myexe
First, we enter cgdb, and it will wait for us to input commands.
Line Number Display
l (list) line number/function name — Displays corresponding code, 10 lines at a time.
If you directly use [L], it will display 10 lines of content from the source file, which is not what we want.
[?1034h[?1034hGNU gdb (GDB) Red Hat Enterprise Linux 7.6.1-120.el7
Copyright (C) 2013 Free Software Foundation, Inc.
License GPLv3+: GNU GPL version 3 or later <http://gnu.org/licenses/gpl.html>
This is free software: you are free to change and redistribute it.
There is NO WARRANTY, to the extent permitted by law.  Type "show copying" and "show warranty" for details.
This GDB was configured as "x86_64-redhat-linux-gnu".
For bug reporting instructions, please see:<http://www.gnu.org/software/gdb/bugs/>...
Reading symbols from /home/lisi/112/lesson9/myexe...done.
(gdb) l
23          printf("process is running\n");
24          int start = 1;
25          int end = 100;
26          int result = Sum(start, end);
27          printf("process is done, result: %d\n", result);
28          return 0;
29  }(gdb)
If you use [L 0] or [L 1], it will start from the first line and list 10 lines of content.
Note that here L is lowercase, and there must be a space between L and the number.
(gdb) L  0
1  #include <stdio.h>
2  int Sum(int s, int e)
3  {
4      int sum = 0;
5      int i = s;
6      for(; i <= e; i++)
7      {
8          sum += i;
(gdb)
Next, if you want to see all the code we wrote, just press Enter a few more times, and cgdb will automatically remember the last command you entered.
Other commands are similar; everyone should experiment more.
5: Conclusion
Finally, let’s summarize what we learned in this article.
For gcc/g++, the default generated executable program is the 【Release】 version, so we need to add the -g command option to generate a 【Debug】 version of the executable program after make, allowing us to debug it. Then we officially entered the usage of the CGDB debugger, introducing many related commands. These are common commands I have compiled; in fact, there are many commands for CGDB, but the frequently used ones are just these. As long as you carefully study and become proficient in using them, I believe your debugging skills will significantly improve, which will also help you in debugging in VS. Finally, after learning many debugging commands for CGDB, we conducted a practical exercise on 【Swap Two Numbers】, which not only consolidated our knowledge of pass-by-address calls and function stack frames in C language but also enhanced our proficiency in using the CGDB debugger.
For course inquiries, add: HCIE666CCIE
↑ Or scan the QR code above ↑
What technical points and content would you like to see?
You can leave a message below to tell me!