
This tutorial includes some sample programs that can be debugged hands-on to deepen understanding. To debug ARM programs, we need an environment that can run ARM programs and a debugger that supports the ARM architecture. This tutorial will introduce how to set up an ARM cross-compilation, running, and debugging environment based on the x86 platform of Ubuntu 16.04.
Cross-Compilation Environment
Ubuntu 16.04’s repositories provide several arm-gcc packages. Taking gcc 5 as an example, you can find the packages “gcc-5-arm-linux-gnueabi” and “gcc-5-arm-linux-gnueabihf” using the “apt search” command. The compilation tools installed by these two packages are the same, only the default compilation options related to floating-point numbers differ. Since our virtual environment does not have an FPU, we only need to install “gcc-5-arm-linux-gnueabi”.
After installation, you can find the related toolchain in “/usr/bin/arm-linux-gnueabi-*”, which includes commonly used gcc, as, and ld, etc. Just use the following two commands to compile ARM assembly:
$ arm-linux-gnueabi-as [source file] –o [object file]
$ arm-linux-gnueabi-ld [object file] –o [executable file]
You can compile the classic “hello world” program using the following command for experiments in subsequent chapters:
Running Environment
I. qemu-user-static
The simplest running environment is to use qemu-user-static to simulate running statically compiled executable programs. We can use the following command to simulate running the hello program created in the previous section:
# First install qemu-user-static, if already installed, you can skip this step
$ sudo apt install qemu-user-static
# Directly execute the hello program
$ qemu-arm-static hello
# Start gdbserver and wait for gdb connection
$ qemu-arm-static –g [gdbserver port] hello
# First install qemu-user-static, if already installed, you can skip this step
$ sudo apt install qemu-user-static
# Directly execute the hello program
$ qemu-arm-static hello
# Start gdbserver and wait for gdb connection
$ qemu-arm-static –g [gdbserver port] hello
After running the above commands, a gdbserver that comes with qemu will start, listening on the port specified by the “-g” option. You can start gdb in another window for remote debugging (details of remote debugging will be introduced in Chapter 3).
II. Virtual Raspberry Pi
The qemu-user-static method is simple but limited in functionality. A tutorial from Azeria-labs introduces another method, using qemu to create a virtual Raspberry Pi. First, you need to install qemu-system:
To virtualize a Raspberry Pi, you also need to download a Debian image (Raspbian) tailored for Raspberry Pi and kernel files that support Raspberry Pi.
Raspbian image download link:https://www.raspberrypi.org/downloads/raspbian/
Raspberry Pi kernel download link:https://github.com/dhruvvyas90/qemu-rpi-kernel
Raspbian has two versions of its image, a full version with a graphical interface and a lite version without a graphical interface. For our experiments, the lite version is sufficient. There are multiple kernel files, and you can choose the latest version. After downloading the above files, create a directory named “arm_vm” and place the files there. Then execute the following command:
You should see something like the following:
Disk 2017-08-16-raspbian-stretch-lite.img: 1.7 GiB, 1854418944 bytes, 3621912 sectors
Units: sectors of 1 * 512 = 512 bytes
Sector size (logical/physical): 512 bytes / 512 bytes
I/O size (minimum/optimal): 512 bytes / 512 bytes
Disklabel type: dos
Disk identifier: 0xee397c53
Device Boot Start End Sectors Size Id Type
2017-08-16-raspbian-stretch-lite.img1 8192 93813 85622 41.8M c W95 FAT32 (LBA)
2017-08-16-raspbian-stretch-lite.img2 94208 3621911 3527704 1.7G 83 Linux
Note the red part, you can see that the filesystem starts from sector 94208. We multiply this value by 512, in this case, “94208 * 512=48234496”, which is the byte offset of the actual filesystem position that we will use in the following command:
$ sudo mkdir /mnt/raspbian
$ sudo mount -v -o offset=48234496 -t ext4 [path-of-your-img-file.img] /mnt/raspbian
$ sudo vi /mnt/raspbian/etc/ld.so.preload
Comment out all the contents of the above file with “#”, save changes and exit.
$ sudo vi /mnt/raspbian/etc/fstab
If the fstab file contains the string mmcblk0, replace “/dev/mmcblk0p1” with “/dev/sda1” and “/dev/mmcblk0p2” with “/dev/sda2”, save and exit. At this point, the system configuration changes are complete, and you can unmount “/mnt/raspbian”.
You can enter the “arm_vm” directory and use the following script to start the virtual machine:
#!/usr/bin/env bash
qemu-system-arm -kernel kernel-qemu-4.4.34-jessie \
-cpu arm1176 \
-m 256 \
-M versatilepb \
-serial stdio \
-append “root=/dev/sda2 rootfstype=ext4 rw” \
-drive format=raw,file=2017-08-16-raspbian-stretch-lite.img \
-redir tcp:5022::22 \# Reserve for ssh
-redir tcp:3011::3011 \# Reserve for gdbserver, for remote debugging
-no-reboot 1> /dev/null 2>&1 &
After the virtual machine starts, the default login password is “raspberry”. To make it easier to use the virtual machine, we need to enable the ssh service and set it to start at boot.
$ sudo service ssh start
$ sudo update-rc.d ssh enable
At this point, you should be able to access the virtual machine via ssh using the following command:
We can use the scp command via ssh to upload the hello program compiled in the previous section to the virtual machine for execution:
Entering the tmp directory of the virtual machine, you can see the uploaded hello program attempting to execute, and it should output the long-awaited “hello world!”, indicating that our cross-compilation environment setup is correct. Thus, our virtual Raspberry Pi environment setup is complete.
Debugging Environment
Setting up the debugging environment is the most important and has the most pitfalls. To simulate the remote debugging scenario in real IoT security practice, we will introduce how to cross-compile gdbserver and upload it to the virtual machine for remote debugging. To achieve powerful debugging effects similar to pwndbg, we will introduce how to install and use the gef enhancement script designed for IoT security.
I. gdb-multiarch
Before using gdb for debugging, we need to install gdb-multiarch. As the name suggests, it is a version of gdb that supports multiple hardware architectures. The reason for installing gdb-multiarch is that the default installed gdb in Ubuntu only supports x86/x64 architecture; you can start gdb and enter the command “set architecture arm” to check, and gdb will prompt an error.
# Install gdb-multiarch
$ sudo apt install gdb-multiarch
# Start gdb-multiarch
$ gdb-multiarch
II. Compile gdbserver
When analyzing the security of IoT devices, we often need to upload gdbserver for remote debugging. In our experimental environment (in fact, our Raspbian system comes with gdb), we can also simulate setting up a remote debugging environment. First, we need to obtain the source code of gdb (which includes the source code of gdb and gdbserver), and the version needs to match the version of gdb installed locally, as gdbserver needs to be consistent with the gdb version; otherwise, unexpected issues may arise. You can find the source code of various versions of gdb at this address:http://ftp.gnu.org/gnu/gdb/.
After downloading and extracting, enter the “gdb-<version>/gdb/gdbserver” directory, and use the following commands to compile and install:
$$ CC=”arm-linux-gnueabi-gcc-5″ CXX=”arm-linux-gnueabi-g++-5″ ./configure –target=arm-linux-gnueabi –host=”arm-linux-gnueabi” –prefix=”setup-directory”
$ make install
Then, in the path specified by the “–prefix” option, you can find the compiled gdbserver. Use the file command to check, and you should see something like the following output:
$ file arm-linux-gnueabi-gdbserver
arm-linux-gnueabi-gdbserver: ELF 32-bit LSB executable, ARM, EABI5 version 1 (SYSV), dynamically linked, interpreter /lib/ld-linux.so.3, for GNU/Linux 3.2.0, BuildID[sha1]=32ad2025951ee428276ac2fbadb199bfd39e2278, not stripped
Use scp to upload gdbserver to our virtual Raspberry Pi and start it:
$ ln -s arm-linux-gnueabi-gdbserver gdbserver
$ gdbserver 0.0.0.0:2333 hello
Process hello created; pid = 702
Listening on port 2333
At this point, our remote debugging environment setup is complete. In the next section, we will introduce the gef enhancement script.
III. gef Enhancement Script
gef is a gdb enhancement script that supports multiple hardware architectures, making it very suitable for the IoT security field to deal with various hardware platforms. You can refer to the README on the GitHub homepage (https://github.com/hugsy/gef) for installation and configuration. However, it should be noted that the third-party module keystone-engine, which gef depends on, needs to be installed manually, as the installation provided by pip is ineffective. It is recommended to install via pip first; if some functions of gef are still unavailable after installation, you can uninstall the third-party module installed via pip, download the latest source code from GitHub (https://github.com/keystone-engine/keystone), and compile and install it manually (see: http://www.keystone-engine.org/docs/).
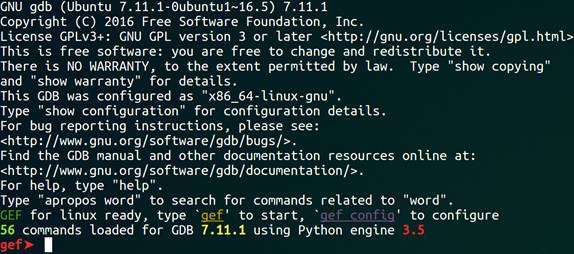
After installation, start gdb for debugging, and you will see an interface similar to the following:
First, set the target hardware architecture to arm:
gef> set architecture arm
We use the gef-remote command to connect to gdbserver; using the built-in “target remote” command of gdb may lead to some unexpected issues (see: https://github.com/hugsy/gef/issues/7).
gef> gef-remote –q 127.0.0.1:2333
You should see an output similar to the following:
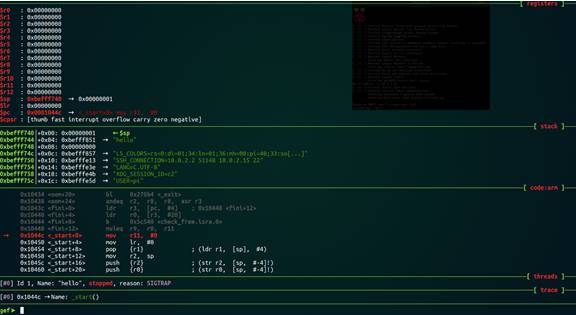
At this point, our debugging environment configuration is complete.
Further Reading
[1] Official gef documentation, http://gef.readthedocs.io/en/master/
[2] gdb debugging tool, http://linuxtools-rst.readthedocs.io/zh_CN/latest/tool/gdb.html
[3] Several debugging methods you should know in gdb, https://coolshell.cn/articles/3643.html

This article is translated by the KX translation team ljcnaix original
Please indicate from the KX community when reprinting

Popular Reads
-
Call for Topics | 2017 Security Developer Summit
-
Exploitation of ARM Vulnerabilities in IoT
-
Basic Tutorial on ARM Assembly Language – Introduction to ARM Assembly
-
CVE-2017-10661 Principle, Trigger Analysis
-
Modify Source Code to Achieve Global (No Root) Injection and Bypass Injection Detection
Click to read the original article/read,
More valuable content awaits you~