Hello everyone, welcome to <span>LiXin Embedded</span>.
Today, we are going to discuss something hardcore—Linux kernel core dumps, commonly known as coredumps. This tool is a lifesaver when debugging program crashes, especially in embedded development where device resources are limited and issues are deeply hidden. Coredumps can help you quickly locate the root cause of problems. In this article, we will explain the ins and outs of coredumps in simple terms, discussing their format, triggering mechanisms, and configuration methods.
What is a Linux Kernel Core Dump
In simple terms, a coredump is a snapshot of a process’s memory taken by the Linux system when the program crashes. This snapshot records the memory state, register values, stack information, etc., at the moment of the crash, essentially providing a full health check of the program. With it, you can use debugging tools like GDB to backtrack the program’s execution state and identify the cause of the crash.
For example, suppose you are working on a smart camera project, and the program suddenly crashes, with the logs only indicating a Segmentation Fault. At this point, the coredump acts like a black box, revealing what the crashing thread was doing, what the call stack looked like, and even the values of local variables. With this information, pinpointing the issue becomes much easier.
The coredump file uses the ELF format, which is quite common in embedded development, as our binary executable files and shared libraries are also in this format. The ELF file structure is complex, but don’t worry, I will highlight the key points later.
When Does a Coredump Get Triggered?
Not every program crash generates a coredump; only specific signals will cause the kernel to trigger a dump. Common signals include:
- SIGSEGV: Illegal memory access, such as accessing a null pointer or an out-of-bounds array, which is a common pitfall in embedded development.
- SIGBUS: Bus error, usually related to hardware-related memory access issues, such as alignment errors.
- SIGABRT: The program actively calls the abort function to terminate, such as when an assertion fails.
- SIGFPE: Floating-point exception, such as division by zero.
- SIGILL: Illegal instruction, possibly due to code tampering or issues with the compiler’s output.
- SIGQUIT: Exit signal triggered by the user via the keyboard.
- SIGSYS: Illegal system call, possibly calling an unsupported API in the kernel.
- SIGTRAP: Breakpoint or trace trap, usually related to debugging.
SIGSEGV and SIGBUS are old friends; eight out of ten crashes are related to them. For instance, if you are debugging a Linux system on a domestic MCU and the driver is not well-written, accessing a non-existent hardware register will immediately trigger SIGBUS; or in a multithreaded program, forgetting to add locks can lead to wild pointer operations, resulting in SIGSEGV.
When these signals are triggered, the kernel packages the process’s memory state into a coredump for you to analyze later. It contains the call stack, register states, local variable values, and all the necessary information.
How to Enable and Collect Coredumps
To ensure the system generates coredumps, some configuration is required. Here are the common steps:
1. Kernel Configuration
First, check if the kernel supports coredumps. At a minimum, ensure the following configuration options are enabled:
- CONFIG_COREDUMP=y
- CONFIG_CORE_DUMP_DEFAULT_ELF_HEADERS=y
These options determine whether the kernel can generate coredumps and whether the generated files contain standard ELF headers. The good news is that most Linux distributions (like Ubuntu, Yocto) have these options enabled by default. If you are working on a customized embedded system, such as a minimal system based on Buildroot, remember to check these in menuconfig.
2. Set ulimit
Having kernel support is not enough; the process’s resource limits must also be relaxed. The ulimit command controls how large a coredump file a process can generate. On embedded devices, storage space is precious, and coredumps can easily reach several MB or even tens of MB, so careful settings are necessary.
The simplest approach is to set the limit to unlimited:
ulimit -c unlimited
This command means allowing the process to generate coredump files of any size. In actual development, it is advisable to adjust this based on the device’s storage space, for example, limiting it to 100MB, which is sufficient without overwhelming the NAND flash memory.
3. Configure core_pattern
After generating a coredump, where is it stored? How is the filename determined? These are controlled by the /proc/sys/kernel/core_pattern file. This file acts like a template, telling the kernel how to handle coredumps.
For example, to store coredumps in the /tmp directory with filenames that include the process name and PID, you can configure it like this:
echo "/tmp/core.%e.%p" > /proc/sys/kernel/core_pattern
Here, %e is the name of the crashing process, and %p is the process’s PID. For instance, if the program camera crashes with PID 1234, the generated file will be /tmp/core.camera.1234.
A more advanced approach is to pipe the coredump to a program for processing. For example, if you are developing an IoT device and want to send the coredump directly to the cloud for analysis, you can configure it like this:
echo "|/usr/bin/my_coredump_handler %e %p" > /proc/sys/kernel/core_pattern
In pipe mode, the coredump will be sent to the specified program via standard input, and parameters like %e and %p will be passed as command-line arguments. This method is particularly useful in embedded systems, as it allows for real-time processing of coredumps, saving storage space.
ELF File Structure of Coredumps
A coredump is essentially an ELF file that contains a snapshot of the crashing process’s memory and some metadata. The ELF format is complex, but we will focus on the key points related to coredumps.
1. ELF Header
The beginning of an ELF file is a header that records basic information about the file, such as:
- Whether it is a 32-bit or 64-bit system
- Whether it is big-endian or little-endian byte order
- The target architecture (e.g., ARM, AArch64)
- The offset address of the program header
In embedded development, the ARM architecture is the most common. If you are debugging a RK3399 development board, the ELF header in the generated coredump will indicate e_machine as EM_AARCH64, signifying a 64-bit ARM architecture.
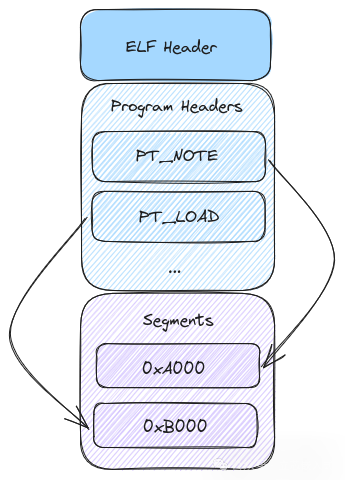
2. Program Header and Segments
The essence of an ELF file lies in the program header, which defines the various segments of the file. The two most important segments in a coredump are:
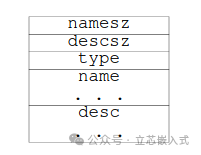
- PT_NOTE: Stores metadata, such as thread information and register states. Its structure is flexible and can accommodate various custom information.
- PT_LOAD: Stores the process’s memory content, such as heap, stack, and code segments. These segments represent the memory snapshot at the time of the program crash.
For example, if your program has a thread processing image data and crashes while a local variable on the stack holds the image width, the PT_LOAD segment will contain the memory content of that stack, while the PT_NOTE segment will inform you of the thread’s register state. When GDB loads the coredump, it can directly read the variable value.
Practical Case: Real-World Application of Coredumps
Having discussed so much theory, let’s get practical. Suppose you are debugging a Linux-based industrial gateway, and the program occasionally crashes inexplicably, with the logs providing little useful information. At this point, the coredump is your savior.
First, configure ulimit and core_pattern to ensure coredumps can be generated. Let’s say you store the files in /tmp/core.%e.%p.
Second, when the program crashes, a coredump file is generated. Load it using GDB:
gdb /path/to/your_program /tmp/core.program.1234
In GDB, use the bt command to view the call stack, info registers to check the register state, and print to view variable values. If you find that the crash was due to a null pointer dereference, and the call stack points to a function in a third-party library, it is likely a library issue, and you should contact the vendor.
However, on embedded devices, storage space is limited, and coredump files can be quite large, often tens of MB. In this case, you can use pipe mode to send the coredump to a lightweight processing program that extracts key information (like the call stack and registers), compresses it, and uploads it to a server. This way, you save space while enabling remote analysis.
Experience Summary
Coredumps are powerful debugging tools in development, but to use them effectively, keep the following points in mind:
- Space Management: Storage is tight on embedded devices, so when configuring ulimit, avoid setting it to unlimited all at once, as it can easily fill up the filesystem.
- Real-Time Processing: Using the pipe mode of core_pattern along with a custom processing program can significantly reduce storage pressure.
- Toolchain Compatibility: Ensure your GDB and compiler versions are compatible; otherwise, you may not be able to read the symbol information in the coredump.
In the next article, we will delve deeper into optimizing the generation and handling of coredumps, especially on resource-constrained embedded devices, focusing on how to minimize the size of coredump files while retaining essential debugging information.