Introduction to GDB
The GNU Project Debugger (GDB) is a long-standing program written by Richard Stallman in 1986, supporting multiple languages including C/C++ and modern languages like Rust. GDB is a command-line application, but there are many graphical user interface front-ends and IDE integrations available. For this tutorial, we will use the command-line interface as it does not rely on external dependencies and is easy to use.
Setting Up GDB for Rust Debugging
You will need a recent version of Rust (1.39+) and GDB (8.x+). Ensure that the <span>rust-gdb</span> executable is in the same directory as <span>rustc</span>. You can create a new Rust project using the following commands:
cargo new rust-gdb-example
cd rust-gdb-example
Then edit <span>Cargo.toml</span> to add Tokio as a dependency:
[dependencies]
tokio = { version = "1.1", features=["full"] }
Here we only added Tokio because we will build a very basic asynchronous TCP example to demonstrate how to debug asynchronous functions just like regular functions.
<span>rust-gdb</span>‘s Role
<span>rust-gdb</span> is a precompiled binary that is automatically installed with Rust, which loads external Python printing scripts into GDB. This is very useful when debugging more complex Rust programs as it significantly improves the display of Rust data types.
For example, a Vec with pretty-printing looks like this:
Vec(size=3) = {Animal {kind: Cat, name: "Chip", age: 4}, Animal {kind: Cat, name: "Nacho", age: 6}, Animal {kind: Dog, name: "Taco", age: 2}}
Without pretty-printing, it appears much more complex.
Debugging Example
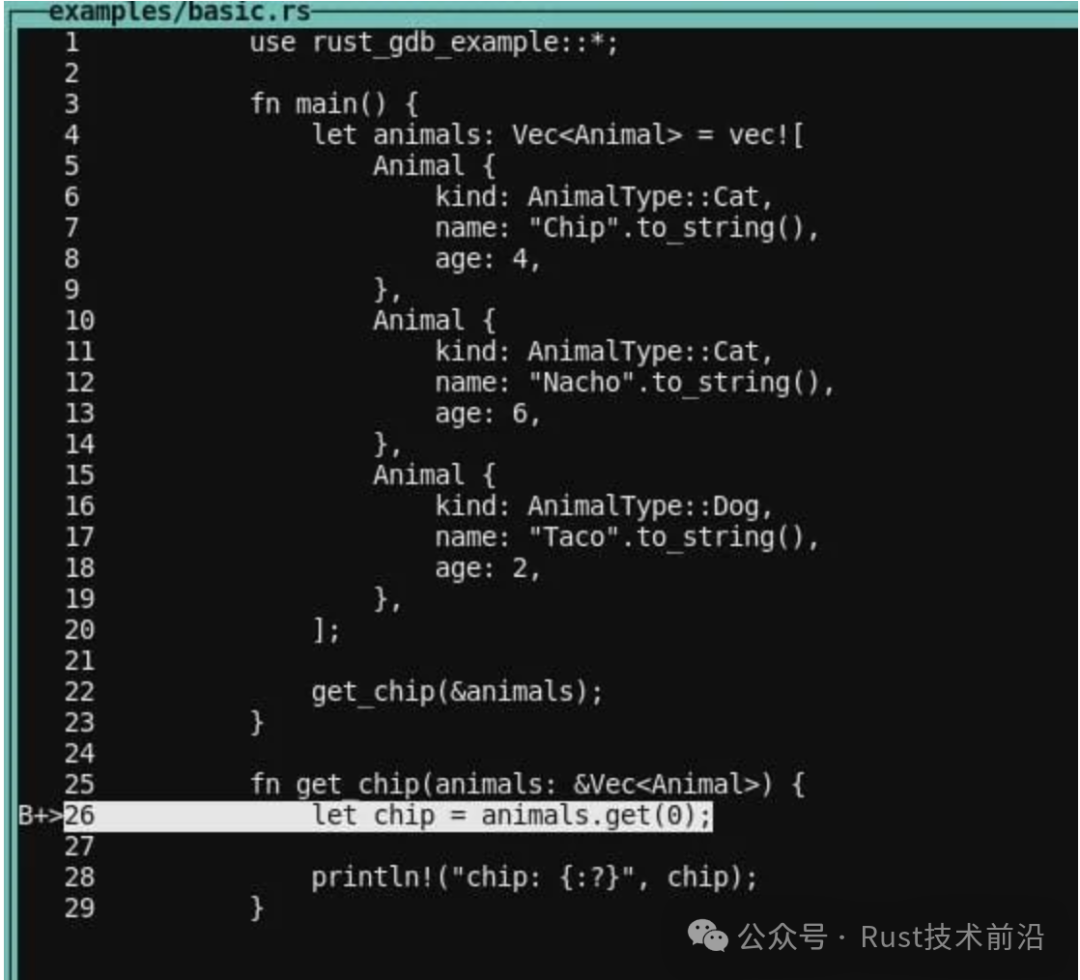
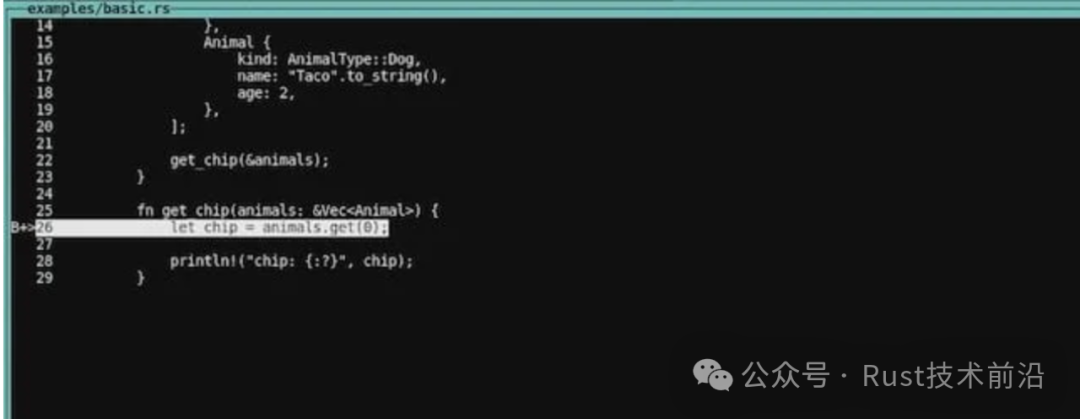
Here is a simple example demonstrating how to use GDB to debug Rust code. First, create an examples folder in the project and add a basic.rs file:
use rust_gdb_example::*;
fn main() {
   let animals: Vec<Animal> = vec![
       Animal {
           kind: AnimalType::Cat,
           name: "Chip".to_string(),
           age: 4,
       },
       // omitted for brevity
   ];
   get_chip(&animals);
}
fn get_chip(animals: &Vec<Animal>) {
   let chip = animals.get(0);
   println!("chip: {:?}", chip);
}
This simple code initializes a list of animals and calls a function to print the first animal in the list. To debug, ensure you build in debug mode rather than release mode:
cargo build --example basic
rust-gdb target/debug/examples/basic
After starting <span>rust-gdb</span>, you can begin debugging by setting breakpoints, for example using the <span>b get_chip</span> command. Then run the program, and when it hits the set breakpoint, the program will pause, allowing you to inspect variable values and other information. This debugging method is very helpful for understanding the internal workings of the program, especially when dealing with complex logic or errors. This starts the program. We stop at the defined breakpoint, which is the first line of the <span>get_chip</span> function. Here you can inspect the function parameters and try to print them:
(gdb) info args
animals = 0x7fffffffd760
(gdb) p animals
$1 = (*mut alloc::vec::Vec<rust_gdb_example::Animal>) 0x7fffffffd760
(gdb) p *animals
$2 = Vec(size=3) = {rust_gdb_example::Animal {kind: rust_gdb_example::AnimalType::Cat, name: "Chip", age: 4}, rust_gdb_example::Animal {kind: rust_gdb_example::AnimalType::Cat, name: "Nacho", age: 6}, rust_gdb_example::Animal {kind: rust_gdb_example::AnimalType::Dog, name: "Taco", age: 2}}
<span>info args</span> command provides an overview of the incoming parameters. When we use <span>p</span> (<span>print</span> can also be used) to print <span>animals</span>, GDB tells us this is a pointer to <span>Vec<Animal></span>, but since it is just a pointer, it does not display the contents of that <span>Vec</span>. You can also use <span>display</span> to print variables, which has formatting options (like string, pointer, integer, etc.). The difference from <span>print</span> is that using <span>display</span> will repeat the printed value every time you execute a step command, which helps monitor changes in values.
You need to dereference the pointer using <span>*animals</span>. If you print this, you will get the complete, readable list of animals. Basic pointer operations and type conversions are some common techniques used when dealing with struct references.
Now that we are at the first breakpoint, do you want to visually see where we are in the source code? Layout and inspect the state. The layout in GDB helps you see your position in the Rust source code. Use the <span>layout src</span> command to open the command-line interface:
Our command prompt remains below it. This way, you won’t be confused about your current position. There are other layouts, such as <span>layout split</span>, which shows both the source code and the corresponding assembly code:
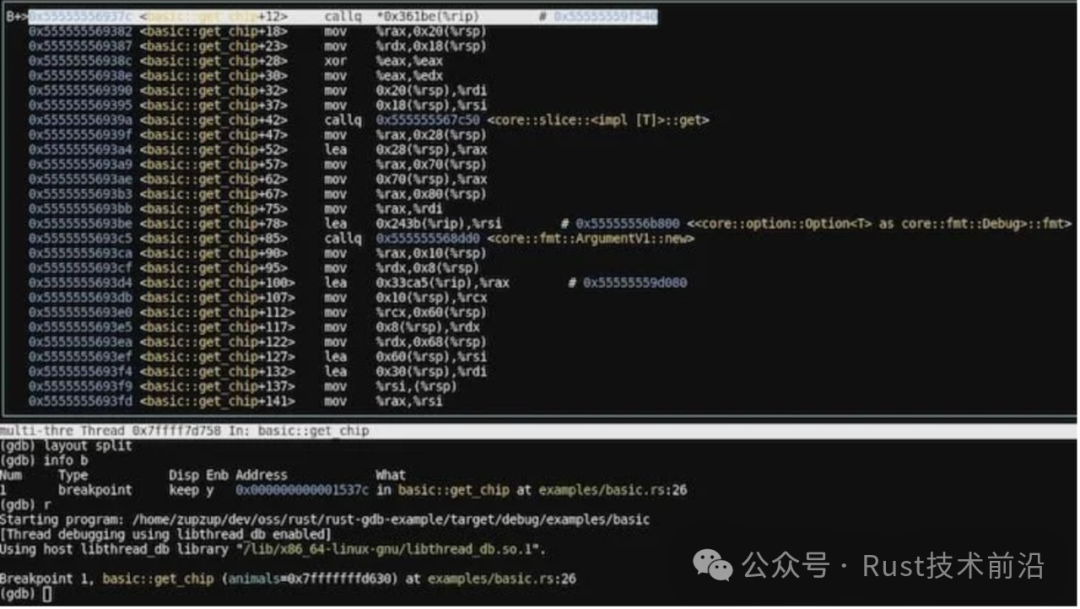
To exit the layout, you can use <span>CTRL+X a</span>. If rendering issues occur, <span>CTRL+L</span> will refresh it (this can happen sometimes).
Like other debuggers, you can step through the code using <span>n</span> or <span>next</span>, or use <span>s</span> or <span>step</span> to enter functions on the current line. To repeat these commands, just press the enter key to repeat the last command.
Let’s move forward one line to see what the internal state of the <span>chip</span> variable is after calling <span>.get</span>:
(gdb) n
28            println!("chip: {:?}", chip);
(gdb) p chip
$3 = core::option::Option<&rust_gdb_example::Animal>::Some(0x5555555a1480)
(gdb) print *(0x5555555a1480 as &rust_gdb_example::Animal)
$4 = rust_gdb_example::Animal {kind: rust_gdb_example::AnimalType::Cat, name: "Chip", age: 4}
Manipulating State and Watchpoints. Let’s create another example in the <span>examples</span> folder in the <span>nested.rs</span> file:
use rust_gdb_example::*;
fn main() {
   let animals: Vec<Animal> = vec![
       Animal { kind: AnimalType::Cat, name: "Chip".to_string(), age: 4 },
       // omitted for brevity
   ];
   let mut some_person = Person {
       name: "Some".to_string(),
       pets: animals,
       age: 24,
   };
   println!("person: {:?}", some_person);
   some_person.age = 100;
   some_person.name = some_func(&some_person.name);
}

fn some_func(name: &str) -> String {
   name.chars().rev().collect()
}
Rebuild the project and start with the binary file <span>rust-gdb</span>:
cargo build --example nested
rust-gdb target/debug/examples/nested
Set breakpoints and run the program:
(gdb) b nested.rs:22
Breakpoint 1 at 0x17abf: file examples/nested.rs, line 22.
(gdb) b nested.rs:27
Breakpoint 2 at 0x17b13: file examples/nested.rs, line 27.
(gdb) r
Starting program: /home/zupzup/dev/oss/rust/rust-gdb-example/target/debug/examples/nested
[Thread debugging using libthread_db enabled]
Using host libthread_db library "/lib/x86_64-linux-gnu/libthread_db.so.1".
Breakpoint 1, nested::main () at examples/nested.rs:22
22            let mut some_person = Person {
After reaching the first breakpoint, continue to the print statement, then set a watchpoint for <span>some_person.age</span> so that we are notified whenever it changes:
(gdb) c
(gdb) watch some_person.age
Hardware watchpoint 3: some_person.age
(gdb) n
person: Person { ... }
28            some_person.age = 100;
(gdb) n
Hardware watchpoint 3: some_person.age
Old value = 24
New value = 100
Rerun the program, and this time when you reach the second breakpoint, manually change the value:
(gdb) set some_person.age = 22
(gdb) p some_person
Additionally, you can execute functions in GDB and see the return results:
(gdb) p some_func("Hello")
$3 = "olleH"
In this way, you can not only observe the state changes of variables but also directly modify variable values during debugging, and even execute functions, which is very helpful for deeply understanding the behavior of the program. We can call the some_func function in scope, passing a string literal. We can also call it using some_person.name, and we can use the set command to set the person’s name to the reversed value. This is very helpful for checking expressions and function results during debugging, effectively uncovering potential issues. While this is sufficient for most simple scenarios, you may encounter some obstacles when trying to execute functions involving I/O operations or other more complex tasks. However, in 99% of cases, the existing functionality is more than adequate.
「Click 👇 to follow」
Like + Share + View to quickly improve your programming skills👇
Reference link: https://blog.logrocket.com/debugging-rust-apps-with-gdb/