
Author: Parul Pandey
Translated by: Wu Huicong
Proofread by: Wu Zhendong
This article is approximately 2600 words, recommended reading time is 8 minutes.
This article will introduce 10 simple tips to speed up data mining in Jupyter Notebook.

Introduction
Tips and tricks are always very useful, especially in programming. Sometimes, a little hack can save you a lot of time and effort. A small shortcut or add-on can sometimes be a gift from heaven, becoming a practical efficiency booster. Therefore, I am here to introduce some of my favorite tips and tricks that I use while programming, compiled in this article for everyone. Some may be familiar to you, while others may be new; I believe they will facilitate your next data analysis project.
1. Preview Dataframe Data in Pandas
Profiling is a process that helps us understand the data. In Python, the Pandas Profiling package can accomplish this task, enabling quick exploratory data analysis on Pandas DataFrames. The df.describe() and df.info() functions in Pandas usually achieve the first step of the EDA process, but providing only very basic data previews does not help analyze large datasets. On the other hand, the Pandas Profiling function can display a wealth of information with just one line of code, and this is also true in the interactive HTML report.
For a given dataset, the Pandas Profiling package will calculate the following statistics:
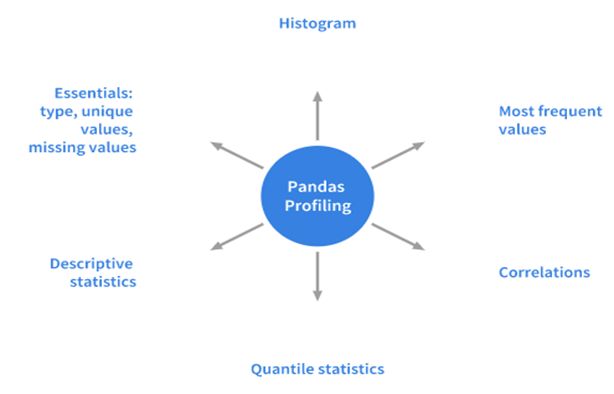
Statistics calculated by the pandas profiling package
Code Example:
-
Installation
In Python 2.x, use pip or conda to install the pandas-profiling package:
pip install pandas-profiling or conda install -c anaconda pandas-profiling-
Usage
Now let’s demonstrate the results of the versatile Python profiler using an old Titanic dataset:
# importing the necessary packages
import pandas as pd  # Using pandas package
import pandas_profiling  # Using the newly installed pandas profiling package
df = pd.read_csv('titanic/train.csv')  # Reading data to form DataFrame
pandas_profiling.ProfileReport(df)  # Using pandas profiling to analyze data
This line is all the code you need in Jupyter Notebook to generate a data analysis report. This data report is very detailed and includes all necessary charts.
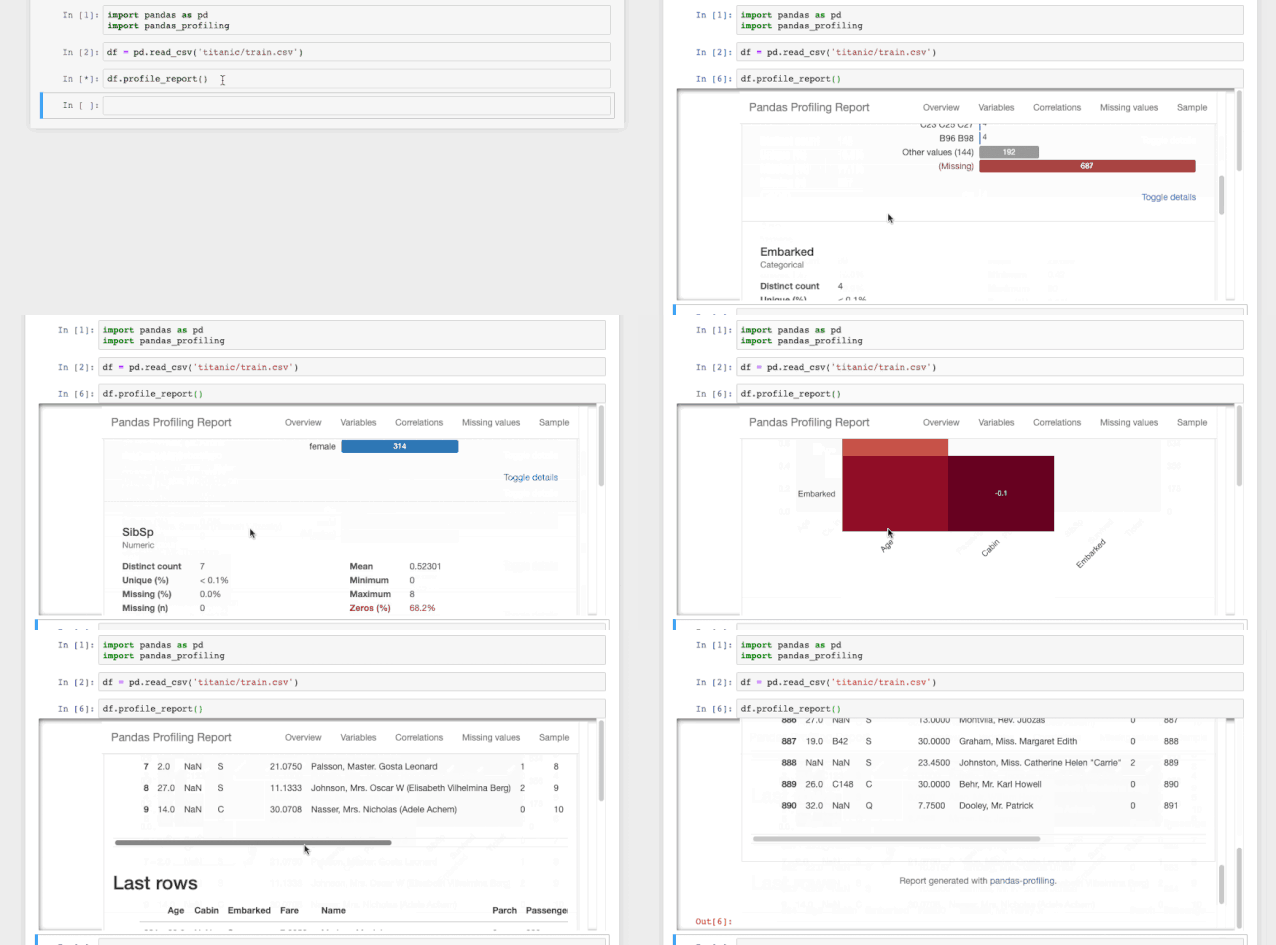
Figure 1.1
This report can also be exported as an interactive HTML file:
profile = pandas_profiling.ProfileReport(df)
profile.to_file(outputfile="Titanic data profiling.html")  # Generate Titanic data profiling.html webpage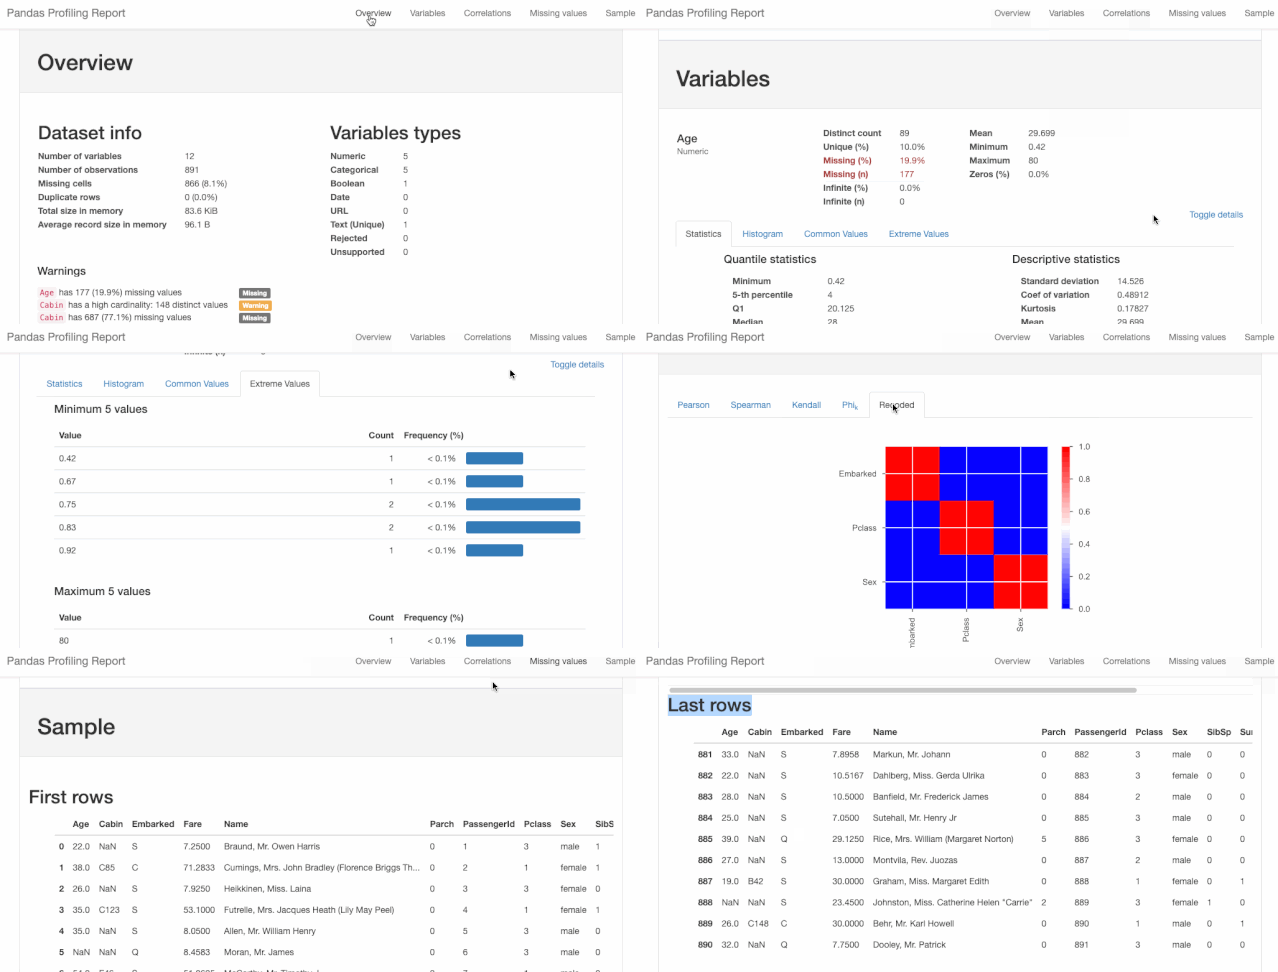
Figure 1.2
2. Interactivity of Pandas Plots
Pandas has a built-in .plot() function as part of the DataFrame, but because the visualizations presented by this function are not interactive, its functionality is less appealing. Moreover, using the pandas.DataFrame.plot() function to draw charts is not easy. What if we want to draw interactive charts with pandas without making significant changes to the code? Well, you can achieve this with the help of the Cufflinks package.
The Cufflinks package combines the powerful Plotly and the flexible, easy-to-use Pandas, making it very convenient for plotting. Now let’s see how to install and use this package in Pandas.
Code Example:
-
Installation
In Python 2.x, use pip to install Plotly and Cufflinks:
pip install plotly  # Plotly is a pre-requisite before installing cufflinks
pip install cufflinks-
Usage
Invocation:
# importing Pandas
import pandas as pd  # Using pandas package
# importing plotly and cufflinks in offline mode
import cufflinks as cf  # Using cufflinks and plotly packages
import plotly.offline
cf.go_offline()  # Using functions from the cufflink package
cf.set_config_file(offline=False, world_readable=True)
Now let’s take a look at the magic displayed by the Titanic dataset:
df.iplot()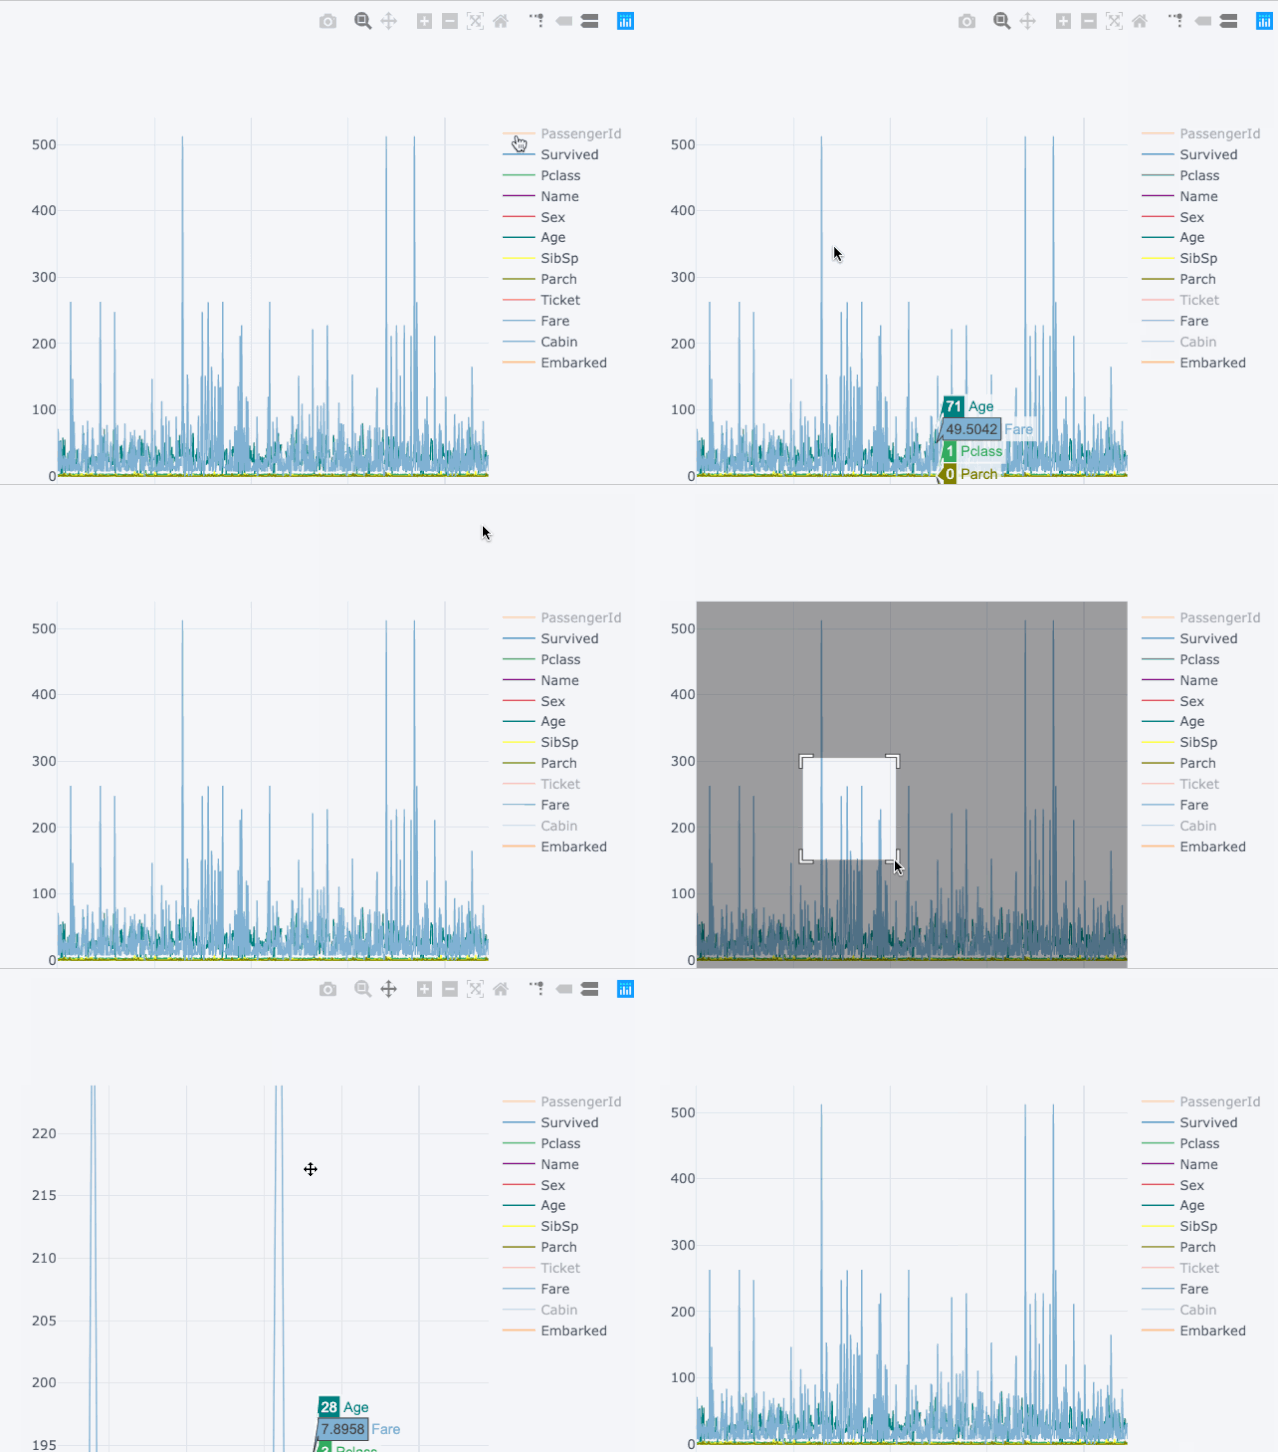
Figure 2.1
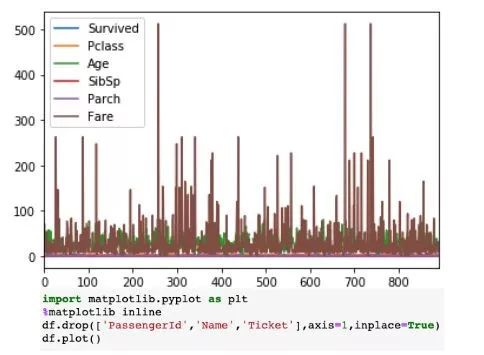
Figure 2.2
The visualization on the right is a static line chart, while the chart on the left is interactive and more detailed, with no major changes in the code.
More examples will be available in the GitHub link:
https://github.com/santosjorge/cufflinks/blob/master/Cufflinks%20Tutorial%20-%20Pandas%20Like.ipynb
3. A Bit of Magic
Magic commands are a set of convenient functions in Jupyter Notebook designed to solve some common issues in data analysis. You can use %lsmagic to view all magic commands.
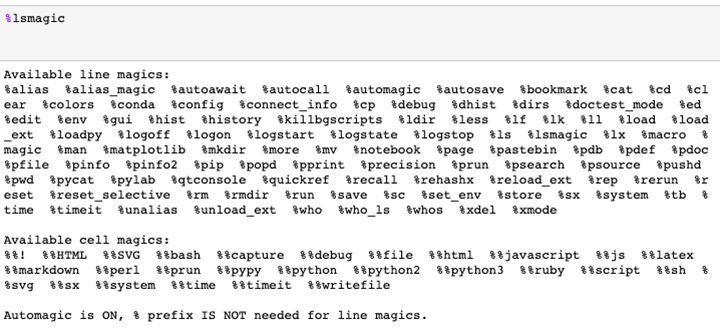
The above image lists all available magic functions
Magic commands come in two categories: line magic commands, prefixed with a single % character for single-line input operations; and cell magic commands, prefixed with double %% characters for multi-line input operations. If set to 1, we do not need to type % when using magic functions.
Now let’s take a look at some commands that might be used in common data analysis tasks.
-
% pastebin
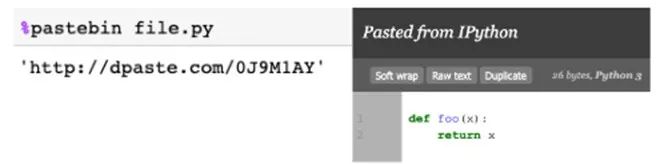
% pastebin uploads code to Pastebin and returns a link. Pastebin is an online content hosting service where we can store plain text, such as source code snippets, and the generated link can also be shared with others. In fact, GitHub Gist is similar to Pastebin, but it comes with version control.
Code Example:
Let’s take a look at the contents of this file.py Python code file:
#file.py
def foo(x):
    return x
Use % pastebin in Jupyter Notebook to generate a Pastebin link.
-
%matplotlib notebook
%matplotlib inline function is used to present static matplotlib charts in Jupyter Notebook. We can try using notebook instead of inline to get plots that are easily zoomable and resizable, but ensure to call this function before applying the matplotlib package.
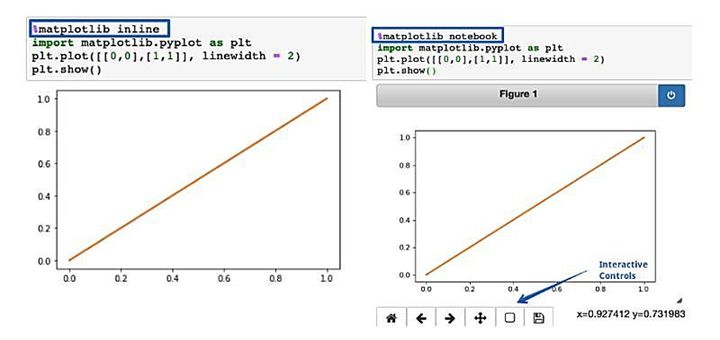
%matplotlib inline vs %matplotlib notebook
-
%run
%run function is used to run a Python script file in Jupyter Notebook.
-
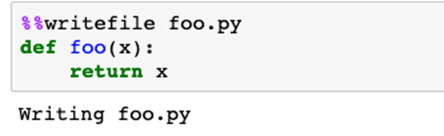
%%writefile
%% writefile writes the content of the executing cell to a file. The following code will write to a file named foo.py and save it in the current directory.
-
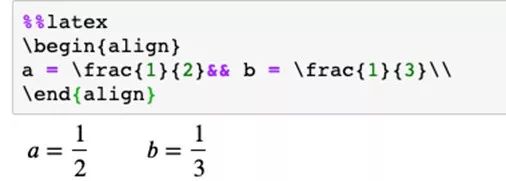
%%latex
%% latex function presents the content of the cell in LaTeX form. It is useful for writing mathematical formulas and equations in the cell.
4. Discover and Reduce Errors
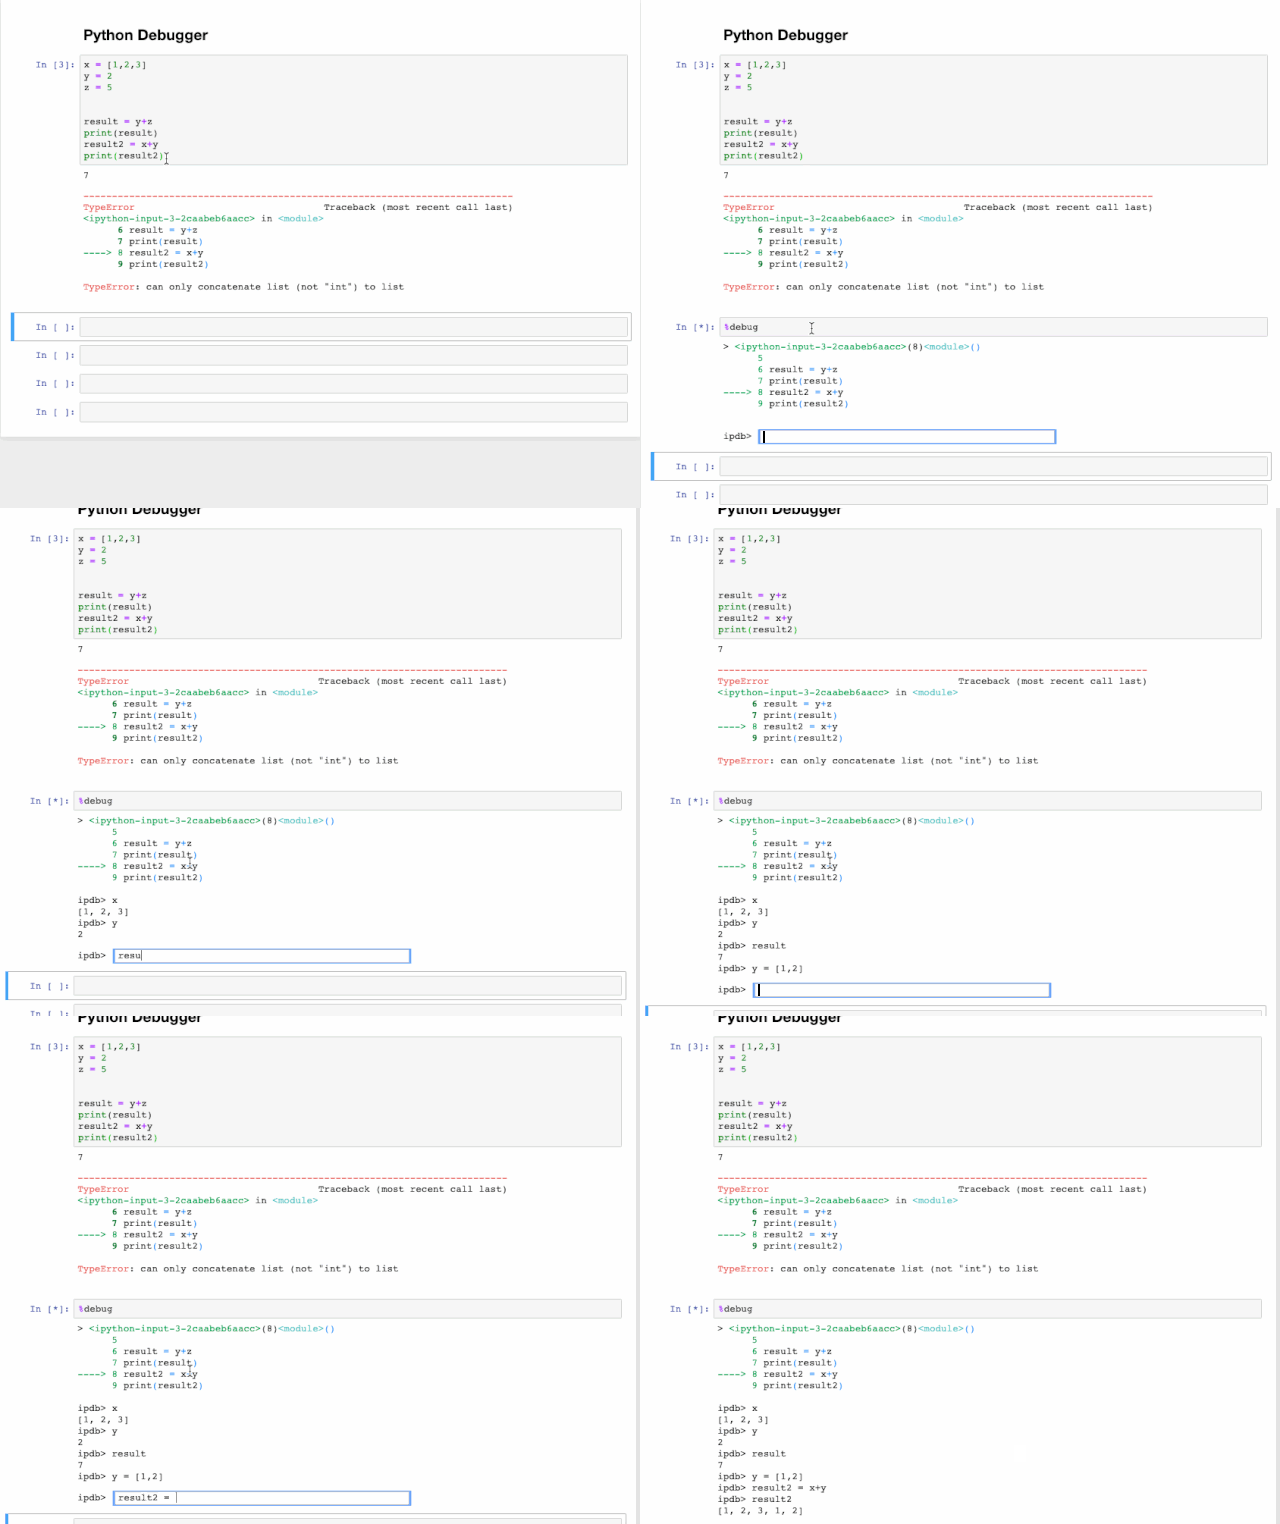
The interactive debugger is also a magic function, but I must classify it. If you encounter an exception when running a code cell, you can type %debug in a new line to run it. This will open an interactive debugging environment that tells you where the exception occurred in the code. You can also check the values of variables assigned in the program and perform operations here. Press q to exit the debugger.
5. Output Can Be Beautiful Too
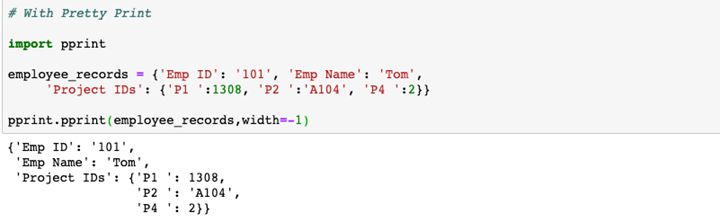
If you want to generate beautiful data structures, pprint is the preferred module. It is particularly useful when outputting dictionary data or JSON data. Let’s take a look at an example of output from print and pprint:

6. Make Tips Stand Out
You can use tip/note boxes in your Jupyter Notebook to highlight any important content. The color of the note depends on the specified tip type. Just add the content you want to highlight in the code.
-
Blue Tip Box: Note
Code Example:
<div class="alert alert-block alert-info"># Start of tip box<b>Tip:</b> Use blue boxes (alert-info) for tips and notes. If it’s a note, you don’t have to include the word “Note”.# Content of tip box</div># End of tip boxOutput result:

-
Yellow Tip Box: Warning
Code Example:
<div class="alert alert-block alert-warning"><b>Example:</b> Yellow Boxes are generally used to include additional examples or mathematical formulas.</div>Output result:

-
Green Tip Box: Success
Code Example:
<div class="alert alert-block alert-success">Use green box only when necessary like to display links to related content.</div>Output result:

-
Red Tip Box: Danger
Code Example:
<div class="alert alert-block alert-danger">It is good to avoid red boxes but can be used to alert users to not delete some important part of code etc. </div>Output result:

7. Output All Results in an Execution Cell
Now let’s take a look at a few lines of code contained in a Jupyter Notebook cell:
In[1]: 10+5                 11+6
Out[1]:  17
Typically, an execution cell only outputs the last line’s result, and for other outputs, we need to add the print() function. Well, it turns out that we can output each result by adding the following code at the beginning of the Jupyter Notebook:
from IPython.core.interactiveshell import InteractiveShell
InteractiveShell.ast_node_interactivity = "all"
Now all results can be output one by one:
In[1]: 10+5                 11+6       12+7
Out[1]: 15
Out[1]: 17
Out[1]: 19
If you want to revert to the initial setting:
InteractiveShell.ast_node_interactivity = "last_expr"8. Run Python Script Files with the ‘i’ Option
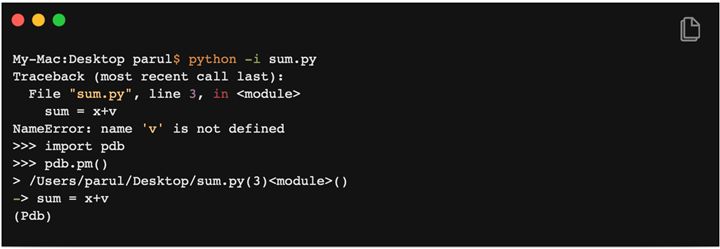
The typical way to run a Python script from the command line is: python hello.py. However, if you add an -i when running the same script file, such as python -i hello.py, it brings more benefits. Let’s see how:
First, once the program ends, Python will not exit the interpreter. Therefore, we can check the values of variables and the correctness of functions defined in the program.
Secondly, we can easily call the Python debugger since we are still in the interpreter:
import pdb
pdb.pm()
This will take us to the point where the exception occurred, and then we can handle the code.
Source code link:
http://www.bnikolic.co.uk/blog/python-running-cline.html
9. Automatically Add Code Comments
Ctrl / Cmd + / command will automatically comment the selected lines in the execution cell. Clicking the combination again will uncomment the same lines of code.
10. Deleting Is Easy to Undo
Have you ever accidentally deleted a cell in Jupyter Notebook? If so, here’s a shortcut to undo that deletion.
-
If you accidentally delete the content of a cell, you can easily restore it by clicking CTRL/CMD+Z.
-
If you want to restore all content of the deleted cell, you can click ESC+Z or EDIT > Undo Delete Cells.
Conclusion
In the above, I have listed important tips that I have gathered while using Python and Jupyter Notebook. I believe they can help you and allow you to apply what you have learned. At that point, we can happily write code!
Original title:
10 Simple hacks to speed up your Data Analysis in Python
Original link:
https://towardsdatascience.com/10-simple-hacks-to-speed-up-your-data-analysis-in-python-ec18c6396e6b
Translator’s Profile

Wu Huicong, a graduate from Dalhousie University in Canada with a double major in Computer Science and Statistics, focusing on Data Science. Preparing to pursue a Master’s in Data Analysis (AI direction). Very sensitive to numbers, skilled in various data models and analysis, hoping to go further in the field of Data Science and eager to meet more like-minded friends.
Recruitment Information for Translation Team
Job Description: Selecting quality foreign articles to accurately translate into fluent Chinese. If you are an international student majoring in Data Science/Statistics/Computer Science, or working overseas in related fields, or confident in your foreign language skills, the Data Team welcomes you to join!
What You Can Gain: Improve your understanding of cutting-edge data science, enhance awareness of foreign news sources, and overseas friends can maintain contact with domestic technical application development. The Data Team’s background in industry-academic-research provides good development opportunities for volunteers.
Other Benefits: Collaborate and communicate with data scientists from renowned companies and students from top universities like Peking University, Tsinghua University, and other overseas institutions.
Click at the end of the article on “Read the Original” to join the Data Team~
Copyright Notice
If you need to reprint, please indicate the author and source prominently at the beginning of the article (Reprinted from: Data Team THU ID: DatapiTHU), and place a prominent QR code for Data Team at the end of the article. For articles with original identifiers, please send 【Article Name – Pending Authorization Public Account Name and ID】 to the contact email to apply for whitelist authorization and edit according to requirements.
After publishing, please feedback the link to the contact email (see below). Unauthorized reprints and adaptations will be legally pursued.

Click “Read the Original” to embrace the organization.