Detailed Explanation of Matlab Fitting
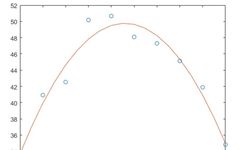
Polynomial Fitting clear x=1:1:10;y=-0.9*x.^2+10*x+20+rand(1,10).*5; % Generate test data plot(x,y,‘o’) % Plot and mark the original data points p=polyfit(x,y,2) p = 1×3 -0.7630 8.5343 25.9050 xi=1:0.5:10; yi=polyval(p,xi); % Calculate the fitting result hold onplot(xi,yi); % Draw the fitting result graph hold off clear x = linspace(0,4*pi,10)'; y = sin(x); p = polyfit(x,y,7); x1 = linspace(0,4*pi); y1 … Read more