MATLAB Plotting Secrets: Enhance Your Data Visualization

MATLAB Plotting Secrets: Enhance Your Data Visualization

Today, let’s discuss how to create beautiful charts using MATLAB. Attractive charts not only make your papers more eye-catching but also make data analysis more intuitive. I have compiled several practical tips to ensure that you can create impressive charts after learning. Color Matching Matters To make charts visually appealing, color matching is key. The … Read more

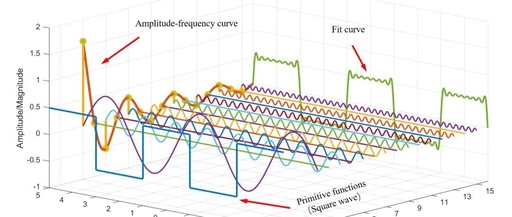
MATLAB Plotting Techniques | 3D Line Plot (With Code)

MATLAB Plotting Techniques | 3D Line Plot (With Code)

3D data visualization provides learners with intuitive images and is widely used. The previous post mainly introduced 3D surface plotting, involving functions such as meshgrid, mesh, meshc, surf, surfl, and surfc. The 3D line plot aims to showcase the curve distribution in three-dimensional space and uses the MATLAB function plot3. The difference from the 2D … Read more