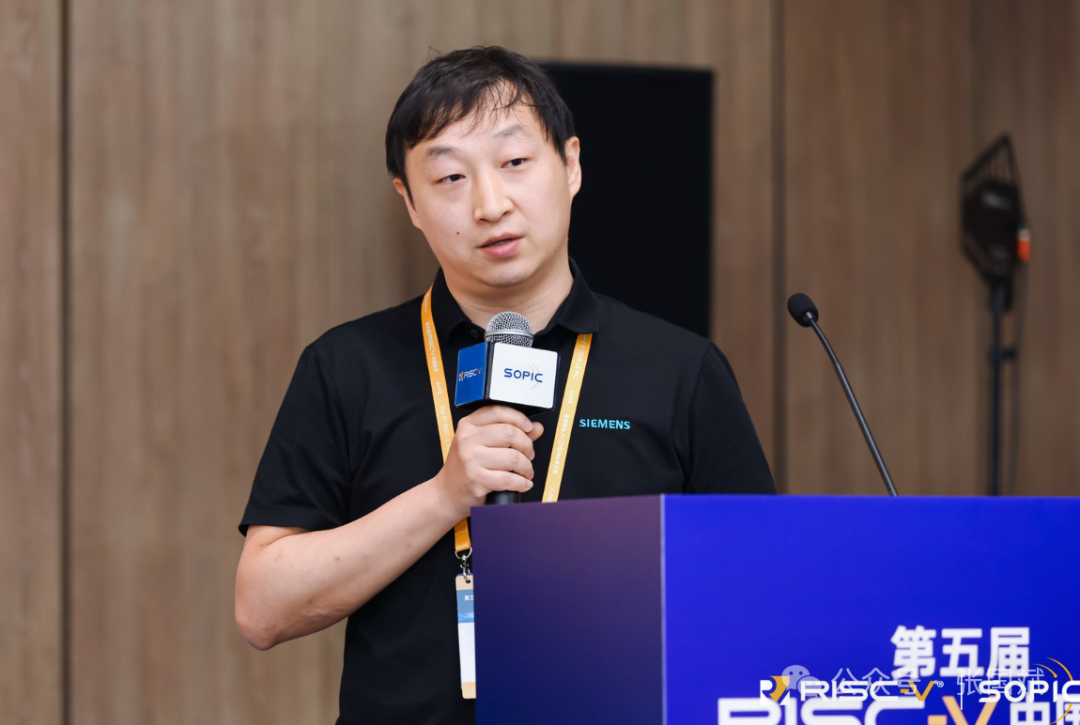
In the wave of rapid expansion of RISC-V, SoC design is becoming increasingly complex, and the debugging phase faces unprecedented challenges. Accurately reproducing hidden bugs, quickly analyzing system bottlenecks, and ensuring the correctness of custom logic have become key to the maturity of the RISC-V ecosystem. At the 2025 RISC-V China Summit, Siemens EDA Customer Technical Manager Li Yifan introduced the latest launch from Siemens EDA, Tessent UltraSight-V, which has emerged in this context to provide embedded system developers with a future-oriented debugging and tracing solution.
01 The Debugging Dilemma Approaches: The “Black Box Crisis” of RISC-V SoCs
“Debugging is becoming increasingly expensive and difficult.” — This was Li Yifan’s first summary at the start of his speech. This is not an exaggeration. As the integration of RISC-V SoCs significantly increases, the interaction between software and hardware becomes increasingly complex. The focus of debugging is no longer just simple issues at the single-core register level, but rather system-level observation and analysis across multiple cores, modules, and even Chiplets:
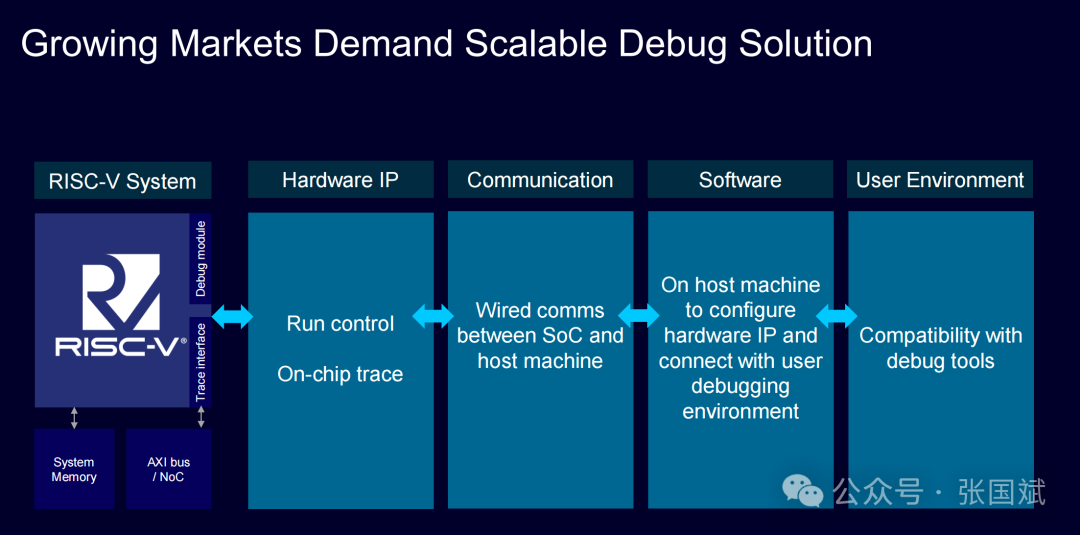
Multi-core system states cannot be consistently observed;
Heisenbugs (observing changes behavior) and Anomaly Bugs are difficult to reproduce;
Silent Data Corruption cannot be perceived at all.
In this increasingly severe trend of “black boxing,” building a debugging and tracing system with stronger observability, higher compressibility, and lighter integration has become key to the design of the next generation of debugging architectures.
02 Three Key Modules: Building a Complete On-Chip Debugging Subsystem
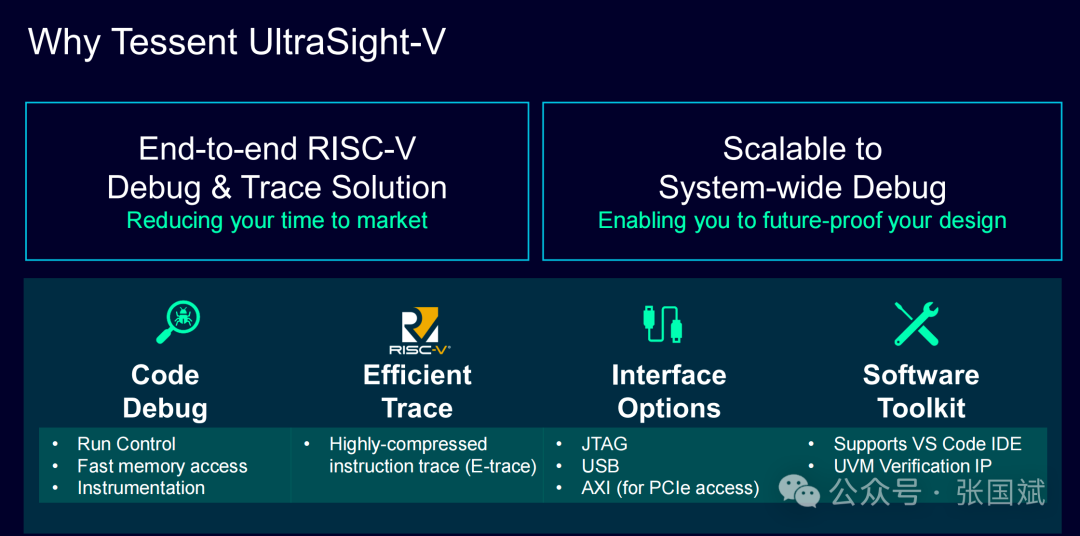
In response to the debugging characteristics of RISC-V SoCs, UltraSight-V constructs a triad on-chip debugging platform with a modular architecture approach: “Hardware Debug Control + Trace Tracing + Host Communication Interface”:
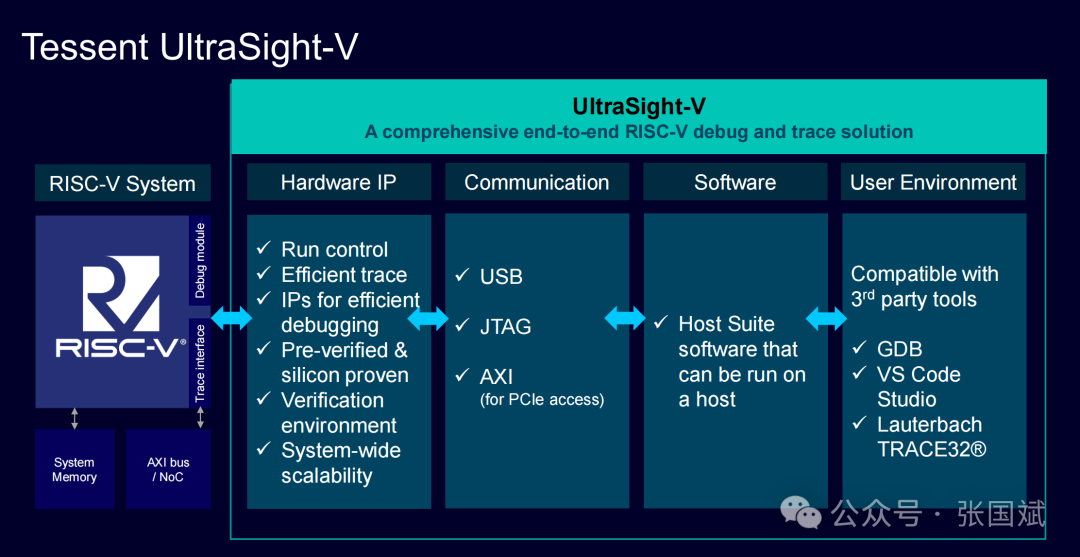
Control Module: Supports multi-core pause, resume, and breakpoint control;
Trace Data Path: Real-time capture of processor states and bus behaviors, compressible and filterable;
Host Communication Interface: Interacts with debugging host computers via USB, PCIe, etc., and supports mainstream IDEs and debugging tools (such as GDB, VS Code).
Additionally, this solution is highly compatible with third-party IPs, allowing for quick integration into various SoC platforms, significantly lowering the integration threshold for developers.
03 Scalable, Compressible, and Integrable: The Three Core Advantages of UltraSight-V
01|Extreme Compression Rate, Trace Bandwidth Savings of Up to 40%
UltraSight-V’s Trace data employs an advanced configurable compression mechanism. A set of data presented by Li Yifan shows that with the extended compression option enabled, the average bits per instruction (BPI) decreased by 40%, allowing for longer behavior tracking under the same bandwidth and storage conditions, significantly enhancing debugging coverage.
02|Supports RISC-V Custom Instruction Extensions
RISC-V emphasizes flexibility, with custom instructions frequently appearing. However, this has become a “blind spot” for traditional debugging solutions. UltraSight-V provides an extensible debugging library mechanism, allowing users to extend debugging logic through APIs and analyze the behavior of RISC-V custom instructions, truly achieving “white-box” observation of user-customized CPU architectures.
03|Support for Multi-Core/Thread/Chip Tracking, Tracing Distributed System Bugs
UltraSight-V not only supports single-core debugging but also possesses complete multi-CPU collaborative tracking capabilities, enabling visual analysis of call stacks and synchronization points in multi-threaded applications, helping developers discover complex race conditions and inter-core synchronization issues. Additionally, the system has expanded to support Multi-Die system debugging, connecting multiple SoC subsystems for unified monitoring, meeting debugging needs under Chiplet architectures.
04 Full Process Toolchain Support: From Code Debugging to System Analysis
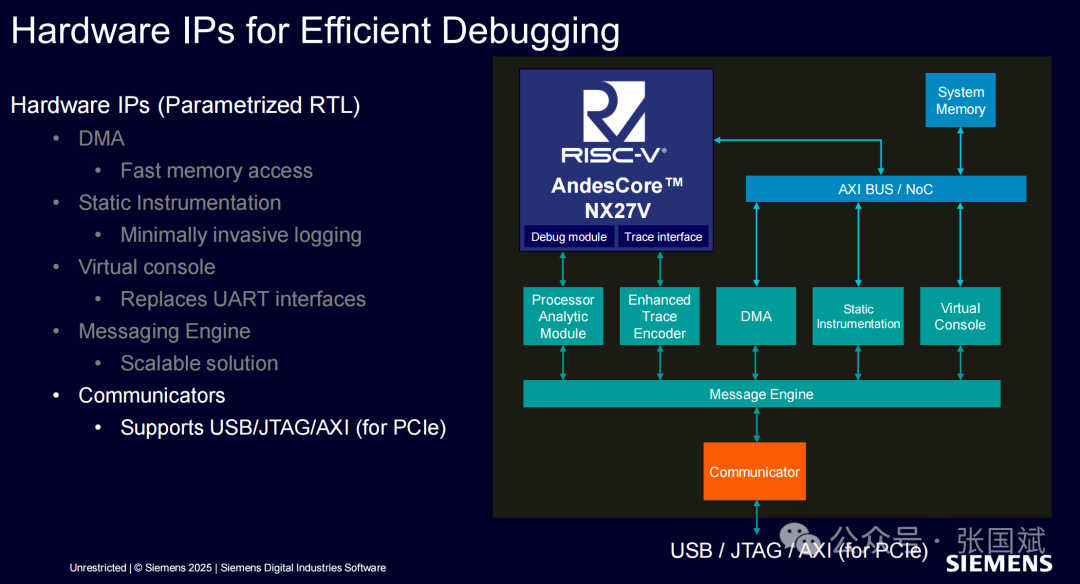
Siemens EDA does not only provide hardware IP but has built a complete end-to-end debugging chain:
Hardware Level: Tessent debugging IP (including PAM, E-Trace, DMA, etc.) forms the main data capture path;
Verification Level: Provides UVM VIP and interface verification tools to ensure seamless connection between debugging modules and SoCs;
Software Level: Supports standard debugging tools (GDB, VS Code), supports RISC-V extension parsing, and performance analysis plugins;
Data Analysis Level: Host Suite can collect debugging information, visualize, reconstruct logs, and trace errors.
It is worth mentioning that debugging information can be delivered in real-time to the development host, allowing developers to dynamically debug code with minimal interruption to system operation, significantly improving development efficiency.
From a micro perspective, UltraSight-V can help developers quickly locate bugs, optimize code, and validate functionality; from a macro perspective, Tessent UltraSight-V constructs an ecosystem aimed at system-level debugging:
Phase One: Code-Level Debug, supporting basic software debugging;
Phase Two: SoC-Level Debug, supporting on-chip multi-core/heterogeneous system debugging;
Phase Three: System-Level Debug, supporting Chiplet and Multi-Die system debugging;
Phase Four: Cross-System Debug, targeting joint debugging of multi-module systems in automotive, cloud, and industrial systems.
Siemens EDA is not only a provider of debugging IP but is also becoming a provider of infrastructure for the observability of complex systems.
Conclusion: Let Professional Tools Do Professional Work
As Li Yifan stated in his speech: “Let professionals and professional companies do professional things.” In the era of RISC-V moving towards highly complex systems, relying solely on SoC manufacturers to “self-develop debugging chains” is no longer sustainable. With platform-based debugging solutions like Siemens EDA Tessent UltraSight-V that combine software and hardware and offer flexible expansion, RISC-V SoC developers will significantly enhance debugging efficiency, accelerate product iteration, and truly shorten verification cycles.
This is not only about solving bugs but also about reconstructing the key path to system reliability.
Recommended Articles
1、Another semiconductor giant in Shanghai is about to “fall”? Huawei and BYD have invested in it
2、Why did Huada Jiutian terminate the acquisition of Chip and Semiconductor?
3、Starting from Plato’s Allegory of the Cave, how does Honor Magic V5 reconstruct the narrative of technology and humanities in the AI era?
4、History! Global Leader! The unmanned mining truck based on the Dapeng Liyang TerraSight chip successfully demonstrated
5、How should Chinese EDA break through?
6、Breaking news! Unisoc is about to go public!
7、Who is the real competitor of Hongmeng Smart Travel?
8、Foldable phones have reached their limit; it’s time to focus on enhancing user experience
9、Breaking the monopoly of ADI and TI! The first internationally leading, Chengdu Huami releases a new generation of high-speed, high-precision RF direct sampling ADC!
10、In response to the US’s supply cut of EDA and IP, the “Enlightenment” system released by the Chinese Academy of Sciences has shocked American netizens, saying “another market is lost!”
11、Taiwan Province of China has surprisingly listed Huawei and SMIC on the export control list!
12、Smart glasses are selling like hotcakes! Revealing the smart glasses industry chain!
13、Foreign media: Ren Zhengfei said that with open-source and chip packaging technology, China can cope with US technology restrictions