Click the “Battery Technology TOP+” in the upper left corner to follow!
 Electrochemical Impedance Spectroscopy (EIS) has attracted much attention as a powerful tool for monitoring batteries. The Equivalent Circuit Model (ECM) and the Distribution of Relaxation Times (DRT) method are widely used tools in EIS research.However, EIS faces uncertainties in practical applications within the lithium-ion battery field,as many different physicochemical processes or different steps of a complex process often exhibit similar spectral characteristics in EIS;on the other hand, the EIS spectral characteristics of different physicochemical processes or different steps of a complex process may overlap, leading to difficulties in interpreting the relevant impedance spectra. Therefore, the DRT method is needed to detect each process that generates impedance spectra during the characterization of lithium batteries. The DRT method can directly determine the number of time constants and the approximate frequency range, thereby reducing analytical uncertainty.Different research groups have developed various codes to calculate the DRT spectra of EIS data.Among them, DRTtools is well-known for studying the impact of discretization methods on DRT. This article uses this method for DRT fitting. By comparing the DRT spectra obtained from fitting the impedance of the same lithium battery sample under different experimental conditions (such as high temperature, overcharging, etc.), we analyze the height of the DRT characteristic peaks to determine the impact of different experimental processes on lithium batteries.1 Experimental Section1.1 Reagents and InstrumentsThe first group of batteries (lithium iron phosphate battery): the corresponding positive electrode is lithium iron phosphate material, and the corresponding negative electrode is graphite; the graphite electrode is cut into a rectangle with an effective area of 20cm2 (4cmX5cm), and the size of the lithium iron phosphate material is 24.75cm2 (4.5cmX5.5cm);The second group of batteries (high nickel battery): the corresponding positive electrode is high nickel material, and the negative electrode is silicon-carbon graphite; the negative electrode is cut into a rectangle with an effective area of 20cm2 (4cmX5cm), and the size of the high nickel material is 24.75cm2 (4.5cmX5.5cm);All the above electrodes were vacuum dried at 60°C for 4 hours before use. The electrolyte composition and ratio are EC:EMC:DEC=30:50:20, with an additive of VC=0.5%; LiPF6=1mol/L.The lithium plating conditions for the three-electrode system are charging the positive electrode against copper wire for 4 hours with a current of 30uA for lithium plating.The 1470E potentiostat and 1455A frequency response analyzer controlled by CorrWare and Zplot software were used for EIS measurements. At 50% SOC, EIS was measured in the frequency range of 100kHz~0.01Hz with a voltage perturbation of 5mV.ZView software was used to fit the obtained EIS data. All impedance tests were conducted at room temperature (25±2°C). DRT fitting analysis was performed using Matlab R2020a software, with the software package being DRTtools8, and the fitting parameters for DRT were regularization parameterλ=0.1, full width at half maximum (FWHM)=0.5.1.2 Battery AssemblyBoth groups of batteries were assembled in a glove box.The first group of batteries (lithium iron phosphate battery): a single-layer stacking method was used, assembling the graphite negative electrode, lithium iron phosphate positive electrode, and separator (PE-based film) into a single-layer stacked three-electrode system, with the copper wire tab welded to the nickel tab. Subsequently, they were dried under vacuum at 60°C for 4 hours, followed by injecting 2 mL of electrolyte and sealing under vacuum to obtain a lithium iron phosphate/graphite three-electrode with a rated capacity of 50mAh.The second group of batteries (high nickel battery): a single-layer stacking method was used, assembling the silicon-carbon negative electrode, high nickel positive electrode, and separator (PE-based film) into a single-layer stacked three-electrode system, with the copper wire tab welded to the nickel tab. Subsequently, they were dried under vacuum at 60°C for 4 hours, followed by injecting 2mL of electrolyte and sealing under vacuum to obtain a high nickel/silicon-carbon three-electrode with a rated capacity of 83mAh.2 Results and Discussion2.1 Correspondence Between DRT Peaks and Polarization ProcessesAcross the entire wide frequency range, the typical EIS spectral characteristics are mainly composed of four parts:(1) High-frequency region, related to the diffusion and migration of lithium ions through the SEI (Solid Electrolyte Interface) film on the surface of active material particles, represented by the semicircle Rf;(2) Mid-high frequency region, related to the transport of electrons within the active material particles, represented by the semicircle Re;(3) Mid-frequency region, related to the charge transfer process, represented by the semicircle Rct;(4) Low-frequency region, related to the solid diffusion process of lithium ions within the active material particles, represented by a sloping line W0.The DRT method is a powerful tool for distinguishing these polarization processes, and the EIS of lithium-ion batteries can be expressed as:
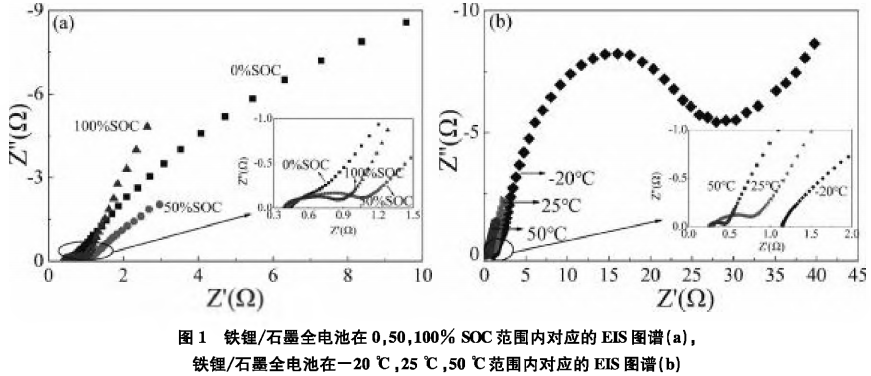
 In the above equation:γ represents the distribution of polarization losses, R0 is the ohmic resistance,and γ (ln τ) function describes the time relaxation characteristics of the studied electrochemical system.To determine the correspondence between DRT peaks and impedance, in situ impedance tests were conducted at different SOCs during the charging process of the full battery at room temperature, as well as half-state impedance tests of the full battery at different temperatures. Figure 1(a) shows the EIS data of the lithium iron phosphate/graphite full battery tested at different SOCs at room temperature, while Figure 1(b) displays the EIS data of the lithium iron phosphate/graphite full battery tested at 50% SOC at different temperatures.
 The corresponding DRT analysis is shown in Figure 2. Figure 2(a) plots the DRT spectra of the lithium iron phosphate/graphite full battery at 0%, 50%, and 100% SOC conditions, while Figure 2(b) plots the corresponding DRT spectra of the lithium iron phosphate/graphite full battery at 50% SOC at -20°C, 25°C, and 50°C.There are four regions in the DRT spectra, labeled S1—S4, which can be clearly identified, with each region corresponding to an independent polarization process.
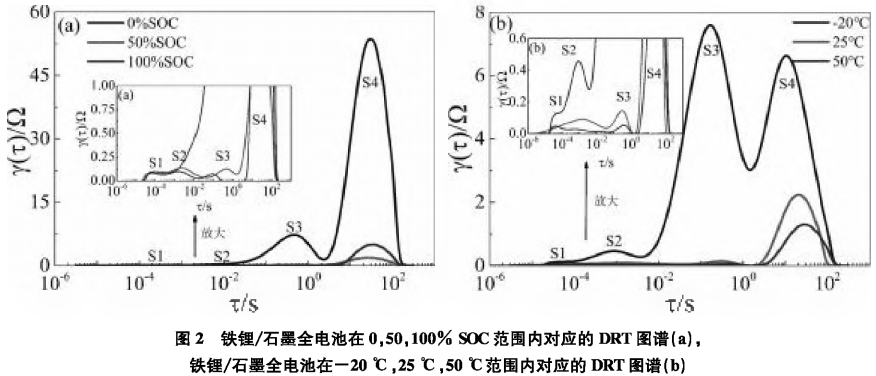 From Figure 2(a), it can be seen that the S1 and S2 regions are basically unrelated to SOC, while the S3 and S4 regions are highly correlated with SOC, thus S3 and S4 regions can be attributed to interface reactions and diffusion-related impedances, respectively. Subsequently, DRT analysis of the S1 and S2 regions at 50% SOC at -20°C, 25°C, and 50°C was conducted. As shown in Figure 2(b), the S1, S2, and S3 regions are all temperature-dependent, and as the temperature decreases, the polarization resistance significantly increases. Compared to the S2 region, the S1 region is less sensitive to temperature, thus the S1 region is attributed to ohmic resistance. From Figure 2(a), it can be seen that the S2 region has a smaller correlation with SOC, while S3 is significantly correlated with SOC. Considering these differences, the S2 region is attributed to the impedance Rf of Li+ passing through the SEI film, while S3 is attributed to the charge transfer impedance Rct.2.2 The Impact of High-Temperature SEI Film Growth on ImpedanceAnalysis of the impedance changes of lithium-ion batteries under high-temperature charging and discharging conditions.Figure 3(a) shows the EIS data of the lithium iron phosphate/graphite three-electrode system after high-temperature testing, with the corresponding DRT analysis shown in Figure 4.Figure 4 plots the DRT spectra of the lithium iron phosphate/graphite battery three-electrode system after formation and after high-temperature charging and discharging, tested at 25°C for the full battery (a), positive reference (b), and negative reference (c).
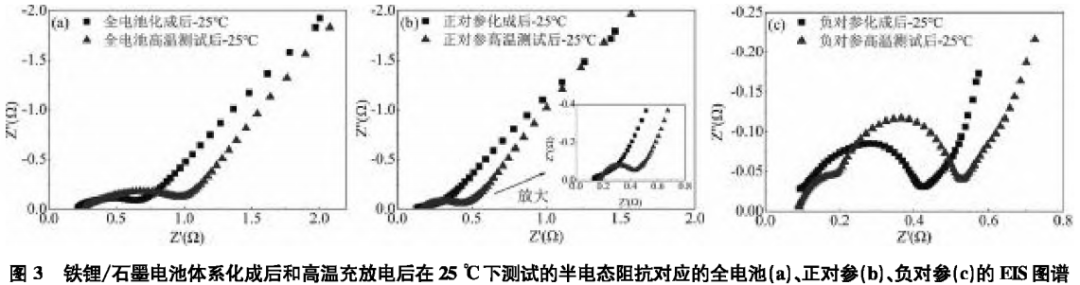 After high-temperature charging and discharging, the differences in the DRT curves of the full battery, positive reference, and negative reference are mainly reflected in the S2 and S4 regions, where the corresponding peak heights increase, areas enlarge, and peak positions shift, indicating that the impedance of the SEI film increases after high-temperature charging and discharging, leading to increased impedance; additionally, diffusion resistance also increases, making the solid diffusion process more difficult; the S1 and S3 regions show little change, indicating that the Rct impedance changes little after high-temperature charging and discharging. This is consistent with the EIS spectra shown in Figure 3.
The above results indicate that high temperatures may cause the SEI films on the positive and negative electrodes of the battery to thicken, leading to an increase in SEI film impedance; additionally, the material structure of the battery may be damaged after high-temperature charging and discharging, slowing down the diffusion process of lithium ions within the active particles.
2.3 The Impact of Overcharging on the Structure of Positive Electrode at Room Temperature
Figure 5 shows the EIS spectra of the high nickel/silicon-carbon battery system after formation and after overcharging, tested at 25°C for the full battery (a), positive reference (b), and negative reference (c). The corresponding DRT spectra are shown in Figure 6.
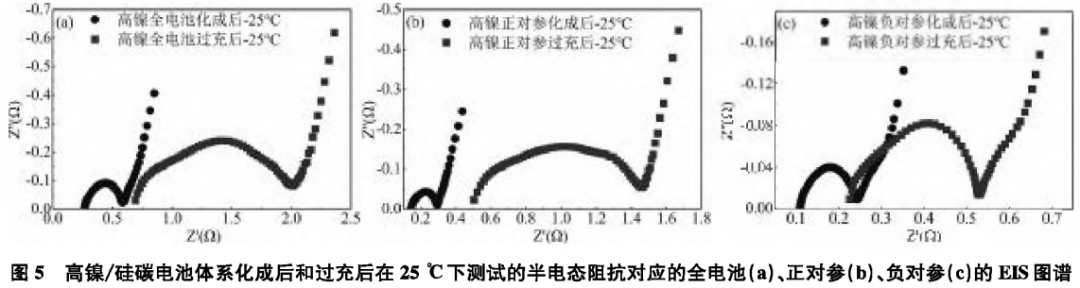
As shown in Figures 6(a) and (b), after overcharging, the DRT of the full battery and positive electrode splits into two peaks in the S2 region. That is, after overcharging, the S2 region splits from the original SEI film impedance into SEI film impedance Rf and electronic conductivity impedance Re, indicating that the transport process of electrons in the active material particles of the positive electrode becomes difficult after overcharging; in addition, the S1 and S4 regions of the full battery and positive electrode also show an increase in DRT peaks, indicating that the ohmic resistance and diffusion resistance of the full battery and positive electrode increase after overcharging, suggesting that the active material particles may have fractures, leading to difficulties in the transport of electrons between active material particles and the transport of lithium ions in the electrolyte between active material particle voids, corresponding to the increase in ohmic resistance; additionally, the material structure may be damaged after overcharging, causing the solid diffusion of lithium ions within the active material particles to slow down, corresponding to the increase in diffusion resistance. The above results correspond to the increase in total impedance values shown in the impedance spectra in Figure 5.
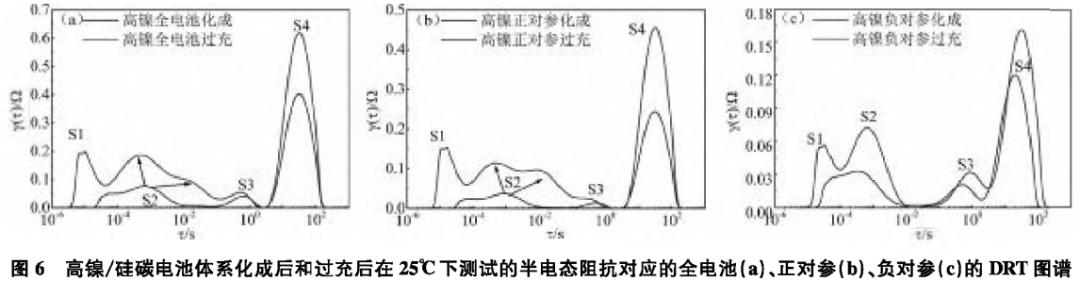
As shown in Figure 6(c), after overcharging, all four regions S1—S4 of the negative electrode show significant changes. The DRT spectra corresponding to regions S1—S4 all show increases. This indicates that the ohmic resistance, SEI film impedance, charge transfer impedance, and diffusion resistance of the negative electrode all increase after overcharging. It suggests that after overcharging, there are significant obstacles to the transport of electrons or lithium ions between the active particles, on the surfaces of active particles, within the active particles, and during the charge transfer process, which may correspond to the expansion or fracture of silicon-carbon active particles, as well as the thickening of the surface SEI film, consistent with the increase in total resistance values shown in the impedance spectra in Figure 5.3 ConclusionUsing soft-pack three-electrode batteries, the DRT method was employed to study the impedance of single side reactions. First, the correspondence between each region of the DRT map and impedance was established, allowing for the regional study of the polarization effects of side reactions. Simultaneously, through the initiation of side reactions during high-temperature charging and discharging, it was determined that high temperatures may cause the SEI films on the positive and negative electrodes of the battery to thicken, leading to an increase in SEI film impedance; additionally, the material structure of the battery may be damaged after high-temperature charging and discharging, slowing down the diffusion process of lithium ions within the active particles. Finally, through the initiation of single side reactions, it was determined that after overcharging, the transport process of electrons in the active material particles of the positive electrode becomes difficult, and the active material particles of the positive electrode may fracture, leading to slow transport and solid diffusion of lithium ions between and within the active material particles. After overcharging, the silicon-carbon active particles of the negative electrode may expand or fracture, and the thickening of the surface SEI film leads to significant obstacles to the transport of electrons or lithium ions between the active particles, on the surfaces of active particles, within the active particles, and during the charge transfer process.References: Li Lijuan, Zhu Zhendong, Li Yi, Xia Yujia, Peng Wen. The Impact of Single Side Reactions on the Impedance of Lithium Batteries [J]. Battery Industry, 2023, 27(1): 11-15Follow the public account“Battery Technology TOP+”for more information Related Articles:Comprehensive Overview! A Complete Guide to Lithium/Sodium Battery Materials!PPT| New Technologies in Lithium Batteries: Fast Charging Technology!PPT| New Technologies in Lithium Iron Manganese Phosphate (LMFP) Batteries!PPT| Lithium Battery Technology Overview: Artificial Graphite, Silicon Anodes!PPT| Lithium Battery Overview: New Technologies in Composite Collectors!PPT| Analysis of Abnormal Thickness in Square Aluminum Shell Batteries!PPT| In-depth Analysis of CATL’s Industry Chain and Technology!PPT| Comprehensive Guide to Electrolyte Solvents, Lithium Salts, and Additives!PPT| Summary of Ternary Cathode Technologies! Finally Complete!PPT| New Technologies in Composite Collectors: PET Copper Foil!PPT| In-depth Analysis of Lithium Battery Separators!PPT| Analysis of Conductive Agents in Lithium Batteries!PPT| Analysis of Binders in Lithium Batteries!PPT| In-depth Analysis Report on Vanadium Battery Technology!PPT| Comprehensive Overview of the Latest Sodium Battery Technologies!PPT| CATL, Stars and the Sea!PPT| Silicon-based Anodes, an Inevitable Path for Lithium Battery Upgrades