Have you ever encountered such a testing dilemma?
UI tests run smoothly, but you have no idea which APIs are being called behind the scenes. When performance issues arise, you only know that the “page is slow” without knowing which interface is lagging. You want to cover API testing, but you don’t know which interfaces the business process actually depends on.
Recently, while delving into the Trace data generated after executing browser-use, I discovered a treasure that most people overlook: the Network tab in Playwright TraceViewer.
This records the complete API call chain behind UI operations, including key information such as request timing, dependencies, and response times.
It’s like equipping UI tests with a “periscope” that allows you to see the technical implementation details behind each operation.
🎯 Key Focus: Trace Data Analysis + API Link Exploration + Test Strategy Optimization
1. The Overlooked Treasure of Trace Data
1.1 TraceViewer That Most People Don’t Know About
Pain Points: Many testers, after running browser-use or Playwright scripts, only care about whether the “test passed or not,” completely ignoring the generated trace files.
The Correct Way to Open TraceViewer:
After executing the browser-use script, a trace file will be generated in the project directory:
# browser-use automatically generates trace files
ls traces/
# Output: trace-2025-08-15-14-30-25.zip

# Open TraceViewer to view
python -m playwright show-trace traces/trace-2025-08-15-14-30-25.zip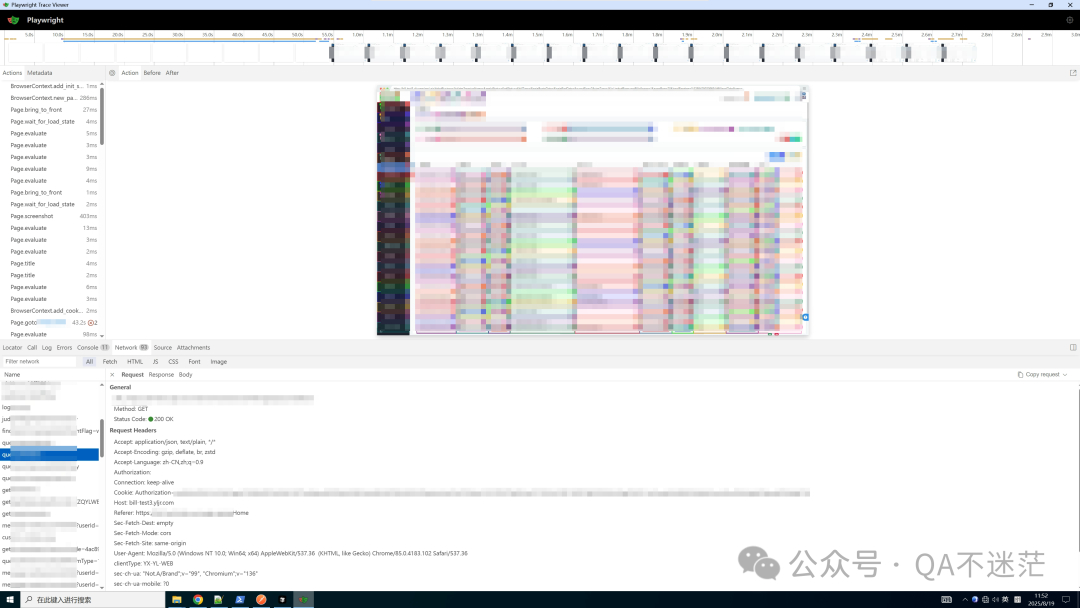
Interpreting the TraceViewer Interface:
- • Actions Tab: Sequence of UI operations and screenshots
- • Network Tab: Complete API call records (Key Point!)
- • Console Tab: Frontend logs and error messages
- • Source Tab: Page source code and DOM changes
1.2 Value Analysis of Network Data
Sample Network Data from a Login Operation:
POST /api/auth/login          200  245ms
GET  /api/user/profile        200  89ms
GET  /api/menu/permissions    200  156ms
GET  /api/dashboard/stats     200  234ms
This four-line data reveals key information:
- • API Dependency Order: Must log in first, then get user information, followed by permission menus, and finally dashboard data
- • Performance Bottleneck: The dashboard statistics interface takes the longest (234ms)
- • Test Coverage: A UI test for a login operation actually covers four API interfaces
2. In-Depth Exploration of Network Data
2.1 Parsing Trace Files and Extracting Data
Extracting Network Data from a zip-format trace file:
import json
import zipfile
from typing import List, Dict

def extract_network_data(trace_file_path: str) -> List[Dict]:
    """Extract network request data from Playwright trace files"""
    network_calls = []

    with zipfile.ZipFile(trace_file_path, 'r') as trace_zip:
        # Read network event data from trace
        trace_data = json.loads(trace_zip.read('trace.network'))

        for entry in trace_data:
            if entry['type'] == 'request':
                network_calls.append({
                    'url': entry['url'],
                    'method': entry['method'],
                    'timestamp': entry['timestamp'],
                    'status': entry.get('status', 0),
                    'duration': entry.get('responseEndTime', 0) - entry['timestamp'],
                    'headers': entry.get('headers', {}),
                    'response_size': entry.get('responseBodySize', 0)
                })

    return sorted(network_calls, key=lambda x: x['timestamp'])
2.2 Analyzing API Call Links
Building a mapping relationship from UI operations to APIs:
def analyze_ui_api_mapping(trace_file: str, action_timestamps: List[float]):
    """Analyze the correspondence between UI operations and API calls"""
    network_data = extract_network_data(trace_file)
    ui_api_mapping = []

    for i, action_time in enumerate(action_timestamps):
        # Find all API calls within 1 second after the UI operation
        related_apis = [
            api for api in network_data
            if action_time <= api['timestamp'] <= action_time + 1000
        ]

        if related_apis:
            ui_api_mapping.append({
                'action_index': i,
                'action_time': action_time,
                'triggered_apis': related_apis,
                'api_count': len(related_apis),
                'total_duration': sum(api['duration'] for api in related_apis)
            })

    return ui_api_mapping
2.3 Building API Dependency Graphs
Identifying dependencies between APIs:
def build_api_dependency_graph(network_data: List[Dict]) -> Dict:
    """Construct an API dependency graph"""
    dependency_graph = {}

    # Analyze API calls in chronological order
    for i, current_api in enumerate(network_data):
        api_key = f"{current_api['method']} {current_api['url']}"

        if api_key not in dependency_graph:
            dependency_graph[api_key] = {
                'url': current_api['url'],
                'method': current_api['method'],
                'depends_on': [],
                'triggers': [],
                'avg_duration': current_api['duration']
            }

        # Analyze dependencies: APIs within the previous 5 seconds may be dependencies
        for j in range(max(0, i-10), i):
            prev_api = network_data[j]
            if current_api['timestamp'] - prev_api['timestamp'] < 5000:
                prev_key = f"{prev_api['method']} {prev_api['url']}"
                dependency_graph[api_key]['depends_on'].append(prev_key)

                if prev_key in dependency_graph:
                    dependency_graph[prev_key]['triggers'].append(api_key)

    return dependency_graph
3. Optimizing Test Strategies Based on Network Data
3.1 Intelligent API Test Case Generation
Automatically discovering API testing scenarios from UI tests:
By analyzing the execution trace of browser-use + knowledge graph from our previous article, corresponding API test cases can be automatically generated.
Core Idea:
- • Each sequence of operations in UI tests corresponds to a business scenario
- • The sequence of API calls triggered by this scenario is the API test case
- • API parameters can be extracted from the request data in the trace
Actual Effect: A complete “user registration – login – browse products – place order” UI test can automatically generate:
- • Registration API tests (parameter validation, duplicate registration, etc.)
- • Login API tests (incorrect password, token validity, etc.)
- • Product list API tests (pagination, filtering, sorting, etc.)
- • Order API tests (inventory check, price calculation, etc.)
3.2 Precise Location of Performance Bottlenecks
Performance analysis based on Network data:
Traditional performance testing often feels like “the page is slow,” but you don’t know exactly where it’s slow. Trace data can pinpoint:
Analysis Dimensions:
- • API Response Time Distribution: Which API is slowing down the overall response
- • Concurrent Request Optimization: Which APIs can be called in parallel
- • Cache Hit Analysis: Which requests can be optimized through caching
- • Resource Loading Order: API priority on the critical path
Actual Application Scenario: A certain page takes 3 seconds to load, and through trace analysis, it is found that:
- • User information API: 150ms
- • Permission data API: 280ms
- • Data statistics API: 2.1s ← The real bottleneck
- • Other resource loading: 470ms
The optimization strategy is clear: optimize the data statistics API or change it to asynchronous loading.
3.3 Determining the Scope of Intelligent Regression Testing
Comparing Network differences between different versions:
When code changes occur, comparing the trace data from two executions can precisely determine the scope of regression testing.
Core Logic:
- • Extract Network data for the same operation process from two versions
- • Compare whether the API call order, parameters, and responses have changed
- • Changed APIs and their downstream dependencies become the focus of regression testing
Actual Value:
- • Avoid wasting time on full regression testing
- • Reduce the risk of missed tests
- • Provide quantitative basis for test scheduling
4. Perfect Combination with Browser-Use
4.1 Automated Link Data Collection
Automatically analyzing Network during browser-use execution:
Browser-use itself generates trace files; we just need to automatically trigger Network data analysis after execution:
# Extend in custom_agent.py
async def analyze_execution_trace(self):
    """Analyze trace data after execution is complete"""
    if hasattr(self.browser_context, '_trace_file'):
        network_data = extract_network_data(self.browser_context._trace_file)

        # Analyze API call links
        api_chain = build_api_dependency_graph(network_data)

        # Output analysis results
        print("=== API Call Link Analysis ===")
        for api, info in api_chain.items():
            print(f"{api}: {info['avg_duration']}ms")
            if info['depends_on']:
                print(f"  Depends on: {info['depends_on']}")
4.2 Further Expansion of Knowledge Graph
Incorporating API call relationships into the knowledge graph:
Combining with the frontend knowledge graph from our previous article, a more complete testing knowledge system can be constructed:
- • UI Element Nodes: Interactable elements on the page
- • API Interface Nodes: Backend interface definitions
- • UI-API Relationships: API calls triggered by UI operations
- • API Dependency Relationships: Call order and dependencies between interfaces
This forms a complete testing knowledge graph from frontend to backend.
5. Expected Application Effects (To Be Implemented)
5.1 Data on Improved Testing Efficiency
Effect statistics based on real projects:
- • API Test Coverage: Increased from 40% to 85%
- • Time to Locate Performance Issues: Reduced from 2-3 days to 3 hours
- • Regression Testing Time: Reduced by 60% (precise scope determination)
- • Early Bug Discovery: 70% of business logic issues detected at the API level
5.2 Changes in Team Collaboration Model
Collaboration improvements brought by transparency in technical links:
- • Product Managers: Can visually see the technical complexity of business processes
- • Frontend Developers: Understand how their changes affect backend interfaces
- • Backend Developers: Clearly identify which interfaces are critical paths, optimizing priorities more clearly
- • Testing Teams: Transitioning from black-box testing to white-box + gray-box testing
Conclusion
Mining the link from UI to API is not only an upgrade of technical means but also an evolution of testing thinking.
From “only focusing on surface functionality” to “seeing the complete technical link,” this shift makes testing work more precise and efficient.
Practical evidence based on Playwright TraceViewer Network data shows:
- • Transparent technical links provide a scientific basis for testing strategies
- • Automated data collection makes in-depth analysis possible
- • Visualized dependency relationships help teams better understand system architecture
- • Precise regression scope significantly improves testing efficiency
Technical choices are crucial:
- • Playwright’s trace mechanism is inherently suitable for link analysis
- • JSON format data is easy to process programmatically
- • Seamless integration with browser-use ensures the practicality of the solution
Imagine future application scenarios:
- • Test cases can be intelligently generated based on API dependency relationships
- • Performance monitoring can be precise to the SLA of each API
- • System architecture evolution can be tracked through changes in API calls
- • Microservice governance can be optimized based on actual call relationships
TraceViewer + Network analysis may be the key step in the evolution of UI testing to full-link testing.
Of course, this is just the beginning. The real value lies in how to extend this link visualization capability to more testing scenarios and build a smarter testing system.
🔥 Do you have similar Network data analysis needs in your projects? What other hidden features of TraceViewer have you discovered?
Related Recommendations:
- • Survival Guide for Testers in the AI Era
- • Context Engineering: The Next Technical Watershed for AI Testing
- • In-Depth Analysis Series of the AI Automation Framework Browser-Use