Previously, I processed data by directly subtracting daily climatology and removing trends, but my instructor mentioned that there would still be a lot of noise after subtracting daily climatology.I rewrote a method to first calculate daily climatology and then use Fourier filtering to remove seasonal signals. However, comparing the two results, there are only slight differences, possibly because I averaged over 15 days 🤔Using the Fourier filtering method: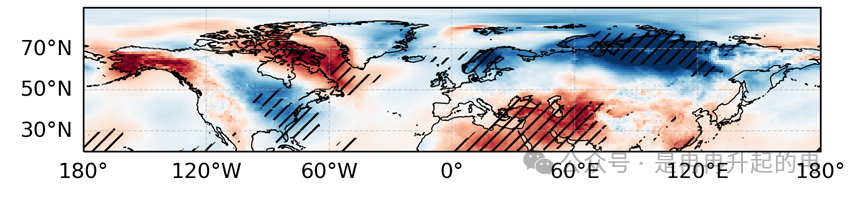 Using the direct subtraction of daily climatology method:
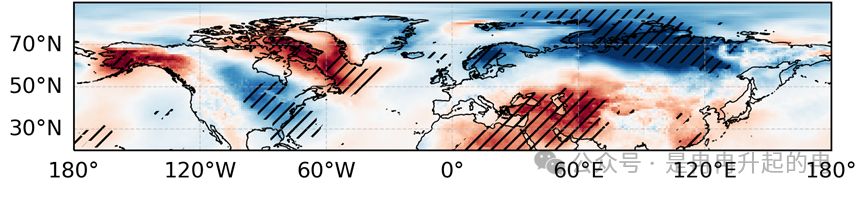
# ===============================# --- Remove Seasonality and Trends Function ---# Input data: time lat lon# ===============================def deseason_method(t2m_data, lat_start, lat_end, n_harmonics=3, poly_order=1): """ Remove seasonality and trends method (processed grid point by grid point, year by year) Parameters: - t2m_data: xarray DataArray, dims (time, lat, lon) - lat_start, lat_end: Latitude index range - n_harmonics: Number of harmonics to retain (3) - poly_order: Polynomial order (1=linear) """ print(f"\n Processing latitudes {lat_start} to {lat_end}...") # Get dimensions times = t2m_data.time.values lats = t2m_data.lat.values[lat_start:lat_end] lons = t2m_data.lon.values n_times, n_lats_chunk, n_lons = len(times), len(lats), len(lons) # Only process this latitude chunk, considering memory for data processing d_ave = t2m_data.isel(lat=slice(lat_start, lat_end)).values.copy() # Days in each month (including leap years) months = [31, 29, 31, 30, 31, 30, 31, 31, 30, 31, 30, 31] n_days_year = np.sum(months) # 366 # Get year range year_start = pd.to_datetime(times[0]).year year_end = pd.to_datetime(times[-1]).year # Process each grid point for no, i in enumerate(range(n_lats_chunk)): if (no + 1) % 1 == 0: print(f" Processing latitude {no+1}/{n_lats_chunk} ({lats[no]:.1f}°)") for j in range(n_lons): #=== Calculate the daily climatology for this grid point (366 days) === mean_surf_t = np.zeros(n_days_year) count = 0 # Extract the time series for this grid point T_ij = d_ave[:, no, j].copy() # Calculate multi-year average by month and day for mth in range(12): n_days_in_month = months[mth] for day in range(1, n_days_in_month + 1): # Select all year data for this month and day month_mask = pd.to_datetime(times).month == (mth + 1) day_mask = pd.to_datetime(times).day == day mask = month_mask & day_mask if np.any(mask): mean_surf_t[count] = np.mean(T_ij[mask]) count += 1 # === Apply Fourier filtering to the daily climatology === yf = fft(mean_surf_t) xf = fftfreq(len(mean_surf_t), 1) # Retain the first n_harmonics*2 frequencies bound = np.sort(np.abs(xf))[n_harmonics * 2] yf[np.logical_or(xf >= bound, xf <= -bound)] = 0 + 0j # Inverse transform filtered_clim = ifft(yf).real # Non-leap year climatology (remove February 29, index 60) non_leap_clim = np.concatenate([filtered_clim[:60], filtered_clim[61:]]) # === Remove seasonal cycles year by year === for year in range(year_start, year_end + 1): # Select data for this year year_mask = pd.to_datetime(times).year == year year_indices = np.where(year_mask)[0] if len(year_indices) == 0: continue # Check if it's a leap year n_days_in_year = len(year_indices) if n_days_in_year == 366: # Leap year, use 366-day climatology T_ij[year_indices] = T_ij[year_indices] - filtered_clim elif n_days_in_year == 365: # Non-leap year, use 365-day climatology T_ij[year_indices] = T_ij[year_indices] - non_leap_clim # === Apply linear detrending to the deseasoned data === X = np.arange(len(T_ij)) fit_coeffs = P.polyfit(X, T_ij, poly_order) # Calculate polynomial trend poly_trend = np.zeros(len(X)) for q in range(len(fit_coeffs)): poly_trend += fit_coeffs[q] * X**q # Remove trend d_ave[:, no, j] = T_ij - poly_trend return d_aveFourier decomposition requires a lot of space. Initially, to save some space, I only selected winter data, but later I found the detrended results were strange, so using the full year’s data seems more reasonable. Therefore, during processing, latitude can be handled in chunks. 🤔 Python has more capabilities than the NCL library, but plotting is much harder to adjust 🥲