The Industrial Internet of Things (IIoT), as an important carrier for the integration of industrial automation and information technology, is driving fundamental improvements in production efficiency and management effectiveness across multiple industries such as manufacturing, logistics, and energy. With the maturity of technologies such as sensors, embedded systems, edge computing, cloud platforms, and big data analytics, enterprises can leverage IIoT systems for comprehensive data collection and real-time monitoring of production equipment, process flows, energy consumption, and quality management. At the same time, IIoT also faces multidimensional challenges such as integration complexity, data security, interoperability, and internal organizational changes.
Analysis of IIoT Reference Architecture
In an IIoT system, different layers are responsible for different functions, and the overall architecture mainly includes data generation, data aggregation and storage, cloud/edge computing, and the final application analysis layer. Below is a detailed analysis of each layer and its key components.
Layered Architecture Model
To ensure that the system has high responsiveness, resilience, and interoperability, a layered design architecture model is recommended. This model can be illustrated with the following diagram:
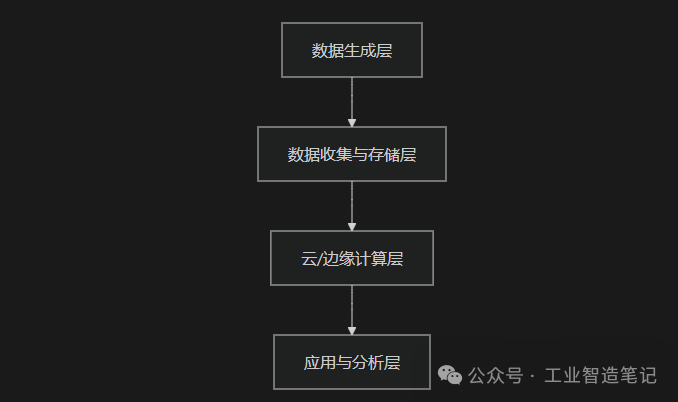
The above diagram briefly describes the entire path of data from collection, storage, processing to final business processing and decision output.
Data Generation Layer
The data generation layer is the forefront of the entire IIoT system, including all devices that collect data directly from the physical world.
Main Components
| Component | Function Description | Technical Examples |
|---|---|---|
| Sensors | Collect physical parameters such as temperature, humidity, vibration, and pressure | MEMS sensors, wireless vibration sensors |
| Actuators | Adjust device status based on control instructions | PLC controllers, smart valves |
| Edge Devices | Local data preprocessing and preliminary analysis | Embedded gateways, industrial routers |
Key Requirements
- Environmental AdaptabilityDevices must be able to operate stably in harsh environments such as high temperatures, high humidity, or dust.
- Protocol StandardsSupport common industrial protocols such as OPC UA, MQTT, Modbus, ensuring interoperability with other systems.
Note: During actual deployment, considerations must be made for device power consumption and real-time response capabilities.
Data Collection and Storage Layer
This layer is responsible for the unified aggregation, format conversion, preliminary storage, and transmission security of data from the underlying devices.
Key Technologies
| Function Module | Technical Implementation | Description |
|---|---|---|
| Data Aggregation | Kafka Edge, MQTT Broker | Batch transmission and efficient aggregation of edge data |
| Local Storage | Time-series databases (InfluxDB, TDengine) | Real-time data storage and fast querying |
| Communication Security | TLS 1.3 encryption, VPN tunnels | Ensure confidentiality and integrity of data during transmission |
Application Case
For example, in a petrochemical scenario, by deploying industrial-grade gateway devices, sensor data such as tank levels and temperatures are first stored in a local time-series database, and then uploaded to the cloud platform for further processing and decision analysis through secure encrypted transmission.
Cloud/Edge Computing Layer
The cloud/edge computing layer is the data processing and analysis hub of the entire system, differentiated into low-latency edge processing and cloud computing for large data volume analysis.
Edge Computing
Edge nodes deployed on-site perform preliminary processing of data, mainly used for:
- Real-time control and alarms: For example, immediately triggering a shutdown alarm when abnormal vibrations are detected.
- Data preprocessing: Cleaning and formatting data to reduce the amount of data uploaded to the cloud.
The following diagram illustrates the role of edge computing in the data flow:
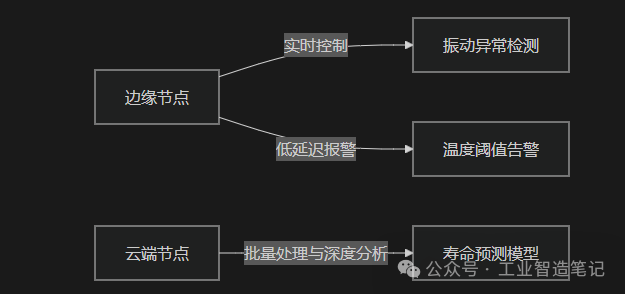
Cloud Computing
The cloud platform has powerful data processing and storage capabilities, suitable for:
- Historical data analysis: Using stored massive data for trend prediction and statistical analysis.
- Machine learning and deep analysis: Building predictive maintenance models, optimizing production processes with digital twins, etc.
Performance Comparison
| Scenario | Edge Computing Solution | Cloud Computing Solution |
|---|---|---|
| Response Time | < 100 ms | 500 ms ~ 2 s |
| Data Processing Volume | Scene interruption decision | Batch historical data analysis |
| Application Example | Emergency shutdown control | Periodic maintenance prediction and optimization |
Application and Analysis Layer
After data is processed by the cloud or edge nodes, the application layer is responsible for converting data into business decisions. It mainly includes:
- Predictive MaintenanceUsing algorithms such as LSTM networks and decision trees to predict equipment failures, reducing unplanned downtime.
- Energy Efficiency OptimizationUsing digital twin models to simulate production processes and optimize energy allocation.
- Visualization DashboardsUsing Grafana or Power BI to display real-time data and statistics to employees, supporting timely decision-making.
Data Flow Design from Sensors to Cloud
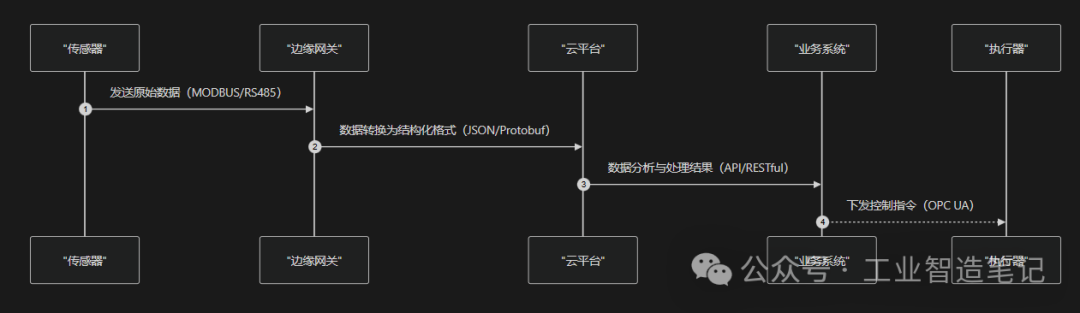
To ensure the fast and accurate transmission of data from collection to final decision-making, an end-to-end data flow system needs to be constructed. Below is a detailed explanation of the overall process and key technical indicators of data flow design.
End-to-End Data Flow Architecture
The data flow design starts with the collection of raw data from on-site sensors, processes the data through edge gateways for preprocessing and protocol conversion, then uploads it to the cloud platform for batch processing and deep analysis, and finally issues control instructions through the business system. The following diagram shows the complete data flow process:
Key Performance Indicators
During system design, the following key performance indicators must be met to ensure the efficiency and reliability of data transmission and processing:
| Indicator | Requirement | Implementation Method |
|---|---|---|
| Data Latency | < 1 second | Edge computing + TSN network |
| Data Integrity | 99.999% | CRC check + retransmission mechanism |
| System Availability | 99.95% | Using dual-active data centers and disaster recovery solutions |
| Real-time Performance | Fast response | Layered processing, real-time monitoring, and alarm systems |
Through the above design, not only is real-time data collection and transmission achieved, but it also lays the data foundation for subsequent advanced applications such as predictive maintenance and energy efficiency optimization.
Pitfall Guide: Common Integration Issues and Solutions
During the integration of IIoT systems, enterprises often encounter issues such as non-unified technical specifications, incompatible data formats, information silos, and security vulnerabilities. Below is a detailed discussion of these common problems and their solutions.
Typical Problems and Countermeasures
| Problem Type | Manifestation | Solution |
|---|---|---|
| Protocol Compatibility | Some Modbus devices cannot directly connect to OPC UA systems | Deploy protocol conversion gateways, such as using Kepware or other middleware solutions |
| Data Silos | Historical SCADA system data cannot be integrated with new data platforms | Establish a unified data bus (e.g., Apache NiFi) and use ETL tools to unify data formats |
| Security Vulnerabilities | Old PLC devices have unpatched security vulnerabilities | Implement a Zero Trust Architecture (ZTA) and micro-segmentation strategies |
| Poor Scalability | A sudden increase in the number of connected devices slows down system response | Adopt a distributed architecture, elastic load balancing, and collaborative processing between cloud and edge |
Phased Implementation Path
To reduce risks in system integration, it is recommended to advance the project according to the following phased implementation path:
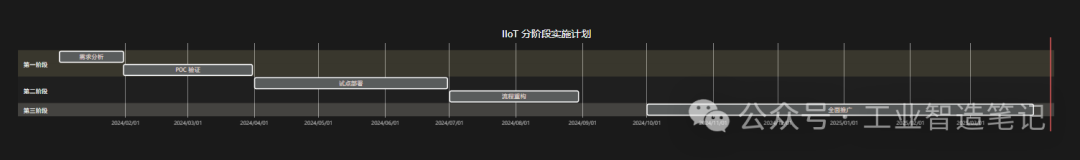
Descriptions of each phase:
-
Requirement Analysis and POC Verification
– Clarify business needs, technical specifications, and key risks.
– Use small-scale pilot projects to validate key technologies, data flows, and security strategies.
-
Pilot Deployment and Process Restructuring
– Fully deploy verification solutions in limited lines and devices, adjusting data interfaces, protocol conversions, and coordination between edge and cloud.
– Form standardized business processes and data interface specifications.
-
Full Promotion
– Under the premise of ensuring that all indicators meet requirements, expand from core production lines to the entire factory and even to external supply chain integration.
Detailed Implementation Steps (Based on Sensile’s Five-Step Method)
To ensure the successful implementation of IIoT projects, it is recommended to adopt a phased and step-by-step implementation approach in conjunction with internal processes and change management. Below are five key steps detailed:
Step 1: Define Organizational Participation Model
This phase mainly involves assessing internal capabilities and resources, clarifying responsibilities among parties.
Main Tasks:
- Resource AssessmentDevelop a RACI matrix to clarify the responsibility distribution among technical teams, operations personnel, and on-site operators.
- Process MappingDraw existing business (AS-IS) flowcharts to identify data blind spots and redundant processes in each link.
Outputs:
- RACI Matrix
- Process Mapping Document
Recommended Tools:
- ARIS or Visio for process modeling
- Jira/Confluence for task tracking and document management
Step 2: Small-Scale Pilot Verification
Conduct small-scale pilot projects to verify the feasibility of the solution and the effectiveness of data transmission and processing.
Key Activities:
- Select representative production lines (recommended to cover at least 3 types of typical equipment).
- Deploy 10-20 edge nodes and corresponding sensors.
- Compare the accuracy of system-collected data with manual records during the pilot period, verifying data loss rates, response delays, and other indicators.
Success Criteria:
- Data loss rate less than 0.1%
- Anomaly detection accuracy exceeds 95%
Step 3: Business Process Restructuring
After ensuring the success of the pilot, restructure existing business processes to adapt to the automation and data-driven decision-making model of IIoT.
Key Focus of Transformation:
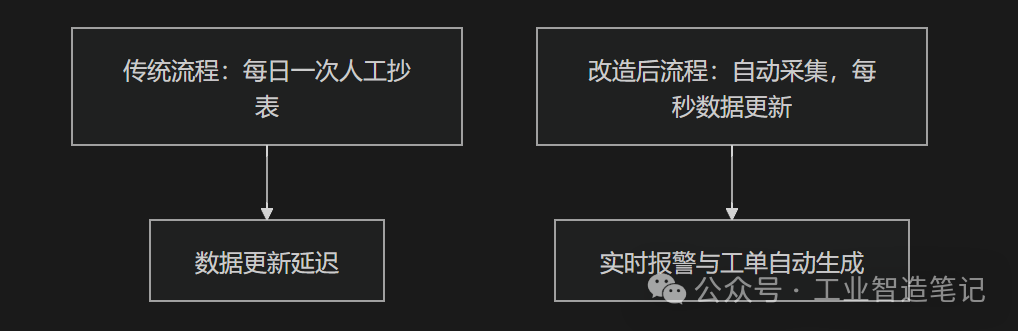
- Transition from manual meter reading and monitoring to automatic collection and real-time monitoring, improving response speed.
- Achieve automatic generation of fault alarms and maintenance work orders through real-time data linkage with the work order system.
The following diagram compares traditional processes with IIoT transformation processes:
Example KPI Settings:
- Average Repair Time (MTTR) reduced by 40%
- Energy consumption reduced by 15%
Step 4: Establish Dynamic Optimization Mechanism
With the accumulation of data and system operation, continuous optimization is an important link to enhance overall efficiency.
Main Measures:
| Optimization Dimension | Methodology | Tools and Platforms |
|---|---|---|
| Algorithm Optimization | Introduce online machine learning | TensorFlow Serving |
| Resource Scheduling | Static to dynamic resource allocation | Kubernetes + Prometheus |
| Policy Updates | Based on A/B testing mode | Apache Flink |
Through practical monitoring and continuous training of models, real-time adjustments of system parameters and control strategies can be made to ensure that the system is always in an optimal state.
Step 5: Continuous Expansion and Iteration
The construction of IIoT projects usually requires a long-term, multi-phase plan. It is recommended to develop a three-year expansion plan, gradually covering data interaction and collaborative operations from core production lines to all factory equipment and even external supply chains.
| Phase | Coverage | Key Technology Upgrades |
|---|---|---|
| Year 1 | Core Production Lines | Deploy 5G private networks, edge optimization |
| Year 2 | All Factory Equipment | Digital twin modeling, real-time big data analysis |
| Year 3 | Supply Chain Integration | Blockchain traceability, full-link security management |
Through phased promotion, gradually improve system functions and accumulate operational experience, ultimately achieving comprehensive intelligent manufacturing transformation.
Security Architecture Design (Based on Purdue Model Evolution)
Since IIoT systems often involve bridging between production sites and enterprise information systems, security design is particularly critical. Although the traditional Purdue model provides layered protection for OT systems, it needs to be adjusted in the IIoT environment. The following diagram shows an improved security zoning design:

Key Control Measures:
- Deploy industrial-grade firewalls, intrusion detection systems (IDS), and physical isolation measures between Level 1 and Level 2.
- Implement Software Defined Perimeter (SDP) strategies in Level 3 to manage access control in detail, ensuring security isolation between application and data layers.
- Use end-to-end encryption and actual device identity authentication mechanisms for all devices, data channels, and control commands.
Typical Industry Application Cases
Case 1: Smart Factory Energy Efficiency Optimization
Background:A large manufacturing enterprise introduced IIoT solutions based on traditional production models, focusing on real-time monitoring of equipment energy consumption and status to reduce energy consumption per unit product and achieve predictive maintenance of equipment.
Implementation Process:
- Deploy over 300 wireless vibration sensors and temperature sensors.
- Use time-series databases to store over 1TB of data daily and employ edge computing nodes for preliminary analysis of the data.
- Build a real-time energy efficiency model based on Flink, predicting equipment energy consumption trends through big data analysis and providing real-time feedback to the equipment control system.
- Utilize visualization dashboards to display energy consumption data and key indicators, assisting management in making energy-saving decisions.
Implementation Effects:
- Energy consumption per unit product reduced by 22%.
- Overall OEE (Overall Equipment Efficiency) improved by 18%.
- Device response time improved, with fault warning rate increased to 95%.
Architecture Features Summary:
- High-density sensor layout
- Edge data preprocessing ensures real-time performance
- Cloud platform deep learning and predictive optimization
- Seamless integration of business systems and on-site equipment
Conclusion
This article presents a complete and systematic design practice plan for industrial Internet of Things projects from multiple perspectives, including architecture analysis, data flow design, integration problem-solving, detailed implementation steps, security design, and industry applications. The design plan is based on advanced layered thinking and end-to-end data flow concepts, combined with small-scale pilot verification, dynamic optimization, and long-term expansion strategies, providing a practical reference template for enterprises implementing IIoT. Enterprises can adjust and optimize this plan based on their business needs and on-site environments to ultimately achieve digital transformation and intelligent manufacturing goals.