GSEA | MSigDB: https://www.gsea-msigdb.org/gsea/msigdb/index.jsp
The Molecular Signatures Database (MSigDB) is a resource that contains tens of thousands of annotated gene sets, specifically designed for <span>GSEA</span>. Gene Set Enrichment Analysis (GSEA) is a computational method used to determine whether a predefined set of genes shows statistically significant and consistent differences between two biological states (such as phenotypes). In simple terms, it assesses whether there are significant differences in gene expression within a predefined gene set under two conditions (experimental group and control group), where the gene sets are grouped based on specific features, facilitating the exploration of functional changes in our data.
Database Overview
First, let’s introduce the annotated gene sets available in the MSigDB database. Currently, the gene sets on the website are divided into two main sections: human gene sets and mouse gene sets. As of now, the human Molecular Signatures Database (MSigDB) contains 35,134 gene sets categorized into 9 main collections and several sub-collections. The mouse Molecular Signatures Database (MSigDB) includes 17,063 gene sets divided into 6 main collections and several sub-collections.
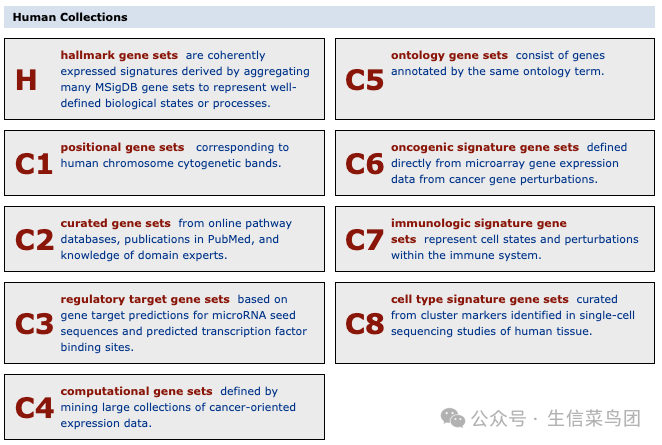
Human MSigDB Gene Set Database
H: Hallmark Gene Sets (50 Gene Sets)
Liberzon A, Birger C, Thorvaldsdóttir H, Ghandi M, Mesirov JP, Tamayo P. The Molecular Signatures Database (MSigDB) hallmark gene set collection. Cell Syst. 2015 Dec 23;1(6):417-425. doi: 10.1016/j.cels.2015.12.004 . PMID: 26771021 ; PMCID: PMC4707969.
These hallmark gene sets represent core characteristics of biological processes (50 in total). They are generated through a combination of automated computational processes and manual expert curation, with detailed descriptions provided in the associated articles. Additionally, this gene set primarily aims to address the issue of gene set “redundancy.” The following describes this issue as outlined in the article:
Redundancy in gene set analysis can manifest in various forms. The most direct situation is that different gene sets may contain a large number of overlapping genes (i.e., there is significant overlap between gene sets). A more subtle form of redundancy occurs when certain gene sets, although only partially overlapping, actually refer to similar or identical biological processes. In such cases, these gene sets may simply represent different “transcriptional readouts” of the same biological process—meaning they reflect different aspects of the same biological process.
In both cases, if you perform Gene Set Enrichment Analysis (GSEA), these highly overlapping or functionally similar gene sets may be detected as significant results simultaneously. This can lead to a long list of “significant gene sets” in the analysis results, many of which actually represent the same or similar biological processes (i.e., information redundancy).
Furthermore, many highly scored but overlapping or redundant gene sets may occupy the top positions in the results list, pushing other potentially important but less redundant gene sets down the list, making it easy to overlook these potential important findings and not fully utilize the value of GSEA.
Additionally, if a biological process is represented at the top of the results list by a large number of redundant gene sets, it can affect the distribution of the enrichment score, exaggerating the statistical significance of these redundant gene sets.
C1: Location Gene Sets (302 Gene Sets)
Chromosomal location gene sets are grouped based on the position of genes on chromosomes. The annotation information for this gene set is derived from chromosome and karyotype band data in Ensembl BioMart (the specific version used can be referenced in the MSigDB release notes) and reflects the gene structure on the primary assembly. These gene sets are useful for studying effects related to chromosomal deletions or amplifications, gene dosage compensation, epigenetic silencing, and other chromosomal region-related effects.
For example, a gene set <span>chr10p11</span> refers to band 11 on the short arm of human chromosome 10.
C2: Curated Gene Sets (7561 Gene Sets)
The C2 collection is divided into two sub-collections: Chemical and Genetic Perturbations (CGP) and Canonical Pathways (CP).
CGP: Chemical and Genetic Perturbations
The majority of data in the CGP sub-collection is sourced from the curation of biomedical literature. Many important biological and clinical states (such as cancer metastasis, stem cell characteristics, and drug resistance) have been identified through microarray and sequencing studies. Unlike pathway databases that aim to reflect general descriptions of cellular processes, CGP primarily provides specific targeted feature sets derived from perturbation experiments. Many gene sets are integrated to indicate induced (xxx_UP) and suppressed (xxx_DN) genes. Most CGP sets are curated from publications and include PubMed citation links, specific sources of gene sets (e.g., Table 1), and links to corresponding raw data in GEO or ArrayExpress databases. When gene sets involve genetic perturbations, a brief description will include links to the NCBI (Entrez) gene database for that gene entry; if involving chemical perturbations, the description will include links to the corresponding compound entries in the NCBI PubChem Compound database.
CP: Canonical Pathways
This gene set is compiled from multiple online databases.
- BioCarta pathway database
- KEGG MEDICUS pathway database
- PID pathway database
- Reactome pathway database
- Wikipathways pathway database
- KEGG pathway database (canonical pathways gene sets)
C3: Regulatory Target Gene Sets (3713 Gene Sets)
These gene sets represent potential regulatory targets of transcription factors or microRNAs. They consist of genes sharing regulatory elements. The motifs represent known or potential cis-regulatory elements in promoters and 3′-UTRs. These gene sets can link changes in expression profiles from experiments to presumed cis-regulatory elements. The C3 collection is divided into two sub-collections: microRNA targets (MIR) and transcription factor targets (TFT).
MIR: microRNA Targets
miRDB
These gene sets contain human miRNA target genes predicted using the MirTarget algorithm (Liu and Wang, 2019). Data is curated from miRDB v6.0 (mirdb.org, Chen and Wang, 2020), selecting only target genes with a MirTarget score above 80 (i.e., high-confidence predictions). The miRNAs in miRDB v6.0 are sourced from miRBase v22 (released March 2018).
MIR_LEGACY
These are earlier gene sets that previously represented the C3:MIR sub-collection before MSigDB v7.1. These gene sets consist of genes sharing the same 7-nucleotide sequence (7-mer motif) in their 3′ untranslated regions (3’UTR). Each 7-base sequence is complementary to the “seed region” (nucleotides 2 to 8) of mature human miRNAs (included in miRBase v7.1, October 2005).
TFT: Transcription Factor Targets
GTRD
These gene sets include human genes predicted to contain specific transcription factor binding sites in their promoter regions (i.e., the region from -1000bp to +100bp around the transcription start site). The gene sets are sourced from the Gene Transcription Regulation Database (GTRD, gtrd.biouml.org) through a unified analysis process, with each gene set representing a potential candidate list of regulatory target genes for each transcription factor.
TFT_LEGACY
These are earlier gene sets that represented the C3:TFT sub-collection before MSigDB v7.1. These gene sets consist of genes sharing upstream cis-regulatory elements (motifs) that may serve as potential transcription factor binding sites.
C4: Computational Gene Sets (1006 Gene Sets)
These computational gene sets are defined by mining extensive cancer-related expression data. This collection is divided into three sub-collections: Selected Cancer Cell Atlas (3CA), Cancer Gene Neighborhood (CGN), and Cancer Modules (CM).
3CA: Selected Cancer Cell Atlas
Gavish, A., Tyler, M., Greenwald, A.C. et al. Hallmarks of transcriptional intratumour heterogeneity across a thousand tumours. Nature618, 598–606 (2023). https://doi.org/10.1038/s41586-023-06130-4
The authors curated, annotated, and integrated data from 77 different studies, analyzing 1163 tumor samples (covering 24 tumor types) to reveal patterns of transcriptional heterogeneity across tumors. They identified 41 consensus “meta-programs” (gene sets prefixed with GAVISH_3CA_MALIGNANT_METAPROGRAM_) that consist of groups of genes co-upregulated in cellular subpopulations across multiple tumors. These meta-programs encompass various cellular processes, including general processes (such as cell cycle, stress response) and lineage-specific expression patterns. The authors also extended the meta-program analysis to six common non-malignant cell types (gene sets prefixed with GAVISH_3CA_METAPROGRAM_). https://www.weizmann.ac.il/sites/3CA/
CGN: Cancer Gene Neighborhood
In the GSEA paper by Subramanian, Tamayo et al. (2005), the authors mined relevant gene sets from four expression profile databases. First, they curated a list of 380 cancer-related genes based on internal resources and literature from Brentani, Caballero et al. Using the expression profile of each gene as a template, they calculated the Pearson correlation coefficient with all other genes and ranked them by correlation. A correlation threshold of R ≥ 0.85 was set to filter out genes highly correlated with the template gene (i.e., the “neighborhood”). Each compendium independently calculated correlations, so each cancer gene can have a different “neighborhood” across different datasets. If a neighborhood contains fewer than 25 genes under this threshold, it is excluded from analysis. Ultimately, 427 gene sets were obtained.
CM: Cancer Modules
Defined by Segal E, Friedman N, Koller D, and Regev A, this gene set showcases a module map of conditionally active modules in cancer (Nature Genetics, October 2004; 36(10):1090-8). In short, the authors compiled gene sets (“modules”) from various resources such as KEGG and GO. By mining extensive cancer-related microarray datasets, they identified 456 modules that significantly change under various cancer conditions. http://robotics.stanford.edu/~erans/cancer.
C5: Ontology Gene Sets (16228 Gene Sets)
These gene sets are sourced from ontology resources and divided into four sub-collections, all derived from ontology annotations. These ontology annotations are curated from databases maintained by their respective authoritative organizations. Gene sets that are too broad (producing over 2000 genes) or yield fewer than 5 genes have been excluded.
BP: Biological Process
CC: Cellular Component
MF: Molecular Function
HPO: Human Phenotype Ontology
The Human Phenotype Ontology (HPO) provides a standardized vocabulary for describing phenotypic abnormalities that occur in human diseases (https://hpo.jax.org/). HPO annotations include these phenotypic abnormalities and their associations with known genes involved in the development of these abnormalities, established through resources such as medical literature, Orphanet, DECIPHER, and OMIM. Gene sets in this sub-collection are prefixed with “HP” to indicate their ontological source.
C6: Cancer Characteristic Gene Sets (189 Gene Sets)
These gene sets represent cellular pathway characteristics that are often dysregulated in cancer. Most characteristic profiles are directly derived from microarray data in NCBI GEO or internal unpublished gene expression profiling experiments involving known cancer genes. Additionally, a small number of cancer characteristic profiles are curated from scientific publications.
C7: Immune Characteristic Gene Sets (5219 Gene Sets)
The Immune Characteristic Database (ImmuneSigDB) consists of gene sets representing cell types, states, and perturbations within the immune system, extensively curated from published studies in human and mouse immunology. Initially, relevant microarray datasets published in immunology literature with original data stored in the Gene Expression Omnibus (GEO) were collected. For each published study, relevant comparison groups (e.g., wild-type vs. knockout; pre-treatment vs. post-treatment) were identified, and concise biological significance descriptions were created. All data were processed and standardized in the same manner to identify gene sets corresponding to the top or bottom genes ranked by mutual information in each specified comparison group (FDR<0.02 or up to 200 genes).
VAX: Vaccine Response Gene Sets
C7 also includes a separate sub-collection sourced from the Human Immunology Project Consortium (HIPC), which systematically curated gene expression results related to approximately 50 vaccine-related genes from 62 publications. The initial literature screening was completed by searching PubMed for papers matching “vaccine[AND]characteristics” or “vaccine[AND]gene expression.” Inclusion criteria required that each gene list must show statistically significant differential gene expression.
C8: Cell Type Characteristic Gene Sets (866 Gene Sets)
These gene sets contain marker genes identified in single-cell sequencing studies of human tissues. They are meticulously curated from the literature, representing the marker genes and cell type identification results described in their respective original publications.
** Some information used in single-cell marker databases is partially derived from these gene sets. **
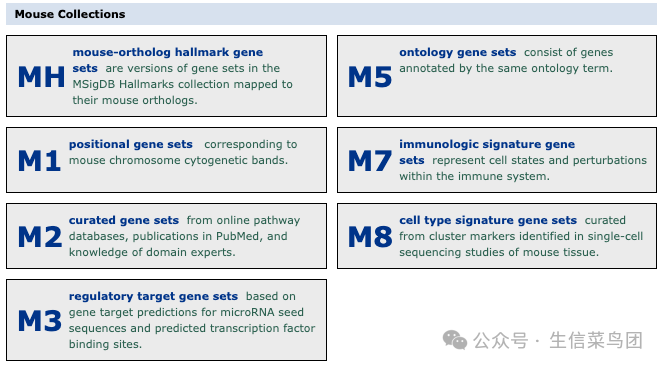
Mouse MSigDB Gene Set Database
The mouse Molecular Signatures Database (MSigDB) contains 17,063 gene sets divided into 6 main collections and several sub-collections. The corresponding collections are essentially consistent with those in humans.
NH: Hallmark Gene Sets (50 Gene Sets)
Liberzon A, Birger C, Thorvaldsdóttir H, Ghandi M, Mesirov JP, Tamayo P. The Molecular Signatures Database (MSigDB) hallmark gene set collection. Cell Syst. 2015 Dec 23;1(6):417-425. doi: 10.1016/j.cels.2015.12.004 . PMID: 26771021; PMCID: PMC4707969.
Similar to the human hallmark gene sets, this gene set is a homologous conversion of the human gene sets.
M1: Location Gene Sets (341 Gene Sets)
Corresponding to mouse chromosomal cytogenetic bands.
M2: Selected Gene Sets (2733 Gene Sets)
M3: Regulatory Target Gene Sets (2047 Gene Sets)
M5: Ontology Gene Sets (10872 Gene Sets)
M7: Immune Characteristic Gene Sets (787 Gene Sets)
M8: Cell Type Characteristic Gene Sets (233 Gene Sets)
Gene Set Data Download
Human MSigDB Gene Sets: https://www.gsea-msigdb.org/gsea/msigdb/human/collections.jsp
Mouse MSigDB Gene Sets: https://www.gsea-msigdb.org/gsea/msigdb/mouse/collections.jsp
Gene Set Data Format
GMT: Gene Matrix Transpose File Format (*gmt)
The GMT file format is a tab-delimited file format that describes gene sets. In GMT format, each line represents a gene set. 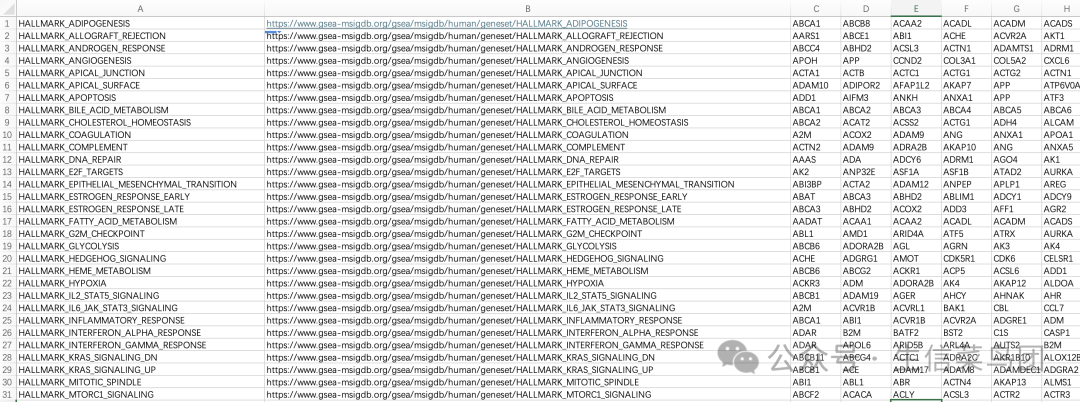
- First column: Gene set name
- Second column: Gene set description link
- Third column and beyond: Genes in the gene set