When using Jetson modules and other embedded systems, it is essential to optimize applications based on power distribution and computational resources. Monitoring becomes particularly important to avoid performance and thermal throttling issues.
Jetson modules come with built-in GPU, CPU, and various AI accelerators, along with highly efficient Power Management Integrated Circuits (PMIC), voltage regulators, and power trees for power efficiency optimization. NVIDIA offers a variety of tools and resources to help you fully utilize the power architecture and optimize resource usage:
-
Various power modes
-
Power, thermal, and electrical management features
-
Jetson Power GUI for monitoring power and thermal status
-
Tegrastats for providing module command line statistics
-
JTOP
Power Modes of Jetson
Each Jetson module supports multiple pre-configured power modes and can also be optimized for specific power budgets such as 10W, 15W, or 30W. Each power distribution has various available configurations for resource utilization.
These power modes can be set using nvpmodel, allowing users to select one of the pre-configured modes or create a custom power mode that meets their needs. The nvpmodel configuration supports a certain number of online GPU TPCs, CPUs, DLAs, and PVAs at specific frequencies, thereby keeping the module within a specific power distribution range.
MAXN mode is also a flexible power mode. It can provide the maximum number of cores and clock frequencies for various processors and engines, and then adjust them to create a custom power mode that balances performance and power consumption.
Power, Thermal, and Electrical Management Features
Jetson provides various power, thermal, and electrical management features:
-
Clock gating
-
Power gating
-
Dynamic voltage frequency scaling
-
Deep sleep (SC7) mode
-
Standby power mode
For more information, please refer to the Jetson Linux Developer Guide:
https://docs.nvidia.com/jetson/archives/r35.4.1/DeveloperGuide/text/SD/PlatformPowerAndPerformance/JetsonOrinNanoSeriesJetsonOrinNxSeriesAndJetsonAgxOrinSeries.html#supported-modes-and-power-efficiency
Jetson Power GUI
NVIDIA provides various tools with JetPack to assist users in thermal and power management, such as the Jetson Power GUI, which is installed as part of the JetPack visual components.
Jetson Power GUI allows users to monitor the power and thermal status of the Jetson motherboard. Users can track CPU and GPU usage and device temperature through the main tab, and quickly identify any potential performance bottlenecks or excessive power consumption through real-time monitoring features.
With the support of Jetson Power GUI, users can balance performance and power consumption by adjusting power modes. Depending on the Jetson motherboard used, users can select from predefined power modes.
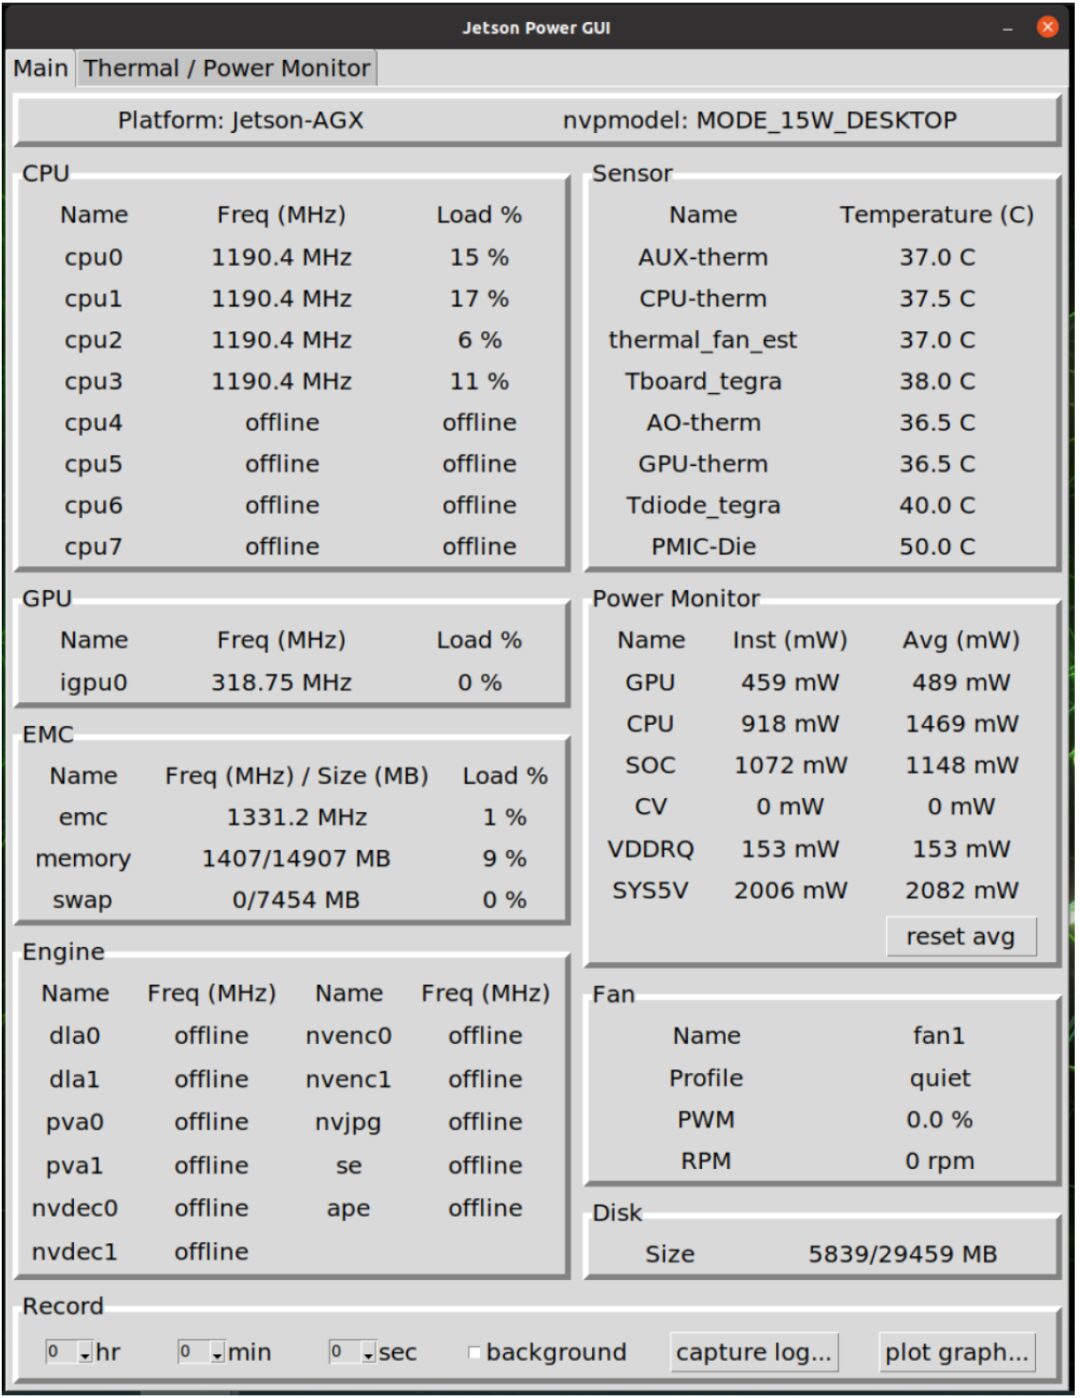
Figure 1: Startup page of Jetson Power
The Power GUI tool can log power-related information to a log file over a specified period, effectively helping to capture and analyze behaviors during specific tasks or time periods. For example, capturing performance information during the first 3 minutes after Jetson starts.
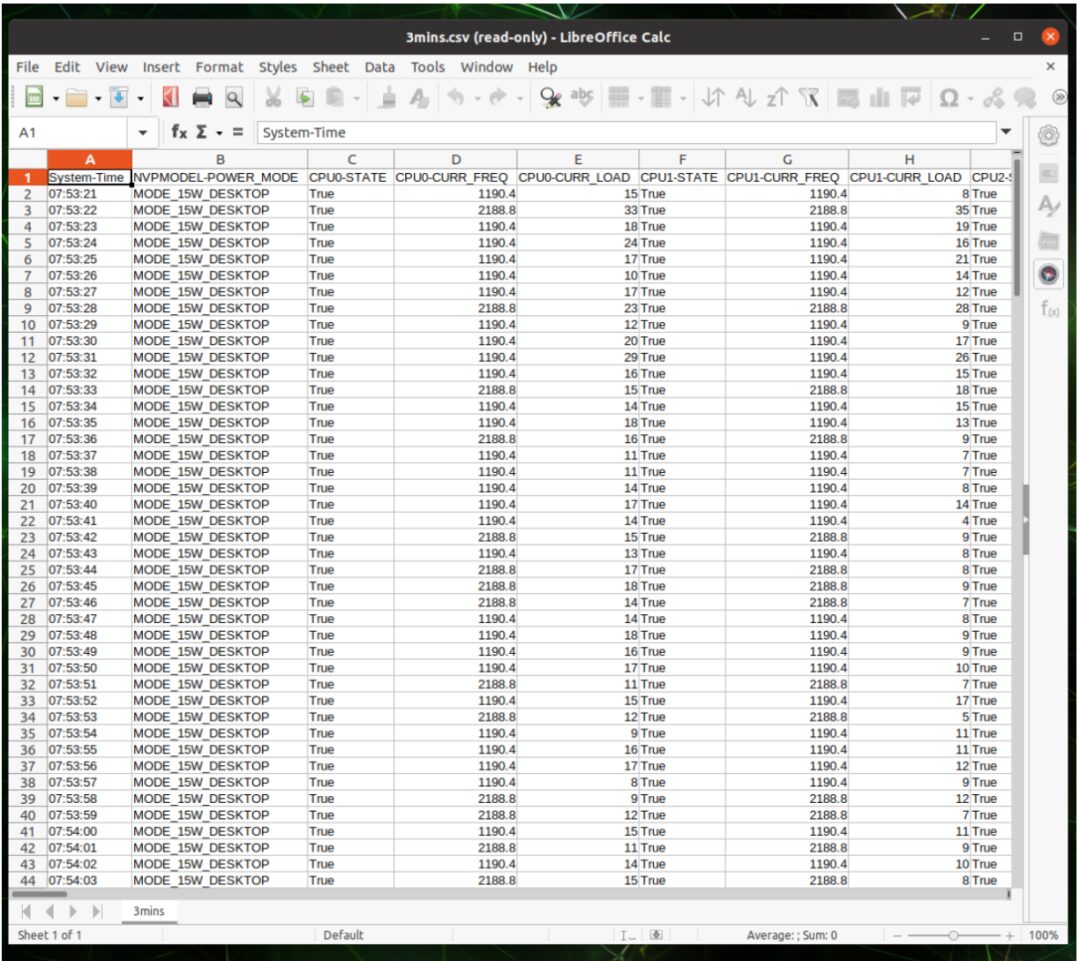
Figure 2: Example of a log file from Power GUI
“plot graph…” button features data visualization capabilities, allowing users to plot graphs of real-time power-related information. The captured log files can also be used to create graphs, helping users understand the system’s operation more easily and intuitively.
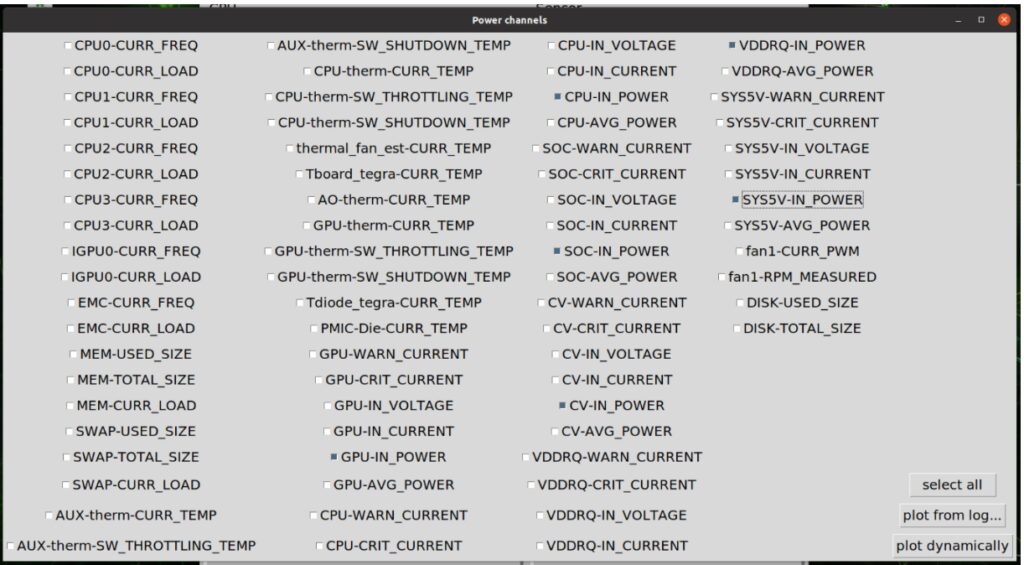
Figure 3: Channel selection for graph plotting
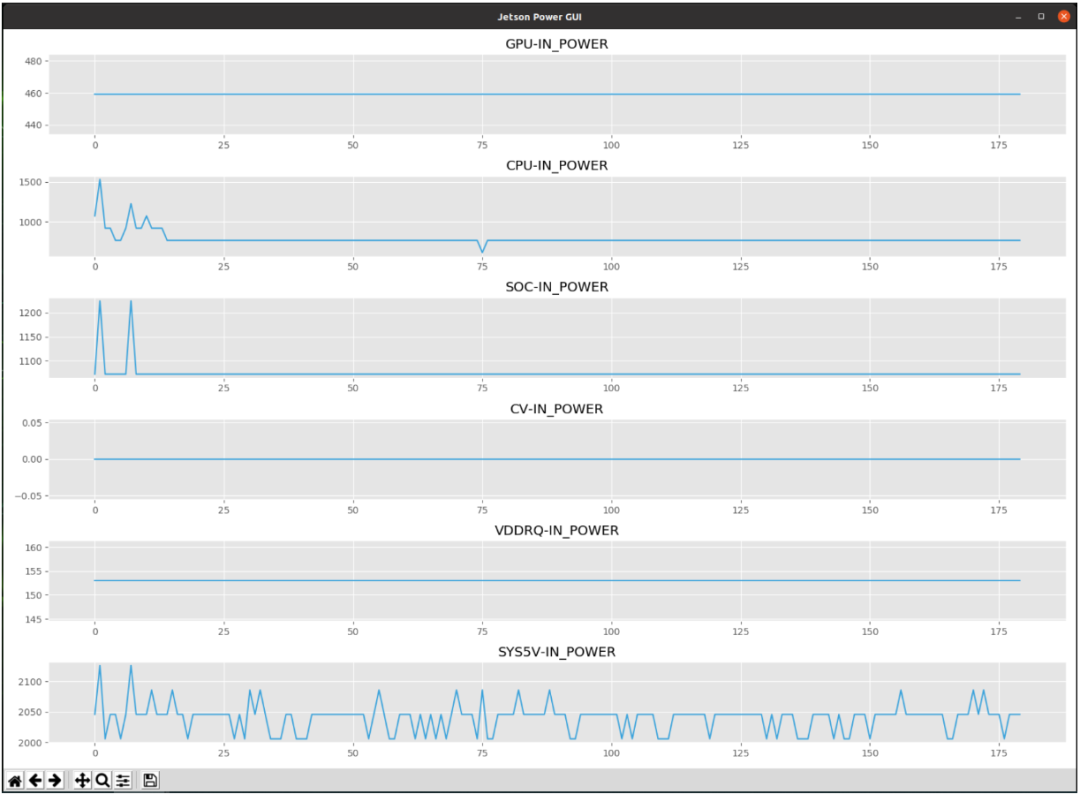
Figure 4: Example of graph plotting in Jetson Power GUI
Tegrastats
Tegrastats is a command-line utility from NVIDIA that reports memory and processor usage on the Jetson platform. This tool is provided with JetPack and can be found in <top>/core/utils/tegrastats.
Tegrastats provides insights into multiple usage metrics such as CPU, GPU, and memory, completing power consumption monitoring and updating power consumption in real-time. These metrics are crucial for understanding system performance.
Tegrastats also provides thermal behavior-related information, such as the operating temperatures of the CPU and GPU, helping to prevent thermal throttling.
How to Use
To use Tegrastats on Jetson, run the following command.
Run the command in the foreground:
$ tegrastats —interval <int>In this command, <int> is the interval time for log output in milliseconds.By default, Tegrastats updates statistics every second.
Run the following command in the background:
$ tegrastats —interval <int> -logfile <out_file> &In this command, <out_file> is the path name of the output file where Tegrastats will write the log output.
Here is an example of Tegrastats output:
RAM 1545/31919MB (lfb 7400x4MB) SWAP 0/15959MB (cached 0MB) CPU[0%@1190,0%@1190,0%@1190,0%@1190,0%@1190,0%@1190,0%@1190,0%@1190]EMC_FREQ 1%@408 GR3D_FREQ 0%@318 VIC_FREQ 0%@115 APE 150 MTS fg 0% bg 0%AO@38C [email protected] [email protected] PMIC@100C [email protected] [email protected]@38.8C Tboard@39C GPU 0/0 CPU 468/468 SOC 937/937 CV 0/0 VDDRQ312/234 SYS5V 1458/1458Tegrastats can also be integrated into scripts or applications to obtain system statistics, enabling more automation solutions.
JTOP (Jetson-stats)
JTOP provides a user-friendly way to monitor Jetson resources, helping users visualize various bottlenecks encountered in applications. For example, it can show whether an application requires significant storage operations or whether it is not utilizing the hardware acceleration engines in the Jetson module. JTOP can optimize applications for the Jetson module more efficiently and streamlined in this way.
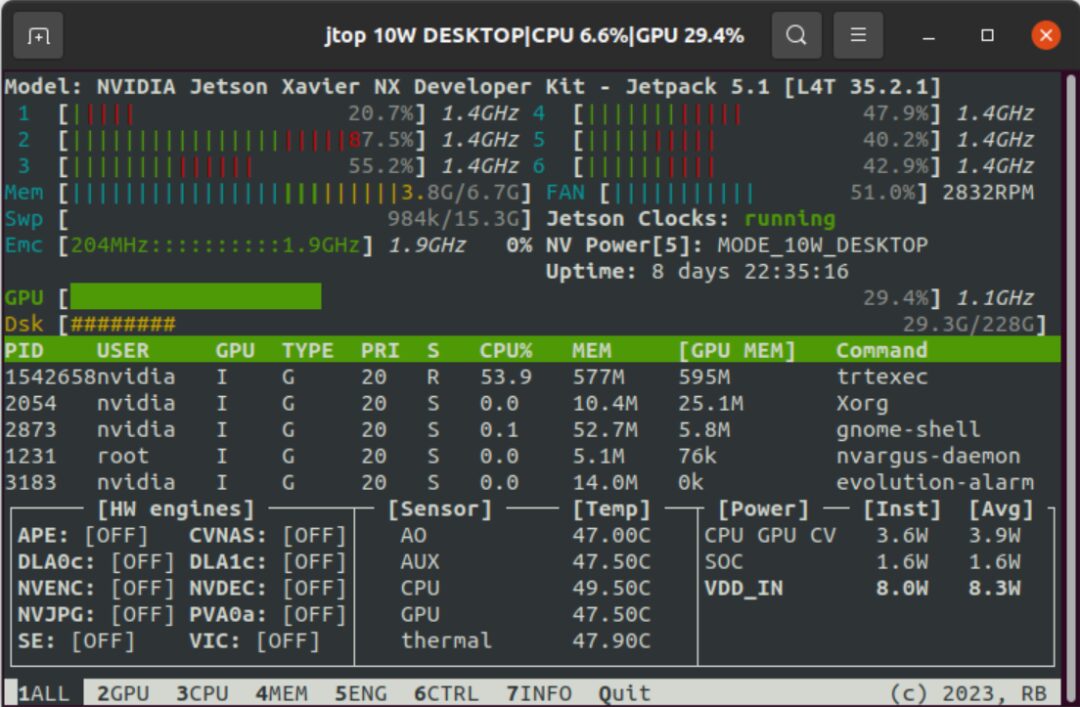
Figure 5: JTOP startup screen
JTOP is designed for monitoring and managing the following NVIDIA Jetson modules:
-
NVIDIA Orin
-
NVIDIA Xavier
-
NVIDIA Nano
-
NVIDIA TX
JTOP can update system performance-related information in real-time, assisting users in analyzing CPU and GPU usage, working temperatures, memory usage, and other relevant information.
Through JTOP, users can access these details on the GUI for better visualization, providing a convenient way to track system metrics and performance data, especially when running heavy AI workloads.
JTOP also offers features for fine-tuning system performance. Users can select runtime power modes for Jetson devices and even control fan speeds, benefiting from optimizing system performance and thermal management.
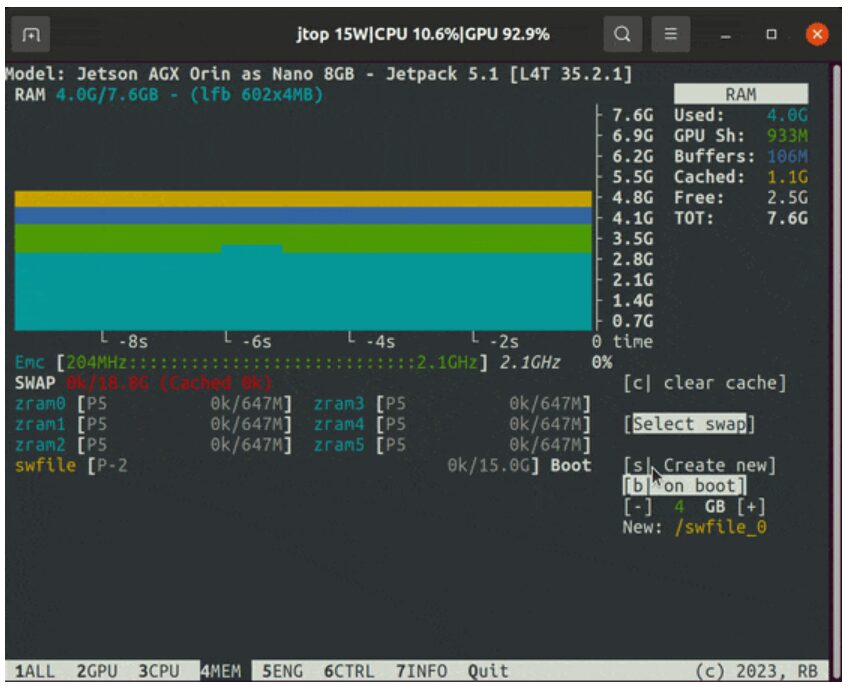
Figure 6: Memory monitor in JTOP
Maximizing system performance while having limited power budgets is where JTOP excels. Please use pip to install JTOP:
$ sudo apt update $ sudo apt-get install python3-pip$ sudo pip install -u jetson-statsUse the jtop command:
$ jtopThe JTOP tool is also suitable for Python libraries, where its API allows users to easily integrate JTOP functions into scripts.
from jtop import jtop with jtop() as jetson: while jetson.ok(): #read jetson stats print(jetson.stats)For more information, check out the following video provided by JetsonHacks:
JTOP: Will You Use the Tools Used by Jetson Experts?
Start Optimizing Power Today
The NVIDIA Jetson platform is continuously enhancing edge inference performance for robotics and edge AI. For most edge AI applications, power consumption distribution is crucial. Using NVIDIA tools, you can monitor system performance and establish custom power characteristic models.
For more information, please check the following resources:
-
Supported modes and power efficiency
https://docs.nvidia.com/jetson/archives/r35.4.1/DeveloperGuide/text/SD/PlatformPowerAndPerformance/JetsonOrinNanoSeriesJetsonOrinNxSeriesAndJetsonAgxOrinSeries.html%22%20/l%20%22supported-modes-and-power-efficiency
-
JTOP (jetson-stats) User Guide
https://rnext.it/jetson_stats/
-
Troubleshooting (Jetson_stats)
https://rnext.it/jetson_stats/troubleshooting.html
-
/rbonghi/ros_jetson_stats GitHub Code Repository
https://github.com/rbonghi/ros_jetson_stats
-
/NVIDIA-AI-IOT/ros2_jetson_stats GitHub Code Repository
https://github.com/NVIDIA-AI-IOT/ros2_jetson_stats
By using all the tools mentioned in this article, you can easily create an energy-efficient and high-performance system for your applications.