Optimizing Diagnostic Strategies for Automotive SoC Embedded Memory

Abstract

Embedded memory in automotive System-on-Chips (SoC) typically occupies a significant area on the chip. Therefore, defects in these memories can severely impact the yield of any autonomous driving device. Along with statistical process control during the ramp-up phase and mass production, collecting diagnostic information, in addition to pure test data, is a good practice in the automotive industry. Designers and technical experts must derive accurate diagnostic results from faulty devices to formulate correct maintenance strategies by identifying and correcting related issues at the source and responding to erroneous behaviors. A common approach is to generate a fault map based on the collection of all faulty bit coordinates and send it to testers one by one. More effectively, the faults encountered can be retrieved.

This paper presents a method for compressing diagnostic information during the testing of SoC embedded memory. More specifically, this method is applied to diagnose embedded FLASH memory. This strategy allows for the reconstruction of fault maps without any loss, while the compression method yields an approximate value. The proposed method utilizes only a small portion of the memory required by coordinate-based bit mapping methods and is comparable to compression methods. At the cost of moderate test time overhead, the proposed strategy allows for a significant increase in the number of devices that can be fully diagnosed without any loss in fault map reconstruction. In a real embedded FLASH production scenario, most faulty devices are diagnosed after a single transfer from the chip to the test host.

I. Introduction
Embedded memory integrated into modern automotive microcontrollers occupies a significant portion of the chip area. For this reason, they have a substantial impact on yield, leading to significant effort invested in their testing and repair processes. Their failures and “failure history” must be studied to diagnose issues during the production phase.
The purpose of testing is to ensure that each commercialized device operates perfectly according to expected specifications. Many considerations must be taken into account when designing test steps, including early failures indicated by bathtub curves and other aging effects that affect circuit physical parameters.
Software testing is a commonly used viable solution in the industry, but it is known to be particularly slow. As part of the test design work, dedicated hardware has been developed, as described in [3][4][5][6][7], to improve this issue. A standard approach is to implement a hardware Built-In Self-Test (BIST). This hardware, executed directly on the chip, can test many internal components, which is impractical or impossible to achieve using external testing tools or software methods.
For embedded FLASH (eFLASH) testing, a memory requires multiple erase, program, and verify operations to assess the presence of faults. Another important concept during characterization and ramp-up phases is to collect test data and add it to pure testing, allowing manufacturers to continuously feed diagnostic information back to technical experts and designers. Such an accurate process can improve yield and profitability.
A widely adopted solution for reporting faults is bit fault mapping, where bit behavior is reported by creating a matrix representation of the memory, showing each bit, marked as 0 if functioning normally, and 1 if a fault is detected. This technique is memory-intensive and time-intensive, as it requires complex and time-consuming communication between automated test equipment (ATE) and the device under test (DUT). For these reasons, bitmaps are rarely used in production environments unless for statistical process control reasons during mass production to compress the information collected along the tests. A solution that minimizes the cost of bitmaps includes on-chip bitmap compression.
This paper proposes an innovative method based on data encoding and coloring concepts to collect and compress diagnostic information for eFLASH memory. This on-chip approach achieves high data compression with minimal impact on speed.
In our device (Aurix TC39xB), eFLASH testing is conducted using a composite on-chip mode consisting of a programmable hardware BIST and a CPU. When the BIST applies test stimuli, the CPU coordinates the entire process, including receiving and articulating fault information from the BIST to generate an encoded fault bitmap. By carefully utilizing this setup, significant memory savings can be achieved, and the test time overhead is also acceptable.

This paper is organized as follows: Section II briefly explains the BIST architecture used for eFLASH testing and analyzes the eFLASH testing process to understand the main sources of diagnostic information. Section III elaborates on the process from failure coordinates to creating the basic information structure. Section IV presents experimental results from over 1800 real case bitmaps collected during the production phase. Section V summarizes the findings.

II. Background
A. Embedded Memory Structure
In a typical embedded memory, bits organized in a matrix are arranged by rows (called word lines) and columns (called bit lines). Each word line is further divided into pages with a certain number of bits. Pages represent the smallest granularity of memory, composed of a certain number of bits. The entire page will be accessed and ultimately modified to read or program a single bit. A single memory unit composed of a certain number of word lines and bit lines is known as a physical sector. Finally, higher-level structures are composed of multiple physical sectors. It is also important to mention a common memory organization called scrambling, consisting of multiplexed and mirrored bits, as detailed in [3]:
● Multiplexing: Bits with the same index are physically adjacent in the word line
● Mirroring: Word lines are mirrored about a midpoint.
Figure 1 shows a visual representation of a 16-bit memory organized as a 4-bit word. Physically, it achieves a multiplexing factor of 4 and mirrors every 2 scrambled bits.
Optimizing Diagnostic Strategies for Automotive SoC Embedded Memory
Figure 1. Memory organization and fault details received from BIST
B. Architecture for Diagnosis
The embedded memory diagnosis described by Landzberg et al. is the most straightforward structure. This work proposes an ATE-based method that can directly access the tested memory, retrieving immediately upon the appearance of fault coordinates or a set of coordinates stored on the chip. This method does not process the collected data; the series of failures can be reconstructed from the entire set of coordinates.
In contrast, Schanstra et al., Chen et al., and Bernardi et al. proposed variations by utilizing integrated memory testing capabilities and additional hardware supporting on-chip bitmap collection. Schanstra et al.’s method uses a modified BIST architecture and extends it to perform shape recognition. The described BIST identifies and compresses shapes such as failed bit lines or word lines. During this compression process, some faults may be lost, so this technique does not produce an accurate bitmap representation. Chen et al. proposed a compression method to reduce the number of bits required to reconstruct fault clusters; this reduction comes at the cost of low accuracy in reconstructing clusters. Bernardi et al. combined integrated BIST with the CPU of their device to compress the fault coordinates discovered during their tests. The BIST reported the coordinates of each fault bit. The CPU then compresses these addresses by effectively searching the cubes of the Karnaugh map to utilize don’t-care values. This method limits the amount of communication between the ATE and DUT.
III. Proposed Method
The proposed method is based on the concept of encoding to create a compact fault bitmap on-chip. By leveraging a composite testing architecture, bitmap information is stored in encoded or “colored” segments, referred to as “slices,” and updated as testing progresses.
Optimizing Diagnostic Strategies for Automotive SoC Embedded Memory
The proposed compression method guarantees high accuracy, similar to [8]. In contrast, it returns an approximate information due to compression, as shown in Table I. Regarding memory demands, the proposed method requires fewer memory resources than those required by [8], while being slightly more than the method in [5] when using the minimum compression ratio. The proposed method runs on-chip and can download complete information at the end of the test, just as done in [8] and possibly the method in [5], which was originally achieved through additional hardware and tester capabilities.
Optimizing Diagnostic Strategies for Automotive SoC Embedded Memory
Figure 2. Organization of CPU and programmable BIST
The proposed bit mapping mode is supported by a suitable hardware-software design, where a programmable BIST can be directly accessed from the CPU, as shown in [9] and [10]. Figure 2 demonstrates how the flash design used for testing operates. The CPU activates the selected process for the programmable BIST to run and then waits for fault events. When a fault is encountered, the BIST stops and displays a flag. Once the CPU notices this defect through polling actions, it can access the data, resume BIST operations, and then perform some calculations. These on-chip calculations may involve allocating some redundant elements for repair algorithms and the bit mapping algorithm described in this paper. In Figure 3, the execution of a golden fault-free test is displayed. Here, after the initial phase, the BIST independently tests the entire embedded flash within a reference time known as “tgold”.
Optimizing Diagnostic Strategies for Automotive SoC Embedded Memory
Figure 3. Execution of golden test
Figure 4 shows a different scenario. Here, the BIST finds a fault and stops, waiting for the CPU to read it and resume its operation. At this point, the CPU and BIST can operate independently in an interleaved manner. Therefore, when the BIST is busy testing other parts of the memory, the CPU can analyze the discovered faults and run the bit mapping algorithm or the coloring algorithm proposed in this paper.
Optimizing Diagnostic Strategies for Automotive SoC Embedded Memory
Figure 4. Fault bits and interleaved CPU and BIST operation testing
The overall test time increases, now termed “tfaulty,” which is less than the total sum of individual time components of the entire system (e.g., tfaulty is less than the total of tgold, tread, and tencoding). When calculating the need to respond to the occurrence of faults, such a folding method is very advantageous for saving test time. In our case, we leverage this potential to incrementally encode the bitmap information stored on the chip. Each time the PBIST returns a fault, the encoding algorithm is executed, and the current bitmap information is updated.
A. Proposed Encoding Strategy
The goal of the proposed method is to produce an on-chip and dynamically encoded representation of the failed bitmap. The main objective of this method is to maximize the amount of information that can be accommodated by the pre-allocated on-chip memory. The on-chip memory constitutes a very strong constraint. It is assumed that the available memory resources will be exhausted before the end of testing. In this case, the bitmap will be incomplete, or testers should intervene by downloading the current portion to resume testing and continue iteratively until the test is completed. Although the solution of multiple downloads appears feasible in theory, very few tester architectures support it, and it severely impacts testing time.
Therefore, the most viable solution to save a large number of complete bitmaps is to compress them through encoding the information. Although this comes at the cost of computational overhead for the encoding.
In our method, we encode the bitmap information on the chip into “colored segments,” also referred to as “slices,” which form the basic structure of our compression algorithm. After careful examination of thousands of fault clusters, we chose segments over other types of shapes (i.e., rectangles). Faults are mostly arranged along word lines and bit lines, making segments the most efficient and direct way to encode them. A segment represents one or more faults belonging to the same bit line or word line, and its format includes:
● Indicating whether the segment is horizontal or vertical
● The physical coordinates of the first and last faults in that segment
● A color that describes the characteristics of that segment, considering the distribution of faults it covers.
For the proposed method, four colors have been proposed, as described in Figure 5 and explained below:
A) Black: A black segment includes a single fault
B) Blue: Represents two faults that are far apart
C) Red: Represents two or more faults at odd or even positions (one or more faults interleaved with working bits). This color is beneficial when applying a checkerboard pattern, as the memory is accurately tested in its encoding pattern.
D) Orange: Two or more physically adjacent faults
Optimizing Diagnostic Strategies for Automotive SoC Embedded Memory
Figure 5. Fault shapes to color representation
In Figure 5, the left part shows the actual bitmap, while the right part reports the colored segments or slices.
Optimizing Diagnostic Strategies for Automotive SoC Embedded Memory
Figure 6. Update slices based on new input faults represented by blue dots
The aim of the proposed method is to create a set of slices that meet the fault clusters of our DUT. Such a collection is established by the CPU on the fly, responding to new faults by updating the content of existing slices or initializing a new slice.
In Figure 6, an example of how slices are updated when new faults arrive is shown:
● First, a fault is received, namely A.1, leading to the creation of a black slice in A.2. In A.2, a new fault is received, resulting in the black slice in A.3 being updated to a red slice. Similarly, a fault received in the middle of the red slice in A.3 leads to its update to the orange slice shown in A.4.
● First, a fault is received, namely B.1, leading to the creation of a black slice in B.2. In B.2, a new fault is received, which causes the black slice in B.3 to be updated to a blue slice. In B.3, a fault found directly below the blue slice leads to the creation of a black slice to encode the last fault in B.4.
B. On-chip Memory for Encoding Information
An important issue to consider is how the on-chip memory is structured. This relates not only to the potential storage capacity but also to the access time for memory information. In fact, the algorithm should be able to quickly check the information already contained to evolve the current encoded bitmap. In other words, the algorithm must search the current set of slices to see if there is an existing slice to update or create a new black slice.
The proposed method aims to minimize the information that needs to be stored and the time required for the algorithm to process a new fault. The memory organization resembles that used in caches, implementing a set associative method.
Given that the selected number of sets is N, the available memory is divided into N equal parts. When a new fault is recorded, its address and fault mask are retrieved by the CPU, which processes them to extract three parts:
● From the word line address, it can be seen
– The index of the set to which the slice belongs, e.g., calculating address % N
– The normalized fault coordinates calculated from Address/N
● A label extracted from the fault mask, which is then used for searching, indicating the position of that bit in the fault mask.
Figure 7 illustrates how to parse the output of the PBIST. Figure 8 completes the overview of memory construction, in a case where the number of sets is N=32, and the fault mask consists of 256 bits. According to the requirements of set associative construction, the memory is divided into N equally sized blocks. Once the set is calculated from the fault information, the correct memory section is accessed, and a search is conducted within the set for slices with the same label value. If such a slice already exists in the corresponding set, it will operate as previously described. Conversely, if the current fault cannot be linked to any previously stored faults, a new slice will be stored.
Optimizing Diagnostic Strategies for Automotive SoC Embedded Memory
Figure 7. Fault information analyzed by the CPU when N=32
The illustrated method is very efficient in both search time and the number of bits required. The division into sets can reduce search time by a factor that depends on the number of sets N. The set values are not stored in the slices, but can be inferred from the slice address in the on-chip memory through a reverse formula.
Optimizing Diagnostic Strategies for Automotive SoC Embedded Memory
Figure 8. Similar cache-like organization for on-chip slice storage
C. Choosing Horizontal or Vertical Encoding Direction
Of course, the fault mask may contain more than one fault bit. In this case, the algorithm can create a vertical (bit line-oriented) or horizontal (word line-oriented) slice. Although vertical coloring is easier and is done by considering one bit in the fault mask at a time, it is crucial to minimize its usage by quickly identifying horizontal shapes. Due to scrambling effects, leading to faults distributed across many flash pages within a word line, determining that a segment is horizontal becomes challenging.
To address the trade-off between speed and accuracy in choosing vertical or horizontal directions, horizontal coloring is triggered when the algorithm “guesses” that a horizontal shape exists. This guess is based on the number of faults received on the current page; if it exceeds a given threshold, horizontal coloring is activated.
Figure 9 explains the mechanism for selecting direction. Based on the number of faults in the fault mask, if their count is below the threshold, vertical coloring is immediately applied, or temporarily stored in a buffer for later coloring. In fact, if all pages arranged in the same word line are processed together according to the scrambling pattern, horizontal coloring is more efficient. Once the horizontal direction is taken, the temporary buffer is updated with failure data from other pages coming from the same word line. The contents of the buffer are processed when the first fault encountered is no longer from the investigated word line. The created horizontal slices are stored in the corresponding memory group.

Optimizing Diagnostic Strategies for Automotive SoC Embedded Memory

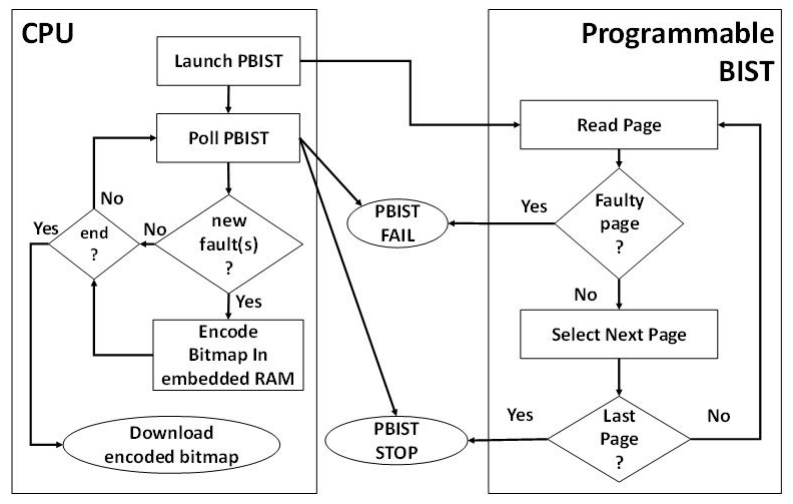
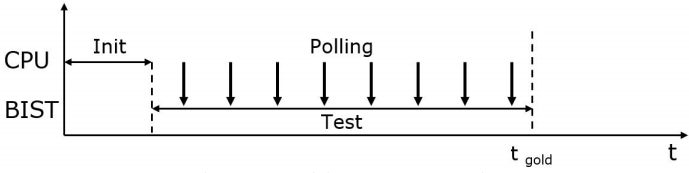
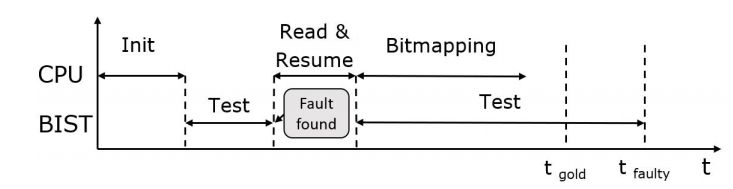
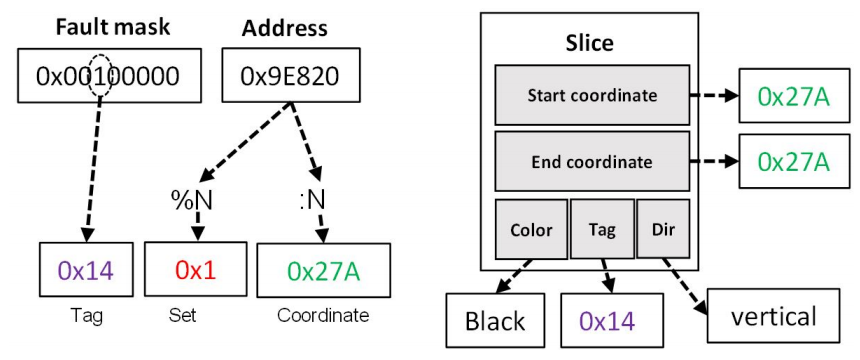
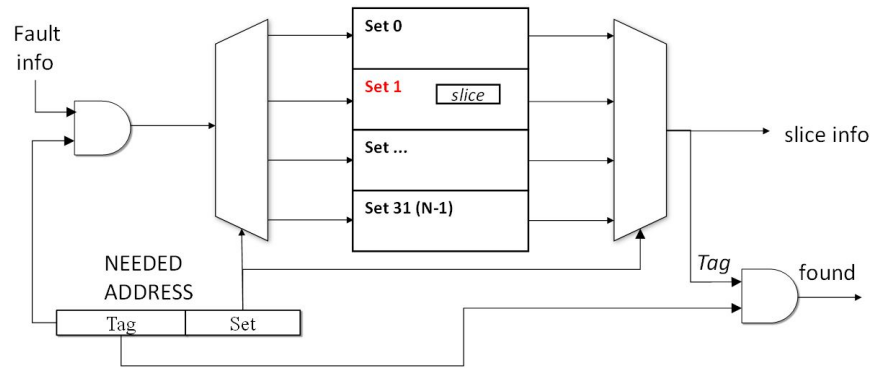
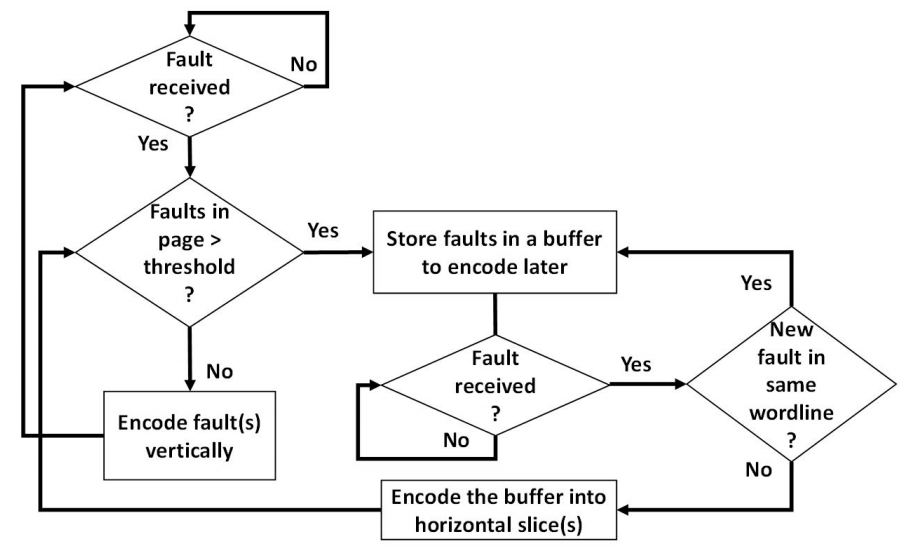
Figure 9. Flowchart for determining vertical/horizontal encoding

IV.Experimental Results

This section displays the results obtained by the proposed algorithm in various case studies. The reference device is Aurix TC39xB, manufactured by Infineon Technologies. For this device, during the testing of the operating system component size, the limit for storing bitmap information in RAM memory was set to 24KB. The constraints of available on-chip memory are key factors in evaluating this method.
In the following paragraphs, the proposed compression method will be compared with the pros and cons of using a bit-by-bit coordinate method or the compression method in [5]. The spatial area is divided into 32 groups based on scrambling parameters. The configuration parameters, including a 256-bit fault mask and a 32-bit address, result in slices of size 6 bytes with the proposed method. In contrast, the bit-by-bit method directly saves fault coordinates as 4-byte elements, while [5] uses shared bits between word lines and bit lines.
The subsequent experimental results show that the illustrated method guarantees stable average storage in terms of memory demand, which means that it can store more information than the reference bit-by-bit method when providing the same amount of memory. In other words, compared to the bit-by-bit method, the proposed method can fully record more faulty devices. The method comes at the cost of increased bitmap generation time, which appears sustainable considering the occupancy advantage.
Regarding the comparison with [5], the compression ratio during the running experiment was 4480 times. This is the lowest possible resolution, requiring a fixed 20KB of on-chip memory, making this method feasible on-chip under memory constraints.
At this point, the advantages and costs of the proposed method are first reported, mentioning four real and typical failure scenarios from production data. The comparison between the proposed method and [8], which kept a complete list of fault unit coordinates on-chip, is reported.
Then, a broader set of faulty devices, approximately 2000, was considered, accurately selected to form a substantial production sample. This part reveals that the bit-by-bit method is slightly faster but constrained by the available on-chip memory space. Meanwhile, this limitation has been alleviated in the proposed method. The average accuracy of the bitmaps reconstructed after compression in [5] is also compared, and a relevant index is calculated to assess the loss in accuracy compared to lossless methods.
A. Fine Analysis of Some Typical Stages
The following figures are cropped bitmaps showing specific areas of faulty embedded flash memory. Each figure has (A) the fault bitmap and (B) the corresponding representation returned by the algorithm.
Figure 10 shows a fault situation in the vertical direction. In this particular case, the eFlash is affected by 388 faults, with a cost of 21ms relative to the golden execution (testing with good memory). Compared to the bit-by-bit method that requires 14.35ms, the proposed method shows a relative time overhead of 46%. Despite the time loss, the proposed algorithm saves 95% of the required RAM space compared to the bit-by-bit method, which requires approximately 78B.
The vertical case is one that aligns better with the proposed algorithm. In fact, the PBIST takes some time to reach subsequent faults, allowing the CPU to greatly utilize this time to execute the algorithm.
Optimizing Diagnostic Strategies for Automotive SoC Embedded Memory
Figure 10. Example of vertical fault line direction scenario
In the case of horizontal shapes, such as the one in Figure 11, a greater time overhead is expected because horizontal coloring comes from a fault mask that contains more than one fault bit, requiring more time for calculation, and the PBIST encounters faults during each consecutive read.
Optimizing Diagnostic Strategies for Automotive SoC Embedded Memory
Figure 11. Example of partially failed word lines
In such cases, there were a total of 18229 faults, with a 69% increase in testing time compared to the bit-by-bit method, while RAM memory savings were approximately 98.68%.
Optimizing Diagnostic Strategies for Automotive SoC Embedded Memory
Figure 12. Example of sparse fault scenario
Table Two shows a comparison between the bit-by-bit method and the proposed method as the number of faults changes. It is noteworthy that the proposed method requires slightly more time and memory than the bit-by-bit method because the sparsity of the faults makes it difficult to cluster.
Optimizing Diagnostic Strategies for Automotive SoC Embedded Memory
Sparse fault architectures are another important scenario to observe. Due to limited compression possibilities, this cluster is the most challenging to handle. Figure 12 describes a case of quite dense memory matrix sparse faults. Some of these are far apart but aligned on the same bit line or word line shape, leading to blue slices, which is a synthesis of previously considered cases. Despite the inherent difficulties, the proposed method shows limited loss compared to the bit-by-bit method. In the case shown in Figure 13, containing 9949 faults, the time to collect diagnostic information was 680ms, while the bit-by-bit method required 440ms. In contrast, memory occupancy dropped sharply from 38.85KB for the bit-by-bit method to 0.1KB for the proposed method.
B. Achievements on a Larger Device Basis
Experimental measurements can also be applied to a broader base of devices. We considered 1864 faulty devices from front-end wafer test operations. Such a collection gathered many different shapes and was used for further evaluation of the advantages and costs of the proposed method.
Optimizing Diagnostic Strategies for Automotive SoC Embedded Memory
Figure 13. Fault constellation diagram with working drill bits at intersections
We compared it with the bit-by-bit coordinate method and the compression method in [5].
Table Three reports the number of devices that can be bitmaped without exceeding the on-chip 24KB RAM limit across the entire base. From this table, it can be seen how many devices are fully recorded within 24KB using only our method and the bit-by-bit coordinate method.
Optimizing Diagnostic Strategies for Automotive SoC Embedded Memory
When the 24KB on-chip RAM is filled, some diagnostic information will be lost unless the testing and diagnostic process is interrupted, and the current bitmap is dumped to the tester to restore the memory testing program. Assuming that diagnostic collection is paused, new faults are no longer recorded. In this case, previously encoded faults are retained, allowing a partial fault cluster to be reconstructed at the end of the testing process, as shown in Figure 14. The selected population averages around 2000.
Optimizing Diagnostic Strategies for Automotive SoC Embedded Memory
Figure 14. Fault constellation diagram partially reconstructed from a complete 24KB buffer
Optimizing Diagnostic Strategies for Automotive SoC Embedded Memory
The selected population shows an average of about 2000 faults, with a variation of about 5000 faults. Observing the performance of the population sample, the overall time for testing and collecting diagnostic information averages 192ms, with a variation of 279ms. For the bit-by-bit method, these values average 152ms, with a variation of 189ms. Table Four involves the occupancy of bitmap sizes; it shows the percentage of smaller bitmap creation sizes in the surveyed population, comparing the proposed method with the reference method. Considering all devices, the proposed method requires less memory in about 60% of cases. If only failure scenarios with more than 250 faults are considered, the proposed method shows scale advantages in about 91% of cases. Regarding the comparison with [5], the Pearson correlation index was calculated to measure the amount of divergence from the proposed method. With the memory requirement limited to 20KB, [5] can store any fault cluster with relatively low accuracy; on average, the proposed method calculates a correlation index of 61%. Figure 15 shows the comparison between the bitmap reconstructed using the method shown in [5] (A) and the bitmap compressed using the proposed method (B). In this particular case, there are approximately 2000 faults, with a correlation index of 83%.
Optimizing Diagnostic Strategies for Automotive SoC Embedded Memory

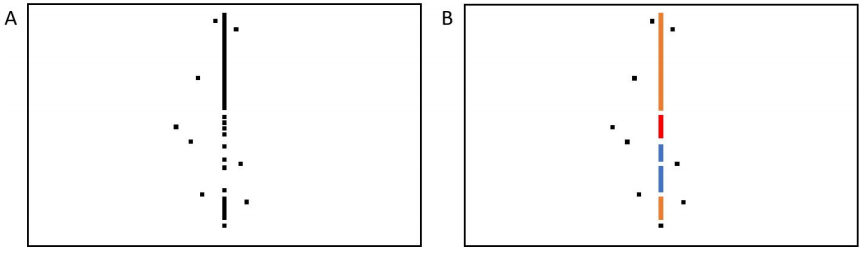
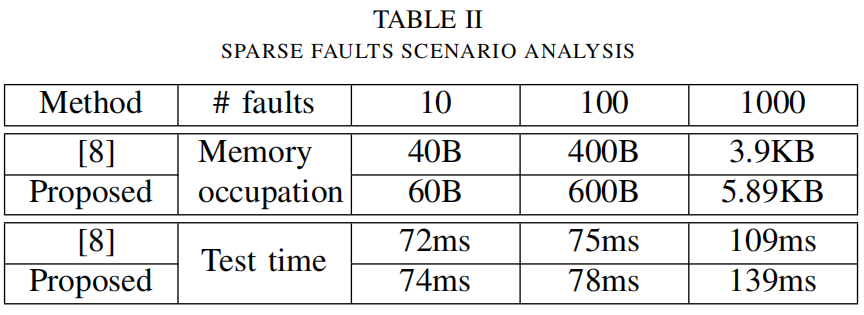
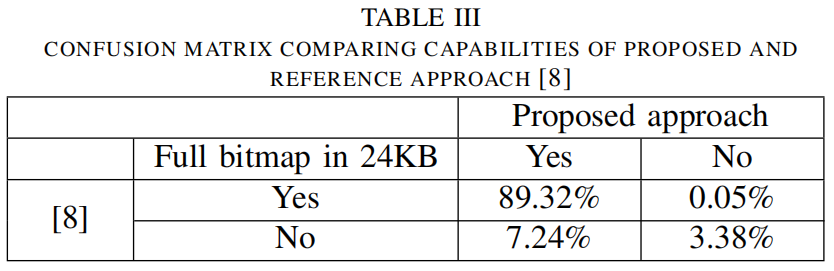
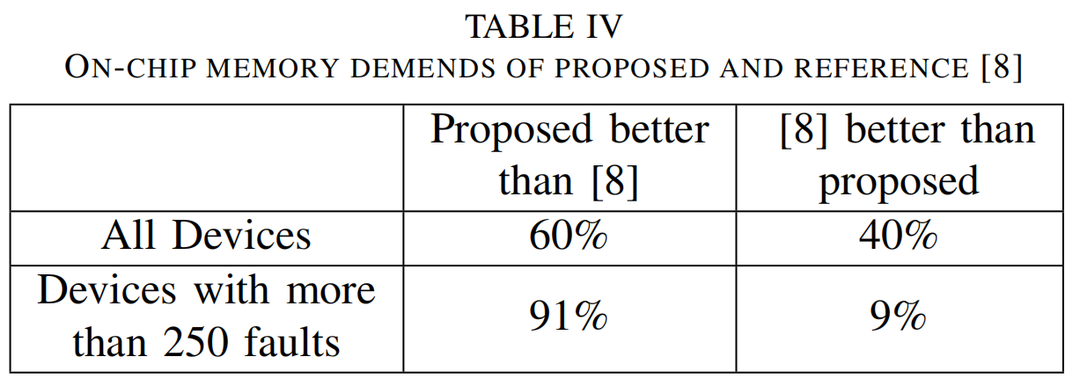
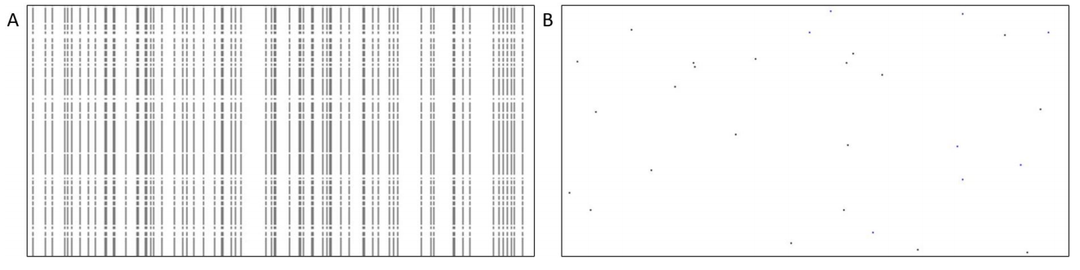
Figure 15. Comparison between the bitmap reconstructed using the method shown in [5] (A) and the bitmap compressed using the proposed method (B)

V. Conclusion

This paper presents an innovative algorithm that improves the collection of diagnostic information in eFLASH testing. Results obtained from real data indicate that the proposed method has advantages in both memory occupancy and speed. By utilizing the developed algorithm, it is possible to permanently store a complete fault history of a device in a smaller memory, providing more details for the analysis of faulty devices regarding the evolution of bitmaps along the testing steps.

References:

[1] A. van de Goor, G. Gaydadjiev, and S. Hamdioui, “Memory testing with a RISC microcontroller” in Proc. on Design, Automation and Test in Europe, Dresden, 2010.

[2] “IEC 61508-[1-16],” Functional safety of electrical/electronic/programmable electronic safety-related systems, 2010.

[3] P. Bernardi et al. “Cumulative embedded memory failure bitmap display

& analysis” in IEEE Symposium on Design and Diagnostics of Electronic Circuits and Systems, 2010.

[4] S. Abhas, M. K. Gurram, and A. Abhijit, “Controller Architecture for

Memory BIST Algorithms” in IEEE International Students’ Conference on Electrical, Electronics and Computer Science (SCEECS), 2020.

[5] J. Chen, J. Khare, K. Walker, S. Shaik, J. Rajsky, and W. Maly, “Test response compression and bitmap encoding for embedded memories in manufacturing process monitoring” in Proceedings International Test Conference 2001.

[6] P. Bernardi et al. “An efficient algorithm for the extraction of compressed diagnostic information from embedded memory cores” in 2003 IEEE Conference on Emerging Technologies and Factory Automation.

[7] I. Schanstra et al. “Semiconductor Manufacturing Process Monitoring using Built-In Self-Test for Embedded Memories” in Proceedings International Test Conference 1998.

[8] A. L. Landzberg and R. Van Nostrand, Microelectronics Manufacturing Diagnostics Handbook, New York, USA, 1993.

[9] H. WonGi, C. JungDai, and C. Hoon, “A programmable memory BIST for embedded memory” in International SoC Design Conference, 2008.

[10] C.-H. Tsai and C.-W. Wu, “Processor-programmable memory BIST for bus-connected embedded memories” in Proc. of the Design Automation Conference, 2001.

[11] P. Bernardi et al., “A Machine Learning-based Approach to Optimize Repair and Increase Yield of Embedded Flash Memories in Automotive Systems-on-Chip” in European Test Symposium, 2019.

END

Sharing is hard, please give a 【👍】 and 【look at】

Leave a Comment

×