Author / Android Studio Product Manager Mayank Jain and Software Engineer Yasser Dbeis
We know that Android developers have always wanted to find tools that can optimize power consumption on different Android devices.
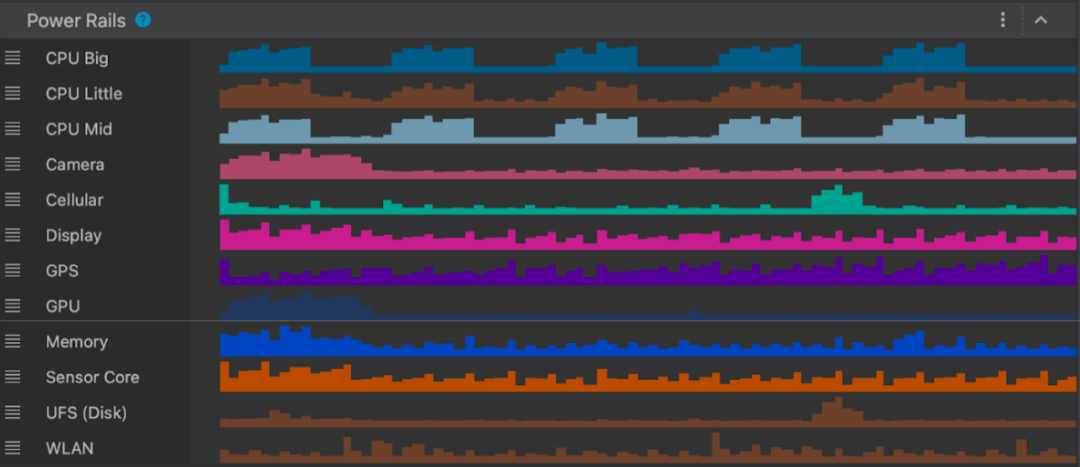
The new Power Profiler in Android Studio displays the power consumption of the device while running the application, thus helping Android developers. Understanding power consumption across various Android devices helps developers identify and address power issues in their applications. You can run A/B testing to compare the power consumption of different algorithms, features, or even different versions of the application.
△ The new Power Profiler in Android Studio
Applications optimized for low power consumption can improve battery and thermal performance of devices, which means that the user experience provided by Android will also improve.
On Pixel 6 and later Pixel devices, the on-device power manager (ODPM) can provide power consumption data, which is categorized by a subsystem called “Power Rails.” For a list of supported subsystems, you can refer to the official website for details about analyzable power rails.
The Power Profiler can help application developers detect the following issues:
-
Detect unoptimized code that exceeds necessary power consumption.
-
Identify background tasks that cause unnecessary CPU usage.
-
Identify wake locks that keep the device awake unnecessarily.
Once power issues are identified, the Power Profiler can test different hypotheses to understand the causes of excessive power consumption in applications. For example, if the issue is caused by background tasks, developers can try to prevent tasks from running or running for long periods unnecessarily. If the issue is caused by wake locks, developers can try to release wake locks when resources are not in use or use them more wisely. Developers can then use the Power Profiler to compare power consumption before and after changes.
This article will demonstrate how A/B testing helps you understand how the power characteristics of your application change with different versions of the same feature and help you effectively measure these changes. Please continue reading for more details.
Real Example: The Power Profiler Can Help You Improve Your Application’s Battery Life
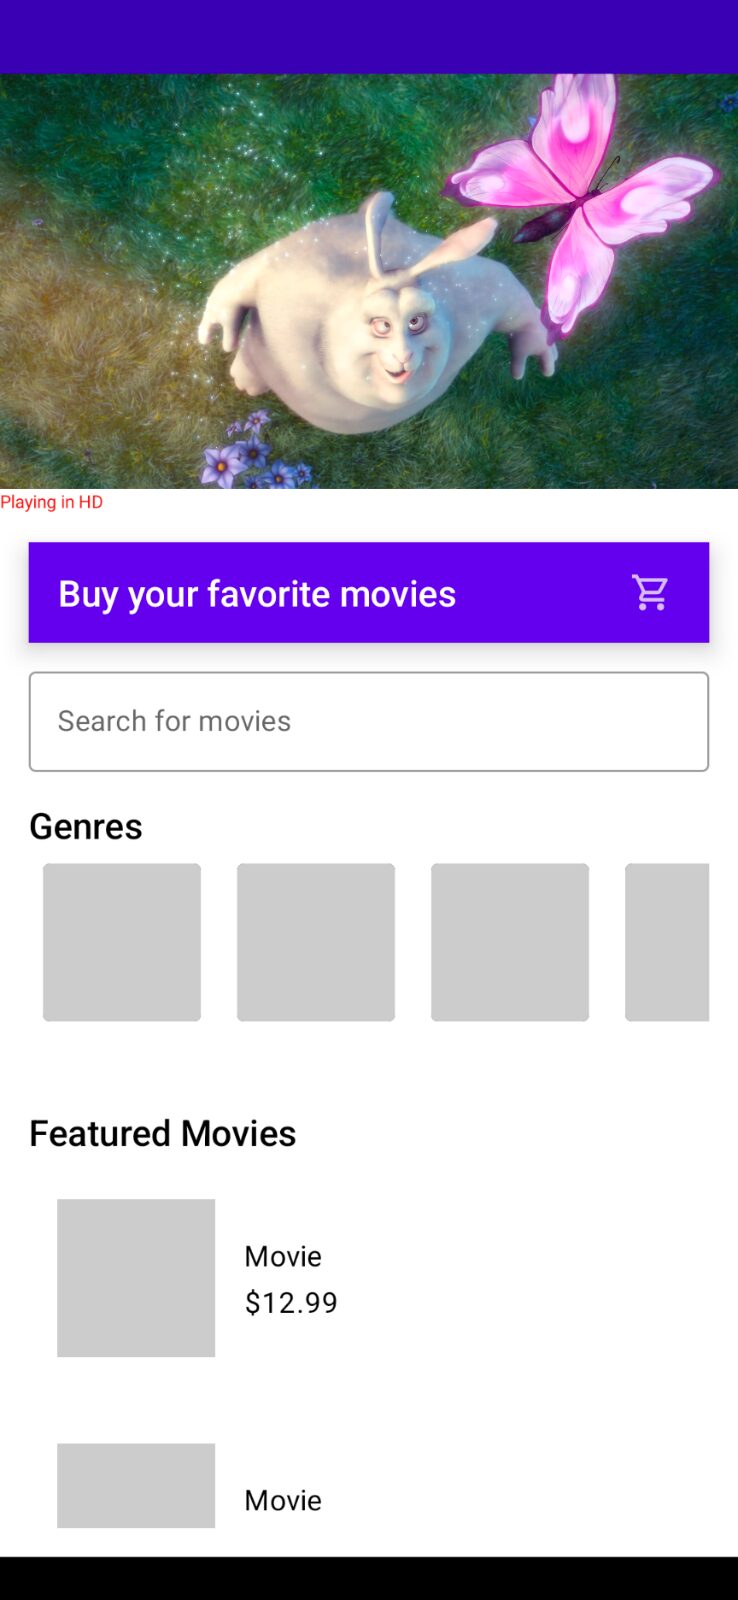
Suppose you have an application that allows users to purchase their favorite movies through the app.
△ Example application for demonstrating power consumption measurement A/B testing
Video (c) © Blender Foundation | www.bigbuckbunny.org
As your application becomes more popular and well-known, you may find that high-quality 4K videos take a long time to load every time the application is launched. Since the video is large, you want to understand the impact of loading that video on device power consumption.
Initially, the video is presented in 4K quality, aimed at showcasing the highlights of the movie to your users in the best quality.
However, if the video loading time is too long, you may consider:
-
Do you really need to display a 4K video on the homepage?
-
Does it make sense to load a 4K video over the network every time the application runs?
-
What changes in power characteristics will occur if you replace the 4K video with a lower quality video (while still maintaining the viewing experience)?
Best Scenarios for A/B Testing Power Consumption
Through A/B testing, you can test two variants of the video feature to select the variant with better power characteristics.
Scenario A: Play a 4K video on the screen while running the application and measure power consumption
Scenario B: Play a lower resolution video on the screen while running the application and measure power consumption
Let’s take some time to set up the Android Studio Performance Profiler for this A/B test. We need to launch the application and attach the CPU Profiler to the application, then trigger the system trace (the Power Profiler will appear here).
Step 1
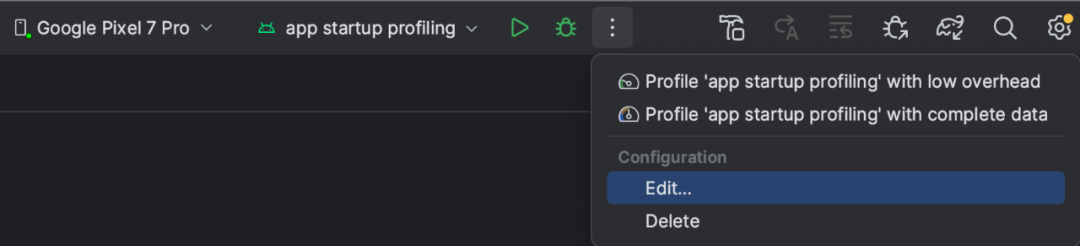
Click the menu > Edit to create a custom “Run configuration” (run configuration)
△ Custom Run Configuration
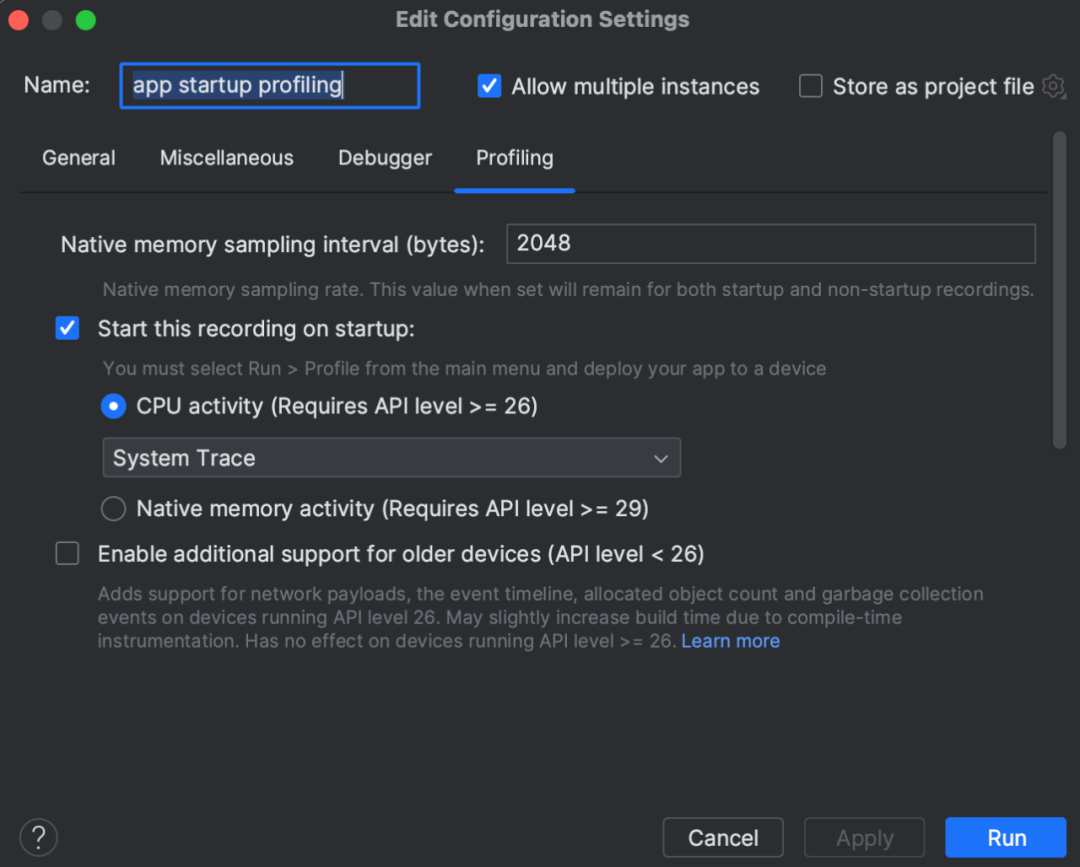
Step 2
Then, select the “Profiling” tab and ensure that “Start this recording on startup” and “CPU Activity” > “System Trace” are selected, then click “Apply”.
△ Edit Configuration Settings
Now, whenever you want to run this application from scratch and attach the CPU Profiler to it, just run “Profile app startup profiling with low overhead”.
Testing Accuracy Considerations
The following example scenarios use the entire application startup process to estimate power consumption for testing purposes. However, you can use more advanced methods to obtain more accurate power readings, such as:
-
Isolate and measure the power consumption of playing the video only after clicking the video player
-
Use the tracing marker API to mark the start and end times of power consumption measurements on the timeline, then measure power consumption only during that marked time period
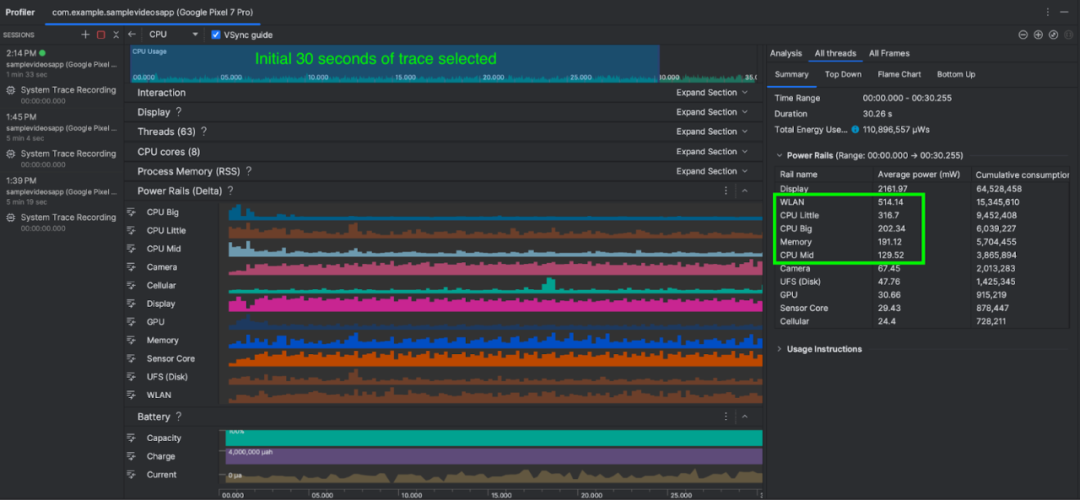
In this scenario, we play a 4K video while running the application and measure power consumption for the first 30 seconds. We can also choose to run Scenario A multiple times and take the average. After the system trace markers are displayed in Android Studio, select the time range of 0 – 30 seconds in the timeline selection panel and take a screenshot for comparison with Scenario B.
△ Power Consumption in Scenario A (Playing 4K Video)
As you can see, the average total power consumption for WLAN, CPU cores, and memory is approximately 1,352 mW (milliwatts). Now, let’s compare this with the power consumption in Scenario B to see what changes occur
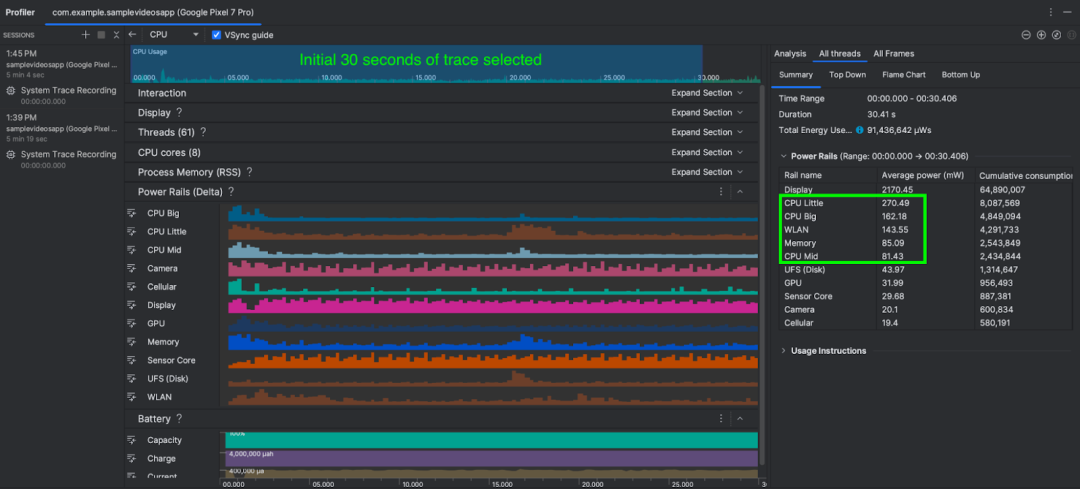
In this scenario, we play a lower resolution video while running the application and measure power consumption for the first 30 seconds. As before, we can also choose to run Scenario B multiple times and take the average power consumption. Similarly, after the system trace markers are displayed in Android Studio, select the time range of 0 – 30 seconds in the timeline selection panel.
△ Power Consumption in Scenario B (Playing Lower Quality Video)
The total power consumption for WLAN, CPU Little, CPU Big, CPU Mid, and memory is approximately 741 mW (milliwatts).
Under the same conditions, the power consumption of Scenario B (using lower quality video) is 741 mW, while the power consumption of Scenario A (using 4K video) is 1,352 mW.
Scenario B (lower quality video) consumes 45% less power than Scenario A (4K video), and the visual experience of the lower quality video on the application is almost indistinguishable from that of the 4K video.
By conducting A/B testing on power consumption, you will find that replacing the 4K video on the application’s homepage with a lower quality video not only reduces power consumption by 45%, but also decreases the required network bandwidth, while potentially improving device thermal performance.
If your application’s business logic still requires displaying 4K video on the application screen, you can also explore the following strategies:
-
Cache 4K videos for subsequent runs of the application.
-
Load the video only when the user clicks.
-
Initially load an image and load the video only after the screen is fully rendered (deferred video loading).
The total power consumption numbers provided in the A/B testing scenarios above may seem small, but we have demonstrated a method and thought process to help application developers effectively conduct A/B testing on the power consumption of their application features using the Power Profiler in Android Studio.
The new Power Profiler will be available in Android Studio Hedgehog and later versions. You can refer to the official documentation for more information. Stay tuned to the “Android Developers” WeChat account for timely updates on development technology and product updates.
If the page does not load, please refresh and try again
 Click the screen to end | Read the original text | Get more development information and technology updates now