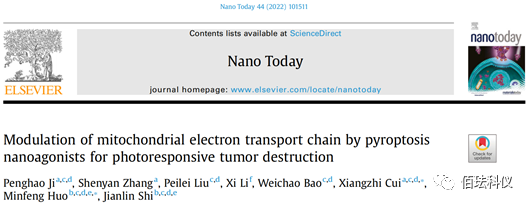
Figure1. a, Schematic: OA@IR820 nanoagonist. b, Schematic: OA@IR820 nanoagonist inducing pyroptosis in cancer treatment. LDH: Lactate dehydrogenase; ASC: Apoptosis-associated speck-like protein containing a CARD; GSDMD: Gasdermin D; NLRP3: NLR family pyrin domain containing 3; ROS: Reactive oxygen species; Cyto C: Cytochrome C; IL1β: Interleukin 1 beta.
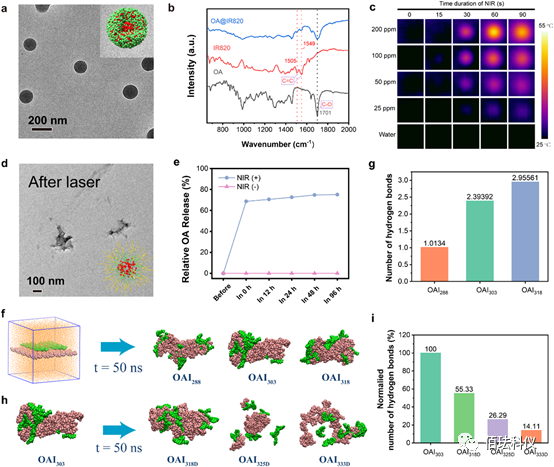
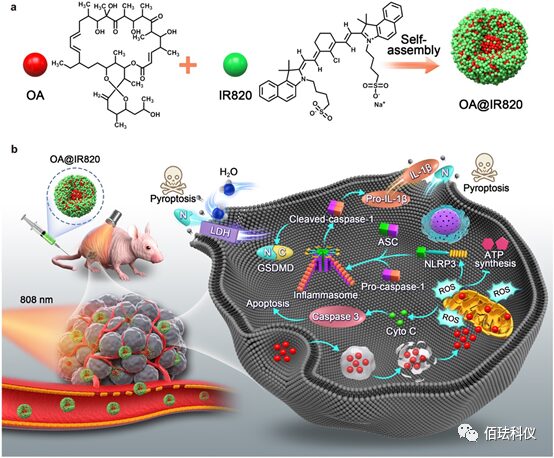
Figure1. Synthesis and characterization of OA@IR820 nanoagonist. a、OA@IR820 nanoagonist TEM image. Inset: Schematic of OA@IR820 nanoagonist. b、FTIR patterns of OA@IR820, IR820, and OA. c、OA@IR820 under infrared thermography 808nm NIR irradiation (1.5W/cm2) in solutions of different concentrations. d、OA@IR820 TEM image after 808nm laser irradiation (0.8W/cm2, t=90s). e、Release of OA from OA@IR820 under high temperature induction, comparing with or without NIR irradiation. f、Top cluster images obtained from all-atom molecular dynamics simulations of the OA-IR820 assembly system at 288K (OAI288), 303K (OAI303), and 318K (OAI318). IR820 and OA molecules are represented as green and orange spheres, respectively. g、Calculated averages of hydrogen bonds in OA-IR820 over simulated trajectories at different assembly temperatures. h、Molecular dynamics simulation image of OA-IR820 assembly system at 303K, decomposing at 318K (OAI318D), 325K (OAI325D), and 333K (OAI 333D). i、Calculated averages of hydrogen bonds during the decomposition process of OA-IR820 at different temperatures.
Figure2. Evaluation of cytotoxicity and pyroptosis of OA@IR820 nanoagonist in vitro. a、Schematic of pyroptosis induced by OA@IR820 nanoagonist. b、Optical microscopic images of B16 cells co-cultured with OA at different time points. White arrows indicate bubbles released into the culture medium, blue arrows indicate cell lysis releasing cellular contents. c-d、Cell viability of B16 cells (c) and LDH release (d) treated with NIR, IR820, IR820+NIR, OA, OA@IR820, and OA@IR820+NIR for 24 hours. Data are presented as mean ± standard deviation. Significance was assessed by Student’s t-test compared to control, *P<0.05, **P<0.01, ***P<0.001, ****P<0.0001, n.s. indicates no significance compared to the control group. e、 Flow cytometry analysis of B16 cells after different treatments using Annexin V-FITC and PI double staining: grouped as untreated, IR820, and OA@IR820, with or without NIR irradiation. f、 Bio-TEM images of B16 cells after co-culture with OA@IR820+NIR compared to the control group. Yellow arrows indicate mitochondria, red arrows indicate engulfed OA@IR820 nanoagonist. “N” represents the nucleus.
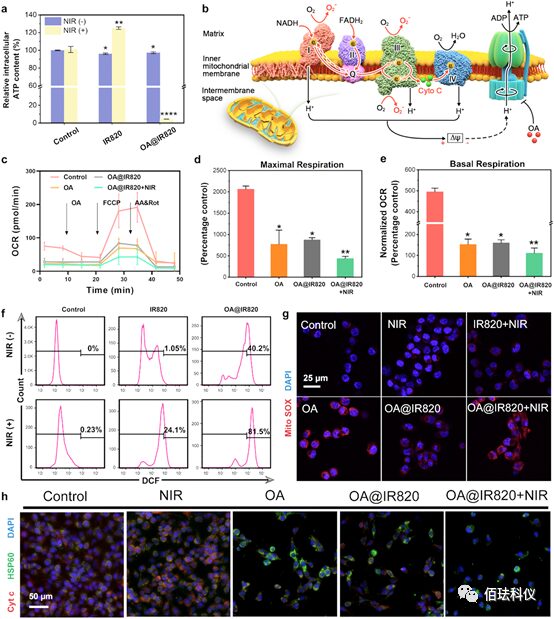
Figure3. Evaluation of mitochondrial damage of OA@IR820 nanoagonist in vitro. a、Relative intracellular ATP levels in B16 cells after treatment with different concentrations of IR820, OA@IR820, IR820+NIR, and OA@IR820+NIR. Data are presented as mean ± standard deviation. Significance was assessed by Student’s t-test compared to control, *P<0.05, **P<0.01. b、 Schematic diagram of the electron transport chain showing the generation of superoxide anions and the inhibitory effect of OA on ATP synthesis. Red arrows show forward electron flow; red dashed arrows indicate reverse electron flow; Q represents coenzyme Q; Cyt represents cytochrome c. c、 Measurement of oxygen consumption rate (OCR) in B16 cells after treatment, grouped as control, OA, OA@IR820, and OA@IR820+NIR after 12 hours. d-e、 Maximum respiration (d) and basal respiration (e) of B16 cells treated for 12 hours in control, OA, OA@IR820, and OA@IR820+NIR groups. Data are presented as mean ± standard deviation. Significance was assessed by Student’s t-test compared to control, *P<0.05, **P<0.01. f、 Flow cytometry analysis of intracellular ROS levels after treatments (cells stained with DCFH-DA). g、 Confocal microscopic images of B16 cells stained with MitoSOX Red after different treatments: untreated, NIR, IR820+NIR, OA, OA@IR820, and OA@IR820+NIR to detect mitochondrial superoxide anions. h、 Confocal microscopic images of B16 cells stained with HSP60 antibody (green fluorescence) and cytochrome c antibody (red fluorescence) after different treatments.
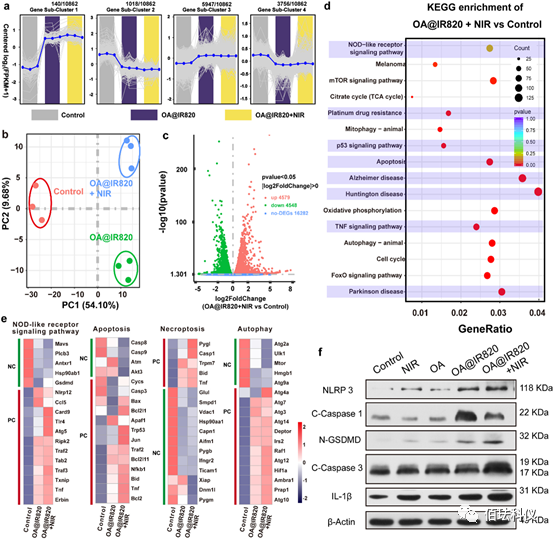
Figure4. PC1 and PC2 represent the largest sources of variation, accounting for a total of 63.78% of the variation. Transcriptomic and proteomic analysis in vitro. a、Gene clustering of differentially expressed genes (DEG) in the transcriptome of B16 cells treated with control, OA@IR820, and OA@IR820+NIR. b、Principal component analysis of 21723 DEG in the transcriptome of B16 cells treated with control, OA@IR820, and OA@IR820+NIR. Points represent cell samples from designated treatments. c、 Volcano plot of DEG in the transcriptome of B16 cells in control and OA@IR820+NIR groups. d、Bubble chart of KEGG enrichment analysis, comparing OA@IR820+NIR treatment group with the control group. e、Heatmap distribution of specific DEG involved in NOD-like receptor signaling pathways, apoptosis, necrosis, and autophagy in control cells, comparing OA@IR820 group and OA@IR820+NIR group. “PC” is an abbreviation for positive correlation, indicating that the expression of these genes activates the corresponding cell death pathways. “NC” is an abbreviation for negative correlation, indicating that the expression of these genes hinders the corresponding cell death pathways. f、 Protein expressions of NLRP3, cleaved caspase-1, N-GSDMD, cleaved caspase-3, and IL-1β in cells treated in designated ways.
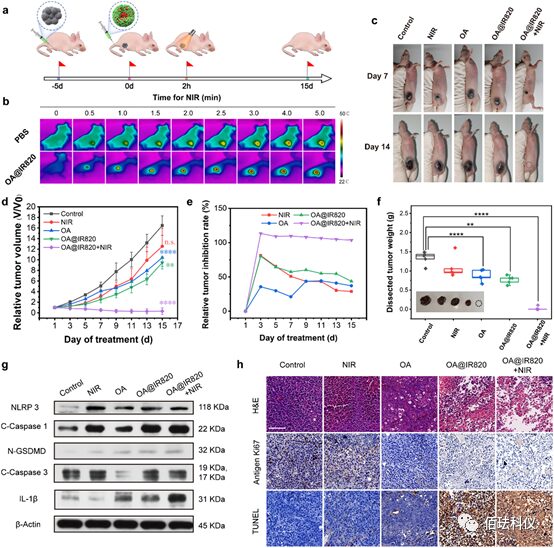
Figure5. The in vivo therapeutic effects of OA@IR820 nanoagonist against melanoma. a、Schematic of tumor inoculation and treatment design in this study. b、Infrared thermal imaging of B16 xenograft nude mice injected with PBS or OA@IR820 under 808nm laser irradiation (0.8W/cm2) for 5 minutes. c、Digital photos of B16 xenograft nude mice collected on day 7 and day 15 after treatment. d-e、Relative tumor volume curves (d) and relative tumor inhibition rates (e) of each group of mice (n=5) after 15 days of assessment. f、Weights of tumors dissected from each group of mice. Insets are digital photos of tumors dissected from each group of mice after treatment. Data are presented as mean ± standard deviation. Significance was assessed by Student’s t-test compared to control, *P<0.05, **P<0.01, ***P<0.001, ****P<0.0001 compared with the control group. n.s. indicates no significance compared to the control group. g、 Western blotting results of NLRP3, cleaved caspase-1, N-GSDMD, cleaved caspase-3, and IL-1β from dissected tumors of mice from different treatment groups. h、 Histopathological images of dissected B16 tumor xenografts, analyzed with H&E, antigen Ki-67, and TUNEL staining. Scale bar: 100µm.
Paper link:
https://doi.org/10.1016/j.nantod.2022.101511
Nanolive has the following features:
1. Label-free imaging solution for live cells
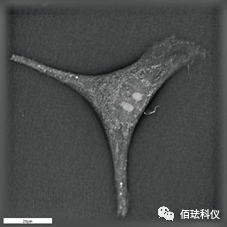
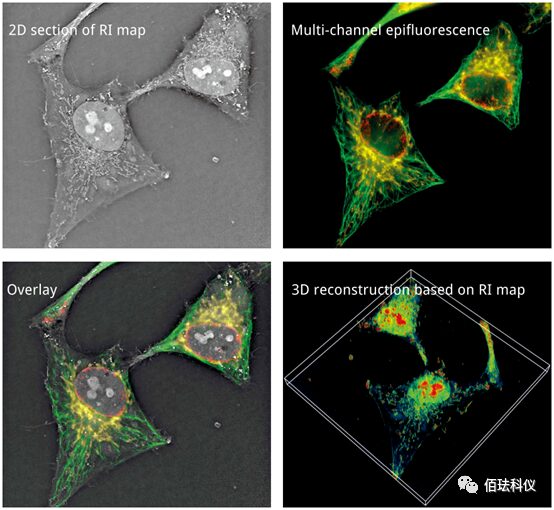
2. Software for 3D image acquisition and digital staining
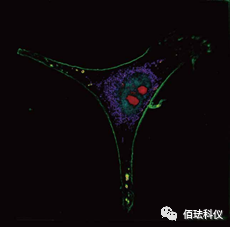
3. Software for cell function analysis

(Label-free dynamic analysis of subcellular structures – mitochondria + liposomes)
(Label-free dynamic analysis of cytoskeleton)
Nanolive real-time label-free 3D microscope series imaging system, as a newly developed technology in recent years, has been applied in several fields and is continuously expanding:
1. Observation and analysis of microbial infection in cells
2. Observation and analysis of cell cycle
3. Analysis of drug action mechanisms
4. Research on yeast cell division
5. 3D cell culture
6. Research on autophagy
7. Research on the development of nanomaterials
8. Observation of subcellular localization
9. Analysis of GFP or RFP transfection
10. H&E and HF detection without staining
11. Botanical research
12. Analysis of intercellular interactions
13. Research on apoptosis and death mechanisms
14. Molecular co-localization analysis
15. Non-invasive identification of CTC cells
16. Tracking of microvesicles
17. Environmental biology