The following is a detailed installation and usage tutorial for Modbus Poll v4.3, Modbus Slave v4.3, and the virtual serial port driver, including actionable specific steps:
1. Software Download and Installation
1. Virtual Serial Port Driver (VSPD 6.9)
Download link:https://gitee.com/ylm1101111/vspd_6.9.git
Installation steps:
1)Runvspdconfig.exe installation package.
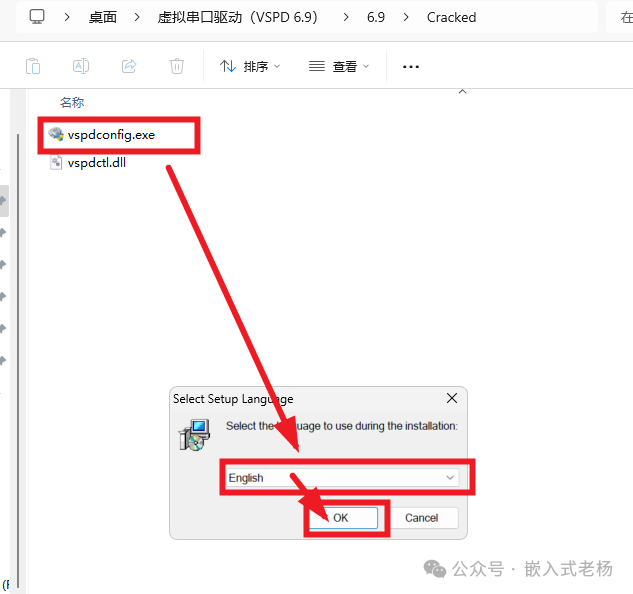
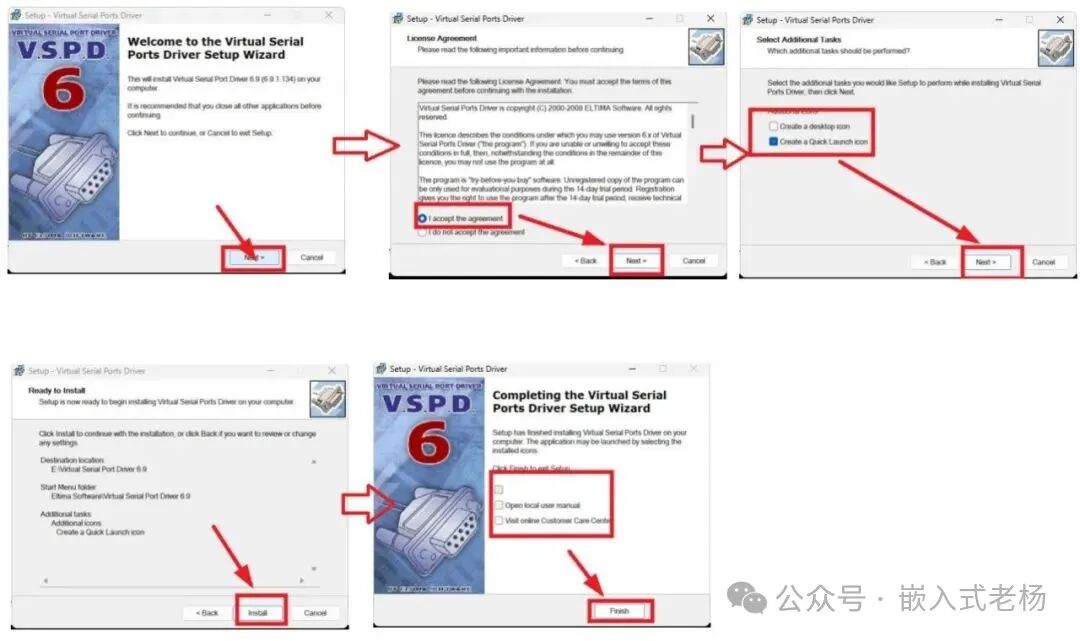
2)Click “Next” until the installation is complete.
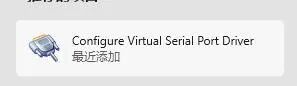
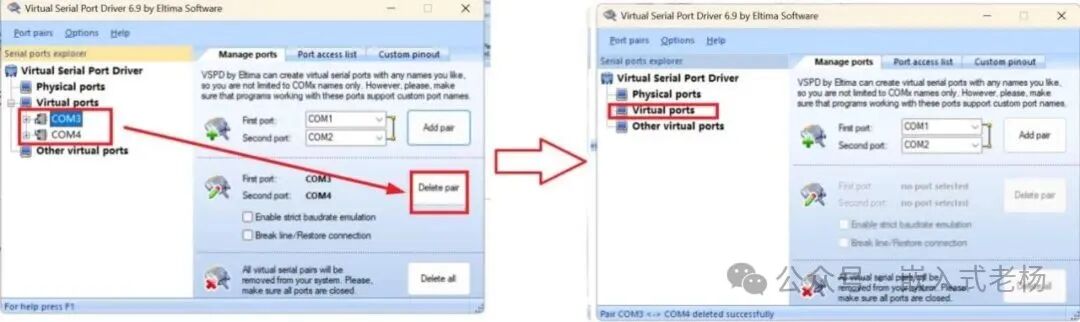
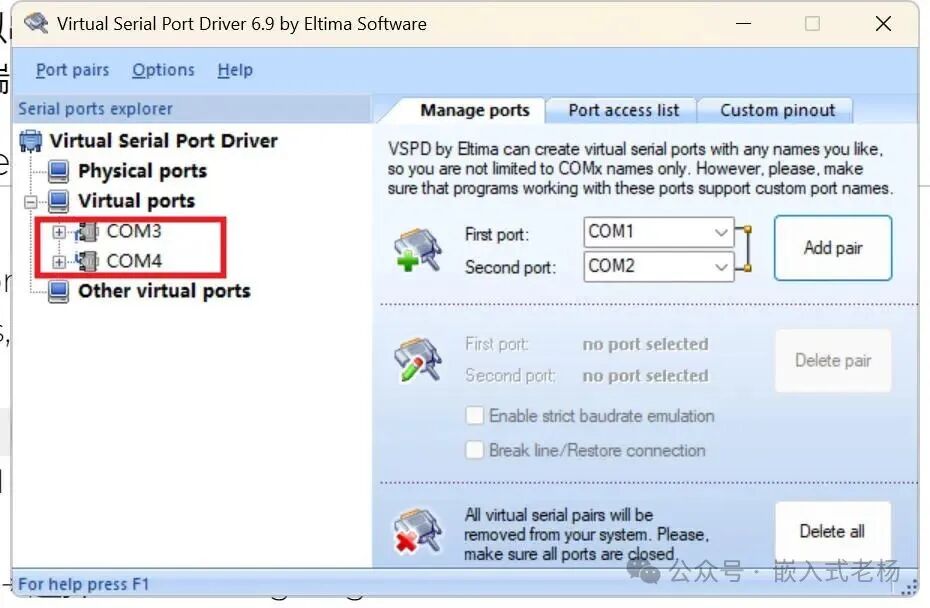
3)Open the software → Click “Add pair” to create a virtual serial port (choose according to the COM port usage in Device Manager, e.g., COM3↔COM4, make sure to select an unused COM port).
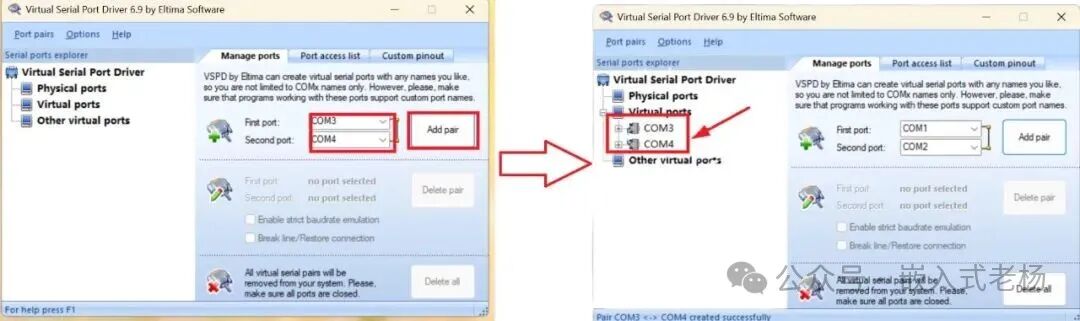
4)After use, click “Delete pair” to remove the virtual serial port (e.g., COM3↔COM4).
2. Modbus Poll & Slave v4.3
Download link:
https://gitee.com/ylm1101111/modbus-upper-computer.git
Installation steps for Modbus Poll:
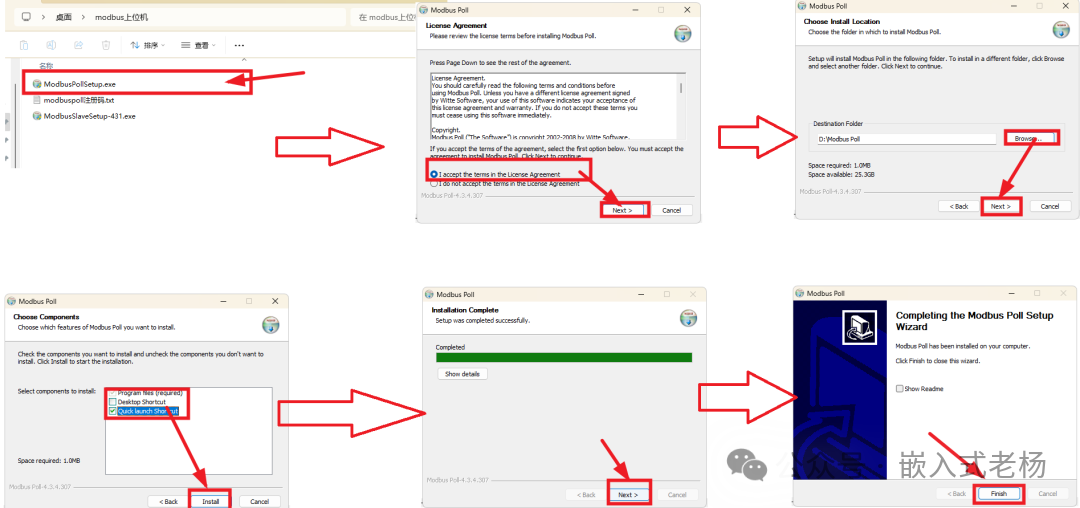
1)Double-click the installation package → Default settings → Complete installation
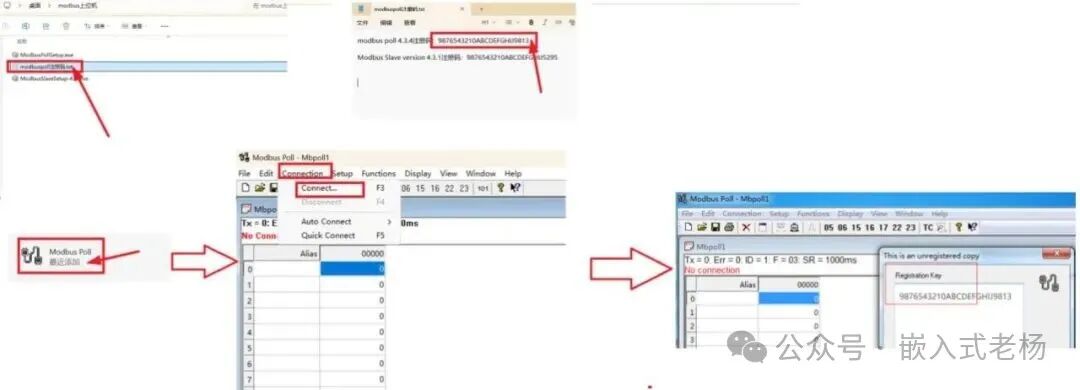
2)Crack it, click Connection->Connect, a registration window will pop up, fill in the Modbus Poll registration code..
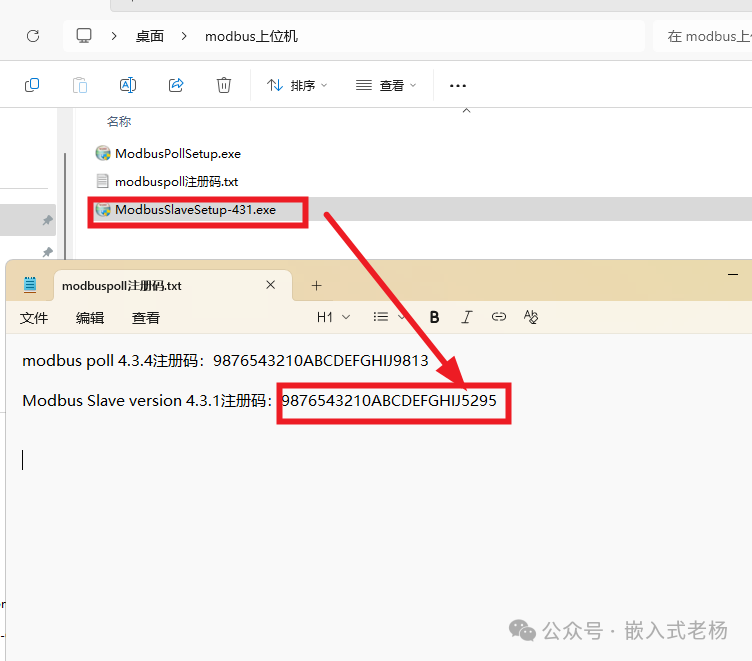
Installation steps for Modbus Slave: The installation steps are the same as Modbus Poll. Choose to install ModbusSlaveSetup-431.exe, and use the registration code for Modbus Slave version 4.3.1.
2. Basic Configuration (Taking RTU Mode as an Example)
Step 1: Establish a Virtual Communication Link
1)Open VSPD → Add virtual serial port pair (e.g., COM3/COM4).
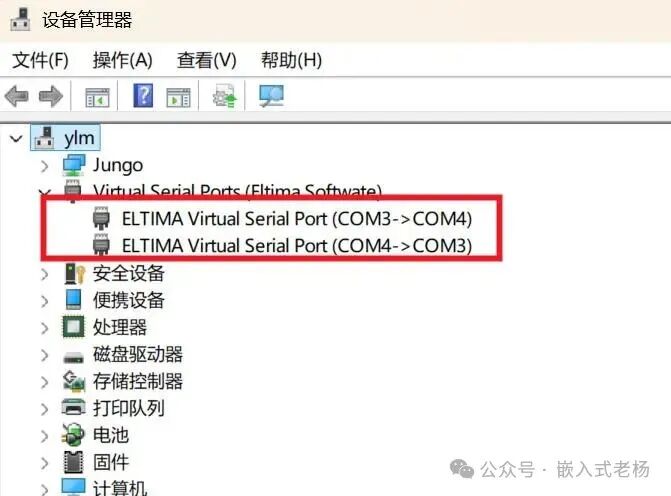
2)Open Device Manager to confirm the port exists.
Step 2: Modbus Slave Configuration (Simulating Slave)
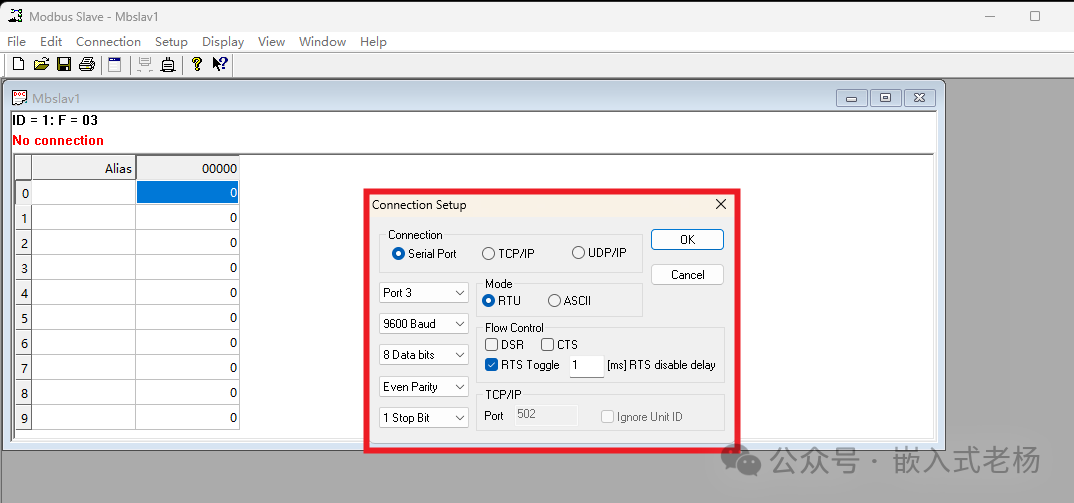
1)Open Modbus Slave → Connection → Connect
lSelect: Serial Port → COM3 (matching one end of VSPD).
lParameters: 9600bps, 8N1, RTU mode.
lConfiguration complete, click OK.
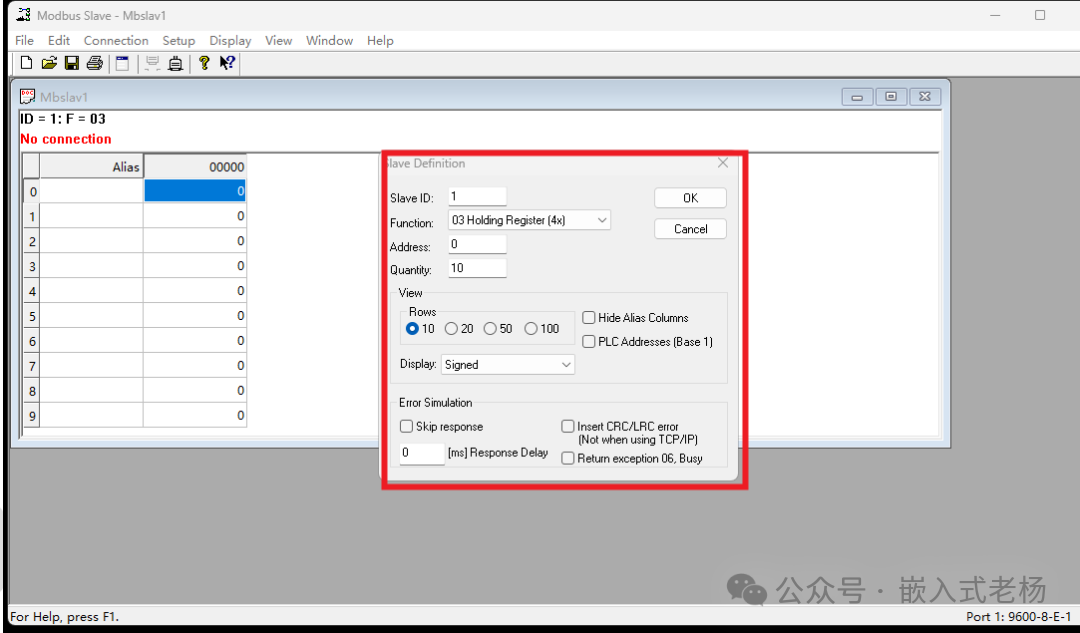
2)Set the slave address:
lSetup → Slave Definition.
lSet Slave ID = 1.
3)Set read/write parameters:
lSelect function “03 Holding Registers”.
lManually input starting address and number of registers.
lConfiguration complete, click OK.
Step 3: Modbus Poll Configuration (Master)
1)Open Modbus Poll → Connection → Connect
lSelect: Serial Port → COM4 (the other end of VSPD).
lParameters consistent with the slave (9600bps, 8N1).
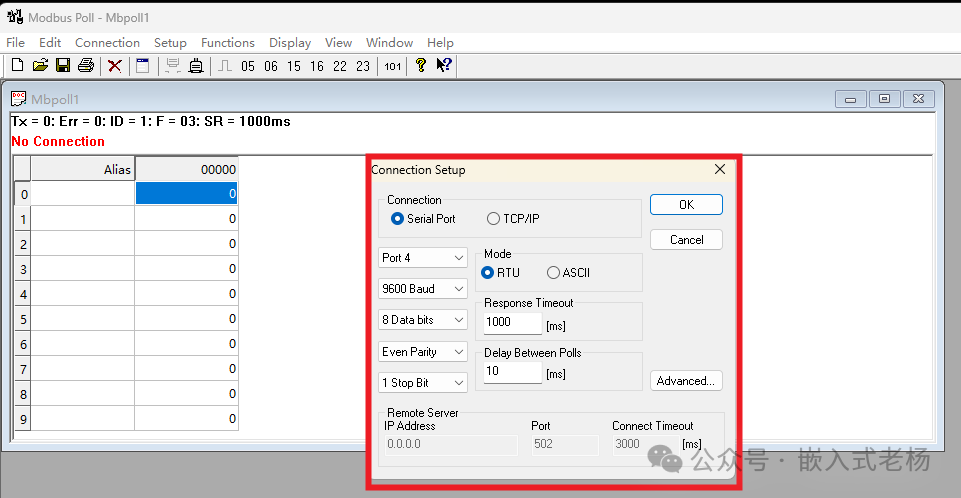
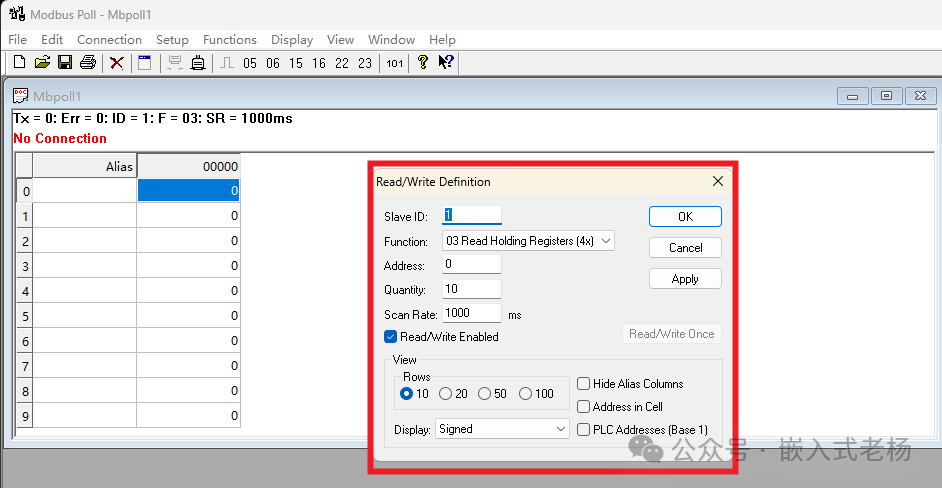
2)Set read/write parameters:
lSetup → Read/Write Definition.
lManually input starting address and number of registers.
lConfiguration complete, click OK.
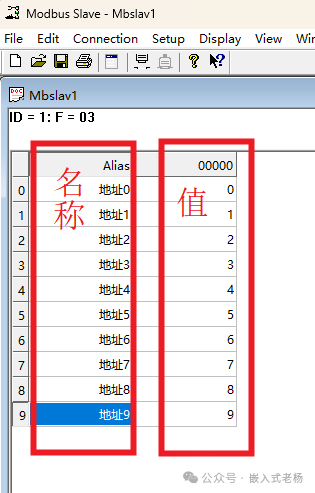
3)Manually set the value of the registers.
In Modbus Slave, you can manually set the register names and values. (The values of registers in function 03 are 2 bytes).

3. Communication Verification
After completing the above steps, communication verification can be performed on the Modbus Poll and Modbus Slave interfaces.
lIn Modbus Poll, display→Communication opens the data monitoring interface.
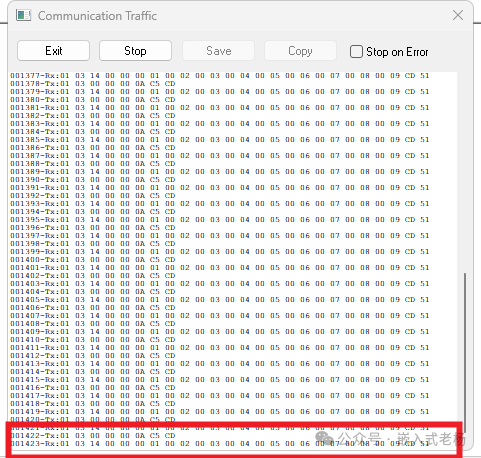
lIn Modbus Slave, display→Communication opens the data monitoring interface.
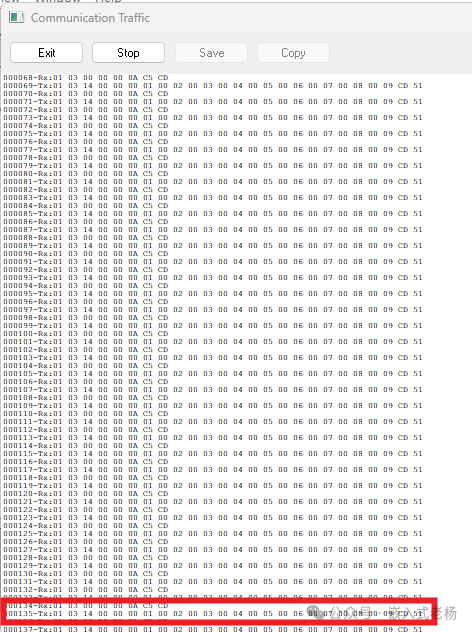
lDuring normal communication:
Modbus Poll as the master, Modbus Slave as the slave, Tx is the command sent by the master, Rx is the command returned by the slave.
4. Introduction to Modbus Poll/Slave Toolbar
|
Primary Menu |
Secondary / Sub Options |
Function Description |
Operation Scenario Example |
|
Connection |
Connect |
Open the connection configuration window, supports: – Serial port (COM, baud rate, parity) – Ethernet (TCP/IP address, port) – Connection mode (RTU/ASCII/TCP) |
Switch serial ports (COM3→COM4) to test different physical links |
|
Disconnect |
Disconnect the current master-slave connection, stop data exchange |
Disconnect when changing slave devices |
|
|
Connection Log |
Display communication message log: – Tx/Rx raw bytes (can be exported as.log) – Error code analysis (timeout, CRC check failure) |
Diagnose communication faults like “Err=124” |
|
|
Setup |
Read/Write Definition |
Configure read/write parameters: – Slave ID – Function code (03 read holding registers, 06 write single register, etc.) – Starting address, register quantity |
Test slave “03 function code read registers 100-109” |
|
Data Format |
Set register display format: – Value type (decimal, hexadecimal, floating point) – Byte order (big-endian / little-endian) |
Parse floating-point (32-bit) register values from the slave |
|
|
Trigger |
Configure data update trigger: – Timed trigger (automatically poll every 1000ms) – Manual trigger (click “Refresh” button to update) |
High-frequency acquisition (100ms) or low-power (manual trigger) scenarios |
|
|
Alias List |
Set aliases for register addresses (e.g., “Temperature Register = 40001”) |
Simplify tables, directly display “Temperature = 25℃” |
|
|
Functions |
01 Read Coils (Example) |
Manually execute function code operations (read coils, write registers, etc.), covering: – 01 (read coils), 02 (read discrete inputs) – 03 (read holding registers), 04 (read input registers) – 05 (write single coil), 06 (write single register) – 15 (write multiple coils), 16 (write multiple registers) |
Quickly verify if the slave supports “06 function code write register” |
|
Display |
Refresh |
Manually trigger register data update (overrides Trigger settings) |
Force pull the latest value during urgent debugging |
|
Toggle Hex/Dec |
Switch register display format (decimal↔hexadecimal) |
View encrypted / raw register values |
|
|
Auto Scroll |
Automatically scroll the table to the latest row when data updates |
Automatically track when monitoring continuous addresses (e.g., 100-200) |
|
|
Status Bar |
Show / hide the bottom status bar (connection status, message statistics) |
Simplify the interface or focus on status information |
|
|
View |
Toolbar |
Show / hide the top toolbar (shortcut buttons) |
Hide the toolbar to enlarge the table during large screen operations |
|
Status Bar |
Same as Display→Status Bar, control the visibility of the status bar |
|
|
|
Communication Traffic |
Pop up real-time message window, displaying: – Sent (Tx) / Received (Rx) byte stream – Timestamp, Slave ID, Function Code |
Analyze underlying issues like “CRC error” and “response timeout” |