Before learning how to use an oscilloscope to reduce noise, let’s first understand how noise in oscilloscopes arises.
Many people who have just transitioned from analog oscilloscopes to digital oscilloscopes may complain that the waveforms measured by their new oscilloscope are not as clear as those from their old analog oscilloscope, even doubting whether their purchased oscilloscope is defective. So, is the oscilloscope really broken?
It is important to know that the purpose of an oscilloscope is to restore the true signal. The higher the performance of the oscilloscope, the more details of the signal can be observed, and these details are often key to identifying abnormal issues. In practical use, interference from the surrounding environment is a real factor, and noise cannot be completely eliminated. In fact, the higher the bandwidth of the oscilloscope, the more noise signals will be captured. Low-performance oscilloscopes have very low sensitivity, and while they may ignore some interference, they also miss out on a lot of useful information from the signal itself, making effective and accurate analysis impossible.
Many factors can affect the display of waveforms on an oscilloscope. The signal we see is certainly not a 100% complete true signal, and it is related to various factors such as the type of probe used, the measurement method, grounding, and various oscilloscope settings, such as vertical scale settings, storage depth, real-time sampling rate, sampling method, bandwidth of the oscilloscope, and display modes (e.g., persistence display), etc.
As the oscilloscope’s ability to capture signals approaches reality, noise interference is more likely to appear on the screen. So are we helpless against this noise? Certainly not! The new generation of high-performance oscilloscopes offers a variety of processing methods for signals. Let’s explore them one by one:
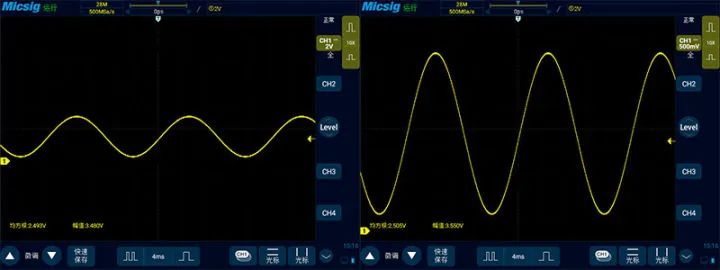
Many oscilloscope users may have a “bad habit” of adjusting the vertical scale to reduce the display of multiple signals to avoid overlapping, which affects observation. In reality, due to factors like vertical resolution, the more the waveform fills the screen, the more accurate it is, and it can also reduce noise signals. Additionally, the DC gain accuracy indicated by oscilloscope manufacturers (usually 1-2%) refers to the accuracy when the waveform fills the screen.
It can be seen that even under the same conditions, different vertical scale settings yield different values. The more the waveform fills the screen, the more precise the measured value.
The input of a 1X passive probe has no attenuation, and its input impedance is negligible. Together with the oscilloscope’s internal 1MΩ, the total input impedance is 1MΩ. A 10X high-impedance passive probe typically has an input impedance of 9MΩ, and the internal input impedance of the oscilloscope is 1MΩ, making the total input impedance 10MΩ. For a 10X probe, the signal from the test point to the oscilloscope’s sampling point experiences a 10-fold attenuation, meaning the voltage amplitude sampled by the oscilloscope is 1/10 of the actual measured voltage amplitude. Different attenuation ratios of probes have different measurement ranges.
When the recording duration of the waveform is fixed, the sampling rate and storage depth have a linear relationship: sampling rate = storage depth ÷ waveform recording duration.
The sampling rate determines the oscilloscope’s ability to capture signals, while the storage depth determines how much signal data can be stored on one screen. It can be imagined that if the storage depth is too low, most signal information cannot be displayed, resulting in severe distortion of the waveform, making precision unattainable.
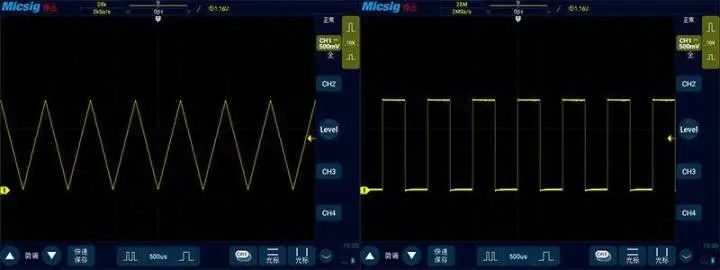
For example, when testing a square wave signal with all other conditions the same, but changing only the storage depth, one can see that with a storage depth of 28K, the real-time sampling rate is 2KSa/s, and the original square wave has turned into a sawtooth wave, with the waveform distorted and precision lost. According to the Nyquist sampling theorem, the real-time sampling rate is also related to the frequency of the measured signal. When the storage depth is set to 28M, the real-time sampling rate is 2MSa/s, and the square wave remains a square wave.
As mentioned earlier, the same signal may appear “cleaner” on an analog oscilloscope, partly because of the lower bandwidth of the analog oscilloscope, which fails to capture many high-frequency noises. However, this does not mean that these noise signals do not exist in reality. Similarly, digital oscilloscopes can also achieve noise reduction through high and low pass bandwidth limiting functions.
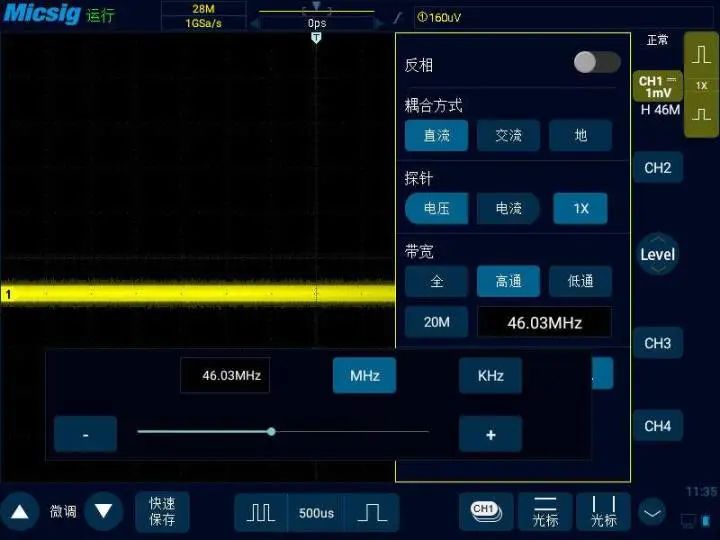
The most commonly used setting should be “20M”, which is a low-pass of 20M, allowing only signals below 20MHz to pass, effectively attenuating signals above 20MHz. This is particularly effective against high-frequency noise.
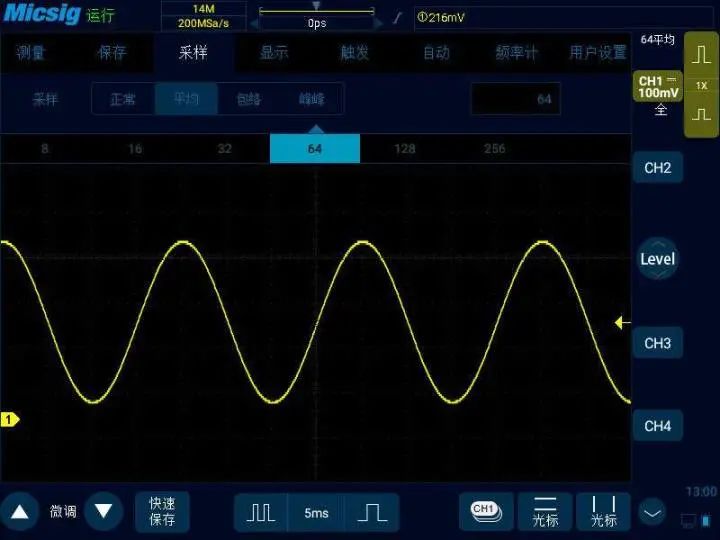
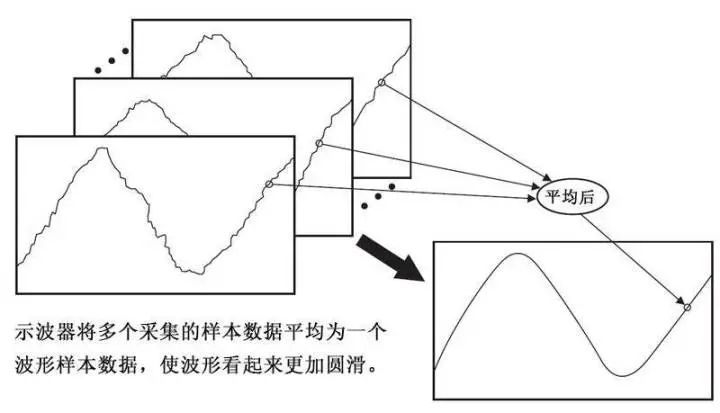
Using averaging sampling mode can average multiple acquisition results to reduce random or irrelevant noise in the displayed signal. The number of averages can be set in the selection box after the averaging sampling mode, with options of 2, 4, 8, 16, 32, 64, 128, and 256. The higher the averaging number, the slower the response of the displayed waveform to waveform changes. A balance must be struck between the speed of response to waveform changes and the degree of noise reduction in the displayed signal.