
Click the blue text above to follow us



Gift to readers

👨💻 Conducting research involves a profound system of thought, requiring researchers to be logical, meticulous, and serious. However, effort alone is not enough; often leveraging resources is more important than hard work. Additionally, one must have innovative and inspirational points of view. When a philosophy teacher asks you what science is or what electricity is, do not find these questions amusing. Philosophy is the mother of science; it seeks to address ultimate questions and find those self-evident questions that only children would ask but you cannot answer. It is recommended that readers browse in order to avoid suddenly falling into a dark maze and losing their way back. This may not reveal all the answers to your questions, but if it can raise clouds of doubt in your mind, it may create a beautiful sunset. If it brings you a storm in your spiritual world, take the opportunity to brush off the dust that has settled on your ‘lying flat’ state. Perhaps, after the rain, the sky will be clearer…🔎🔎🔎

1 Overview
Wind Energy Resource Assessment Data Analysis
Utilizing wind energy for power generation is a potential solution to meet local energy market demands. This article analyzes wind data measured at a meteorological observation tower in Massachusetts, USA. The tower is equipped with two sets of wind speed sensors at a height of 49 meters, two sets at a height of 38 meters, and one set at a height of 20 meters.
Additionally, wind direction sensors are installed at heights of 49 meters, 38 meters, and 20 meters. Temperature is recorded by a single sensor located at a height of 2 meters. From May 25, 2007, at 11:00 AM to June 10, 2008, at 4:50 PM, the average values, standard deviations, minimums, and maximums of each sensor were recorded every ten minutes.
Wind Energy Resource Assessment: Deepening Insights into Wind Data to Drive Green Energy Solutions
In the face of growing local energy demands, developing and utilizing wind energy as a clean energy source has become an important strategic option. This study delves into a series of valuable wind data collected at a meteorological observation site in Massachusetts, USA, which, due to its carefully configured sensor network, provides us with a profound understanding of wind conditions. Specifically, the observation tower is equipped with four wind speed sensors, strategically placed with two at heights of 49 meters and 38 meters, and one at a lower height of 20 meters, to capture wind speed variation trends at different heights. Furthermore, the deployment of three wind direction sensors (at 49 meters, 38 meters, and 20 meters) ensures precise monitoring of wind direction changes, which is crucial for assessing the optimal layout of wind energy capture devices.
In addition to the precise monitoring of wind speed and direction, the site is also equipped with a temperature monitoring system, with a temperature sensor installed at a height of 2 meters above ground to record changes in ambient temperature, providing critical data for understanding the interaction between wind energy resources and climate conditions. Importantly, this detailed data recording has been conducted from 11:00 AM on May 25, 2007, to 4:50 PM on June 10, 2008, systematically recording the average wind speed, standard deviation of wind speed, and extreme values (minimum and maximum) of each sensor every ten minutes over a span of more than a year. This high-frequency, comprehensive data collection not only reveals the seasonal and daily variation characteristics of wind energy at a specific geographical location but also provides a solid data foundation for assessing the stability and potential energy output of wind energy resources, further guiding the site selection, design, and optimization of wind power projects, and promoting the transition to green energy.
Wind Energy Resource Assessment Data Analysis
Utilizing wind energy for power generation is a potential solution to meet local energy market demands. This case study analyzes wind data measured at a meteorological observation tower in Massachusetts, USA. The tower is equipped with two sets of wind speed sensors at a height of 49 meters, two sets at a height of 38 meters, and one set at a height of 20 meters.
Additionally, wind direction sensors are installed at heights of 49 meters, 38 meters, and 20 meters. Temperature is recorded by a single sensor located at a height of 2 meters. From May 25, 2007, at 11:00 AM to June 10, 2008, at 4:50 PM, the average values, standard deviations, minimums, and maximums of each sensor were recorded every ten minutes.
When conducting wind energy resource assessments, analyzing historical wind data is a crucial first step, helping us understand the wind energy potential of a specific area and determine whether it is suitable for wind power project development. Below is a summarized process for importing, processing, and analyzing wind data collected from meteorological towers:
1. Data Import
-
Data Source: First, clarify the source of the data, such as the wind speed and direction data from the meteorological observation tower in Massachusetts, USA, described in this article.
-
File Format: The data may be stored in CSV, Excel, or specific meteorological data formats. Use programming languages like Python’s pandas library or MATLAB’s readtable function to import the data.
2. Data Preprocessing
-
Time Series Organization: Since the data is recorded every ten minutes, the timestamps need to be converted to a unified time series format for subsequent analysis.
-
Missing Value Handling: Check for missing values in the dataset. Common handling methods include interpolation (e.g., linear interpolation, time series forecasting interpolation) or directly deleting records with missing values.
-
Data Cleaning: Remove outliers, which may be erroneous readings caused by instrument malfunctions or extreme weather events. Common methods include Z-score testing or box plot analysis.
3. Basic Statistical Analysis
-
Descriptive Statistics: Calculate the average, standard deviation, minimum, and maximum of wind speed and direction for each sensor, which helps to gain an initial understanding of the wind conditions.
-
Wind Speed Distribution: Plot wind speed frequency distribution graphs, such as wind speed histograms or wind rose diagrams, to analyze the dominant wind direction and frequency distribution across different wind speed ranges.
4. Wind Energy Density Estimation
-
Wind Energy Calculation: Use the wind energy formula E=12ρv3AE=21ρv3A (where E is wind energy, ρ is air density, v is wind speed, and A is the swept area of the wind turbine) to estimate potential wind energy. Although more factors need to be considered in practice, this step can provide an initial overview of wind energy potential.
-
Wind Energy Density Map: Create annual average wind energy density maps, indicating the wind energy potential at different locations or heights, which is crucial for the site selection of wind turbines.
5. Economic and Technical Feasibility Analysis
-
Capacity Assessment: Combine the specific performance parameters of wind turbines, such as rated power and cut-in wind speed, to assess theoretical capacity.
-
Economic Analysis: Based on the capacity assessment results, combine construction costs, operation and maintenance costs, and grid price to make preliminary predictions of payback periods and economic benefits.
Conclusion
By meticulously importing, preprocessing, statistically analyzing, and assessing wind energy data collected from meteorological towers, we can scientifically evaluate the wind energy development potential of a region, providing strong data support for the planning and decision-making of wind energy projects. This process not only requires solid statistical and data analysis skills but also demands a deep understanding of wind energy technology and its economic models.
2 Operating Results
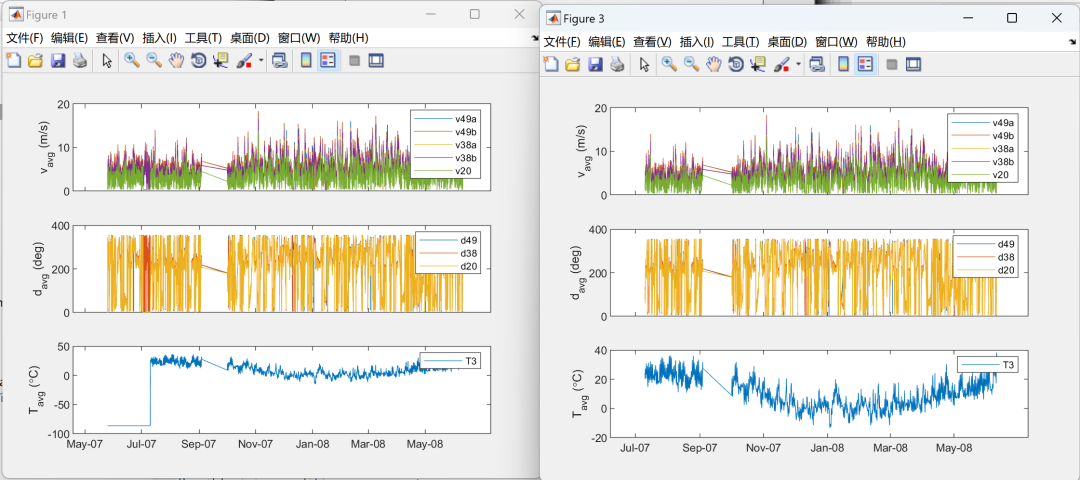
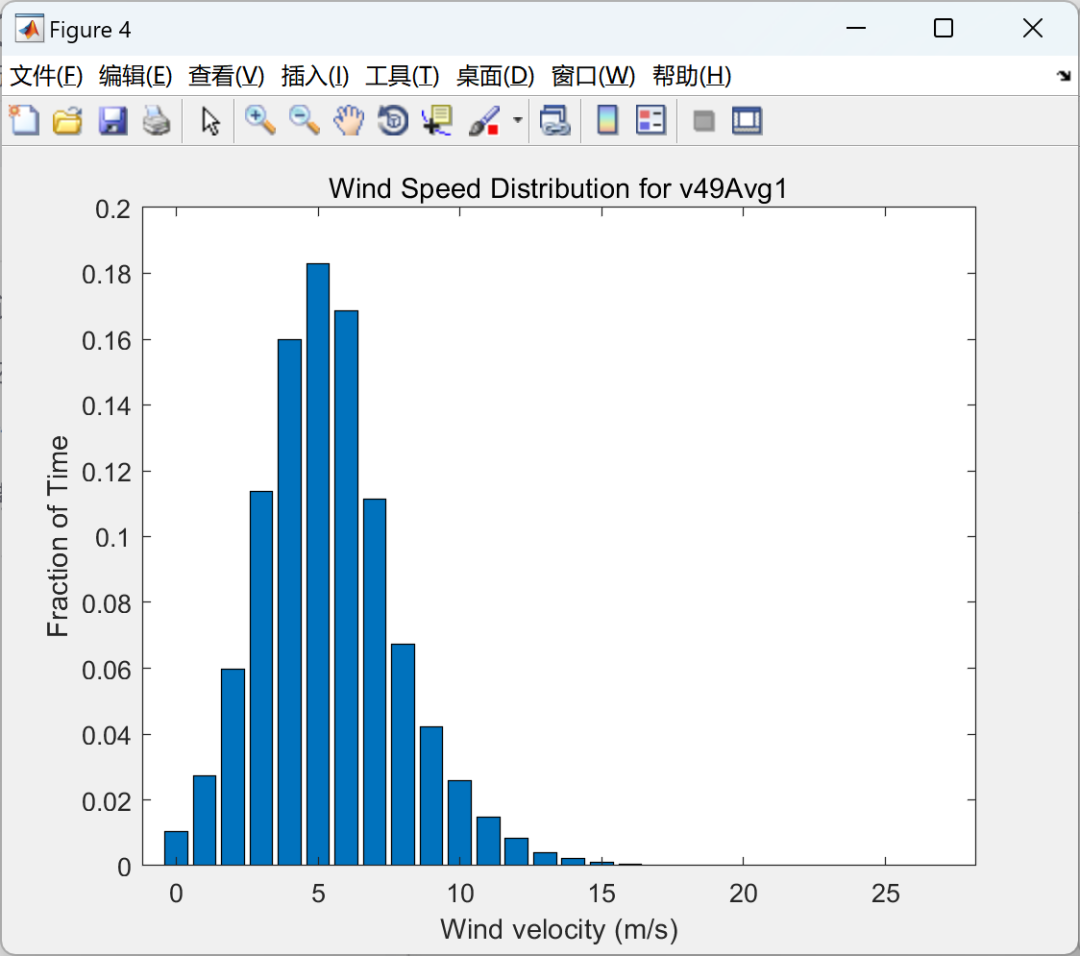
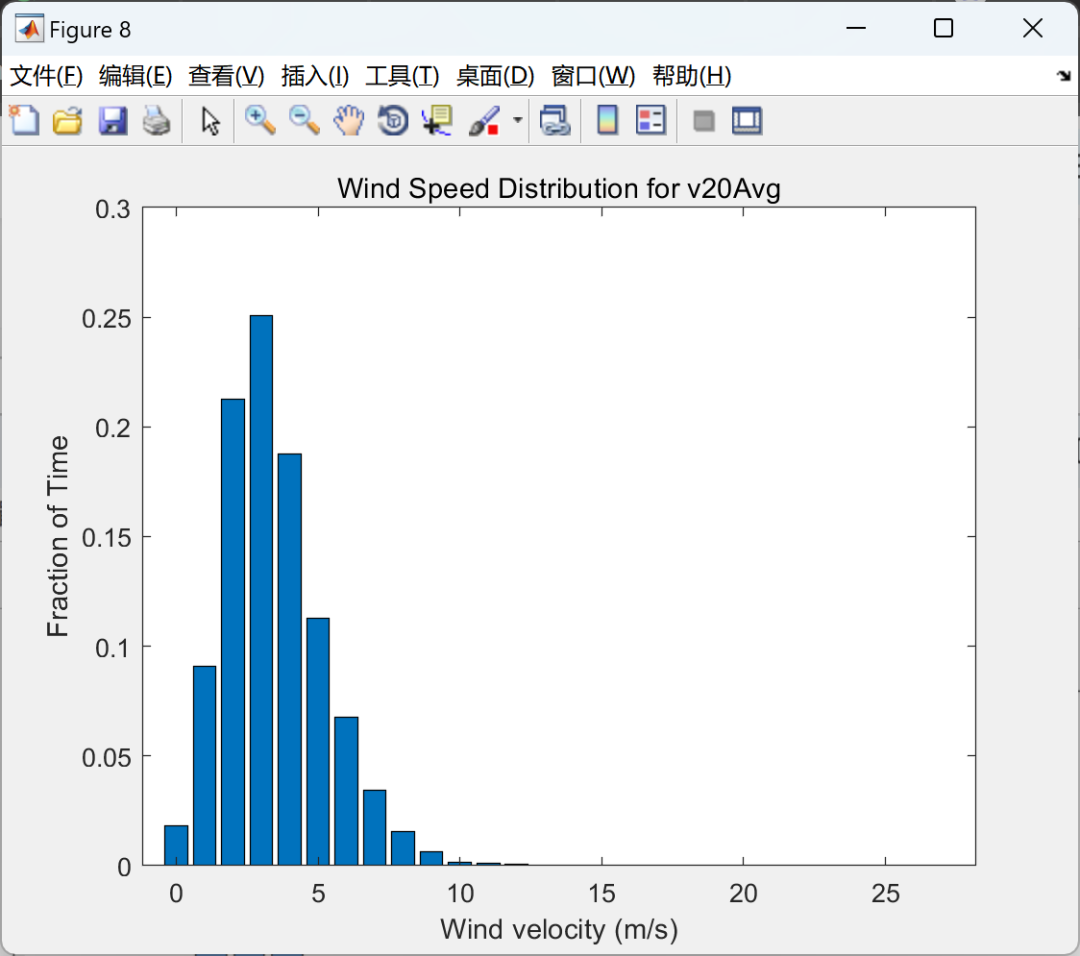
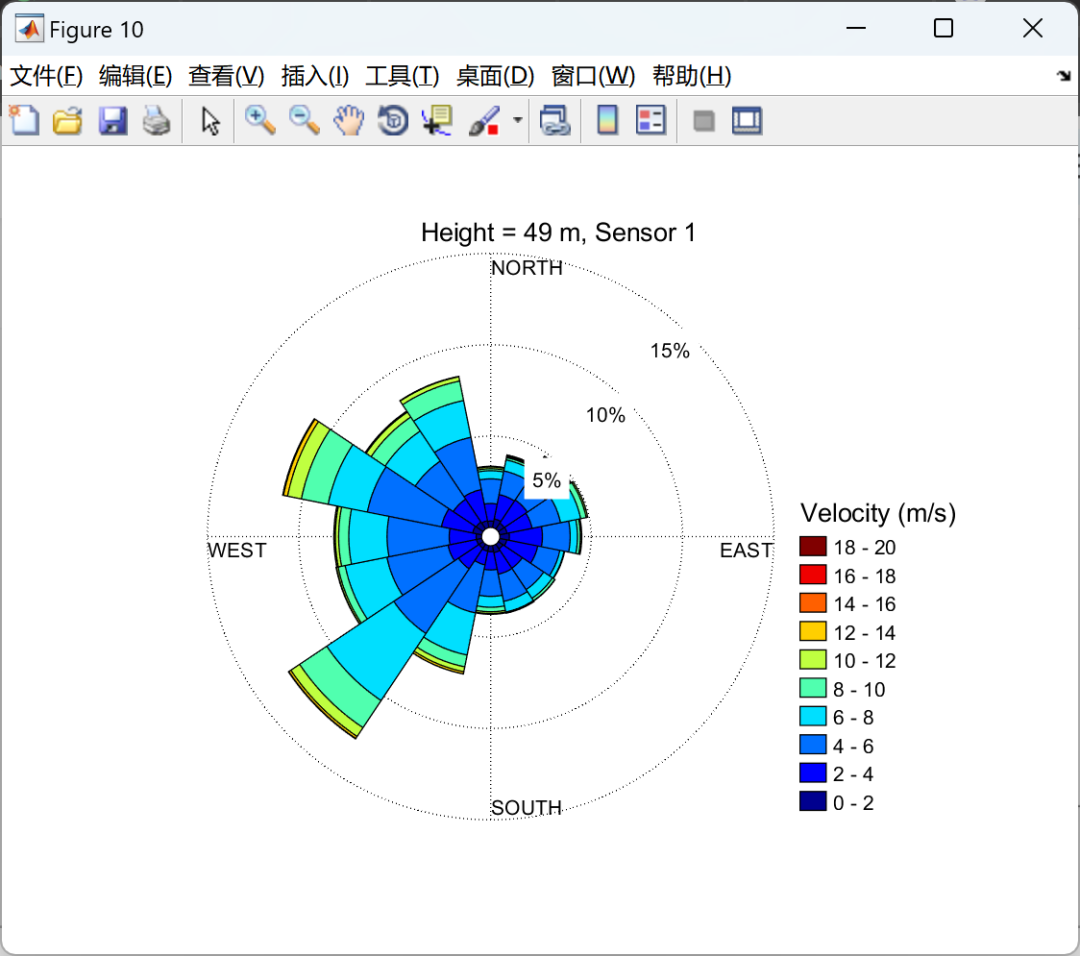
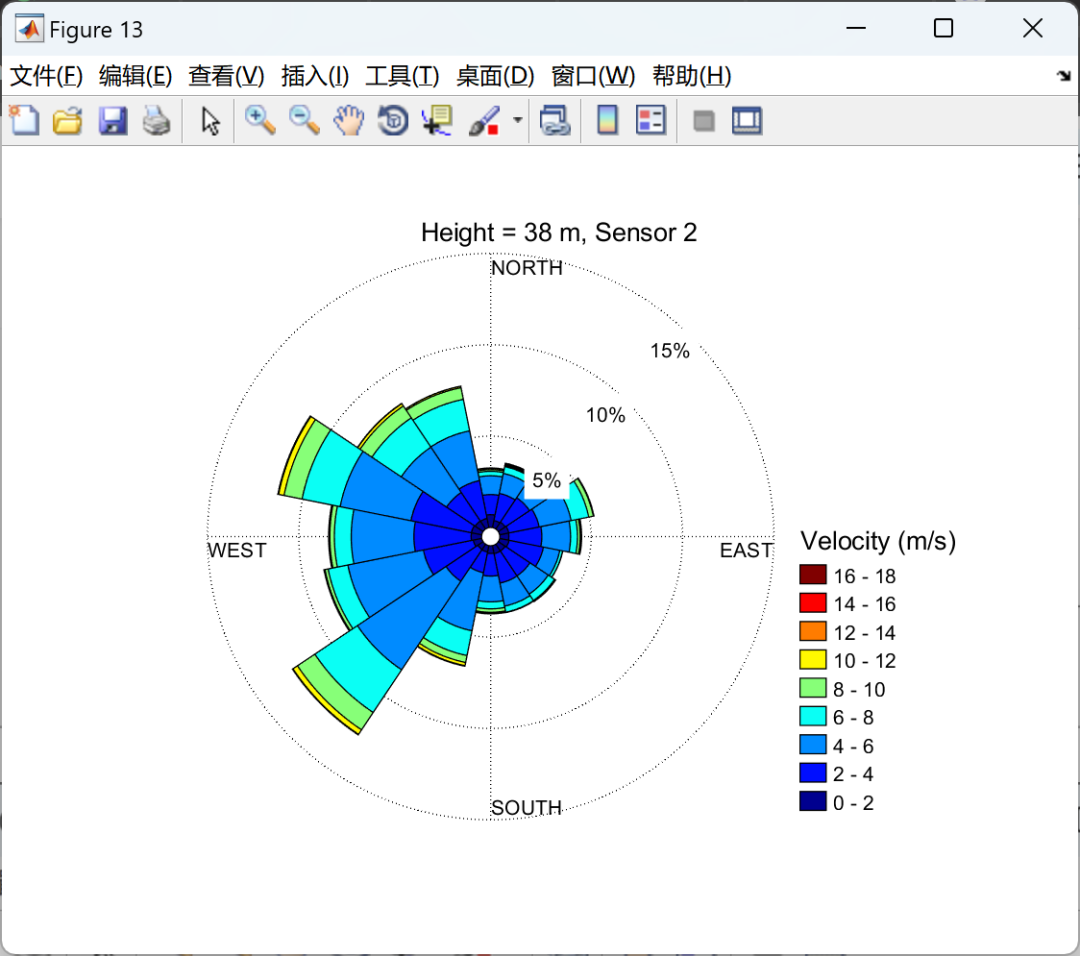
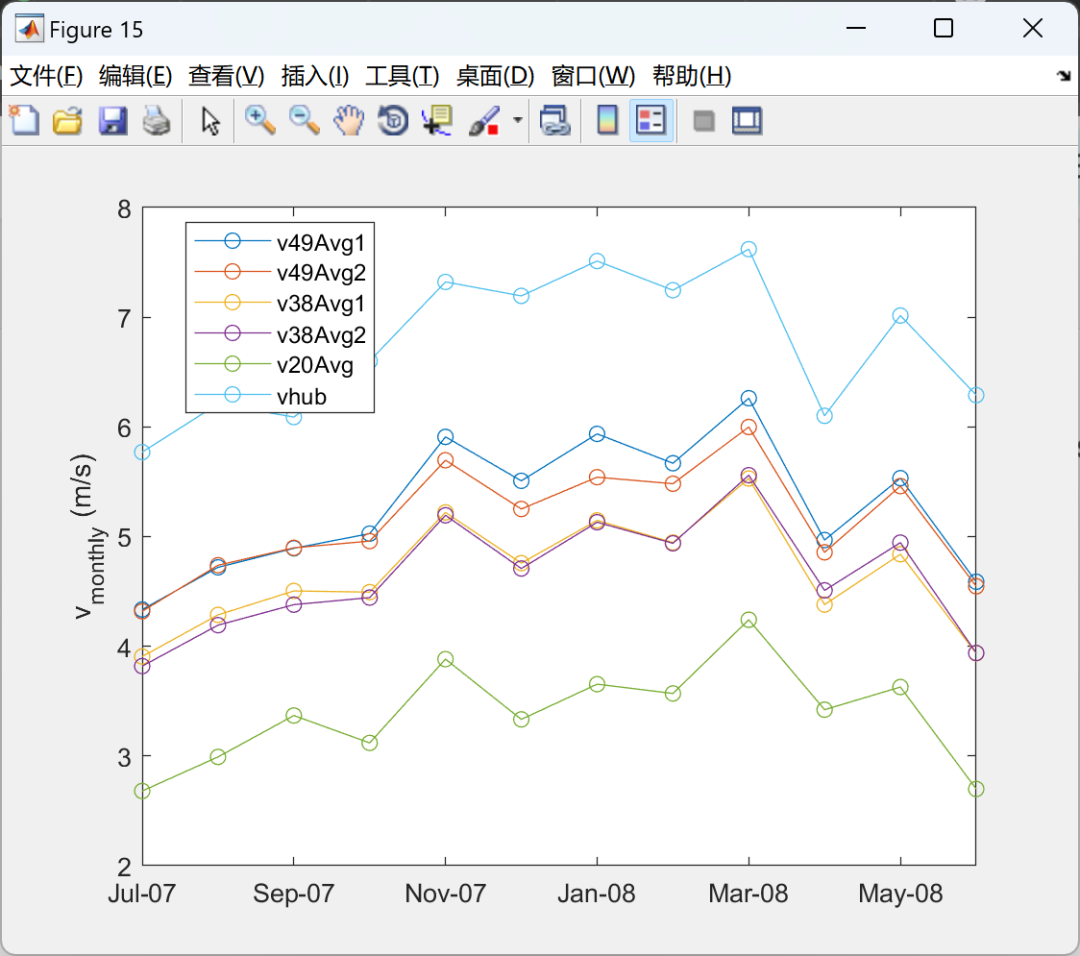
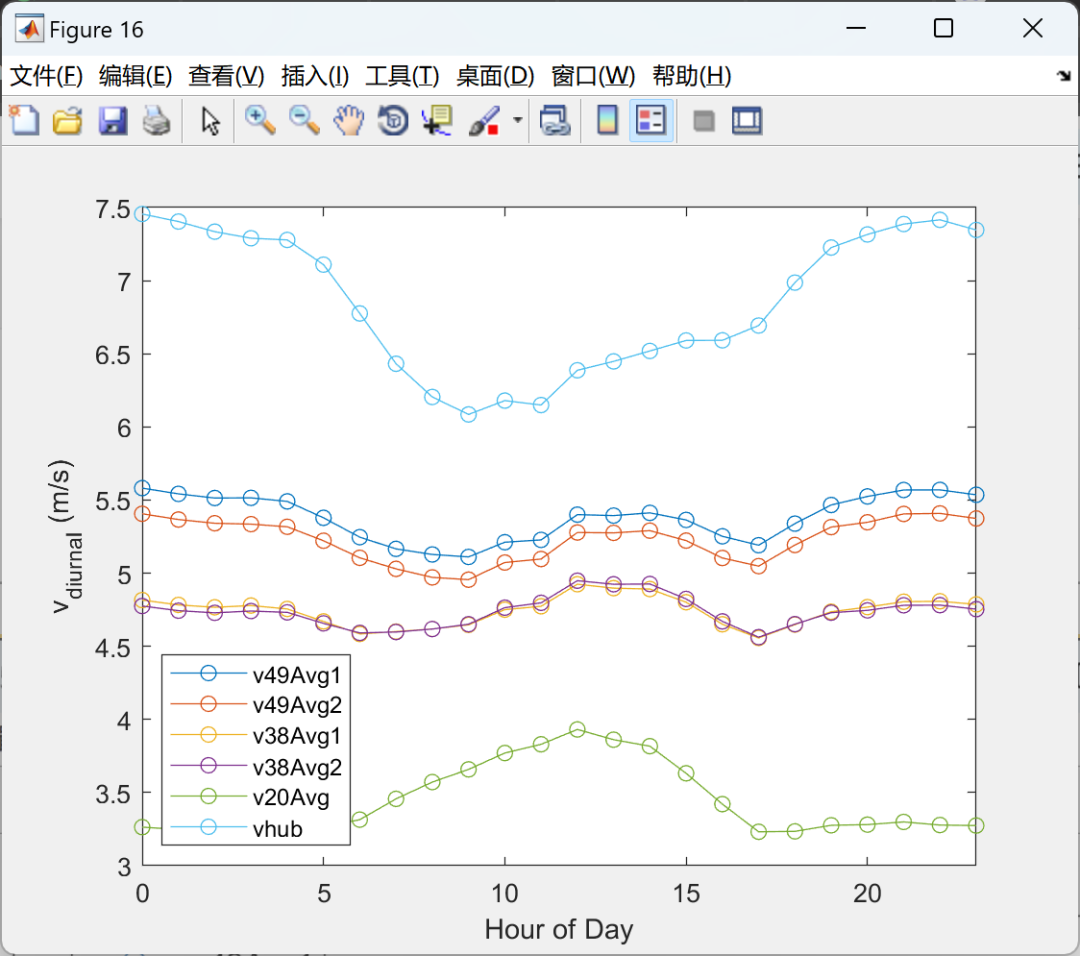
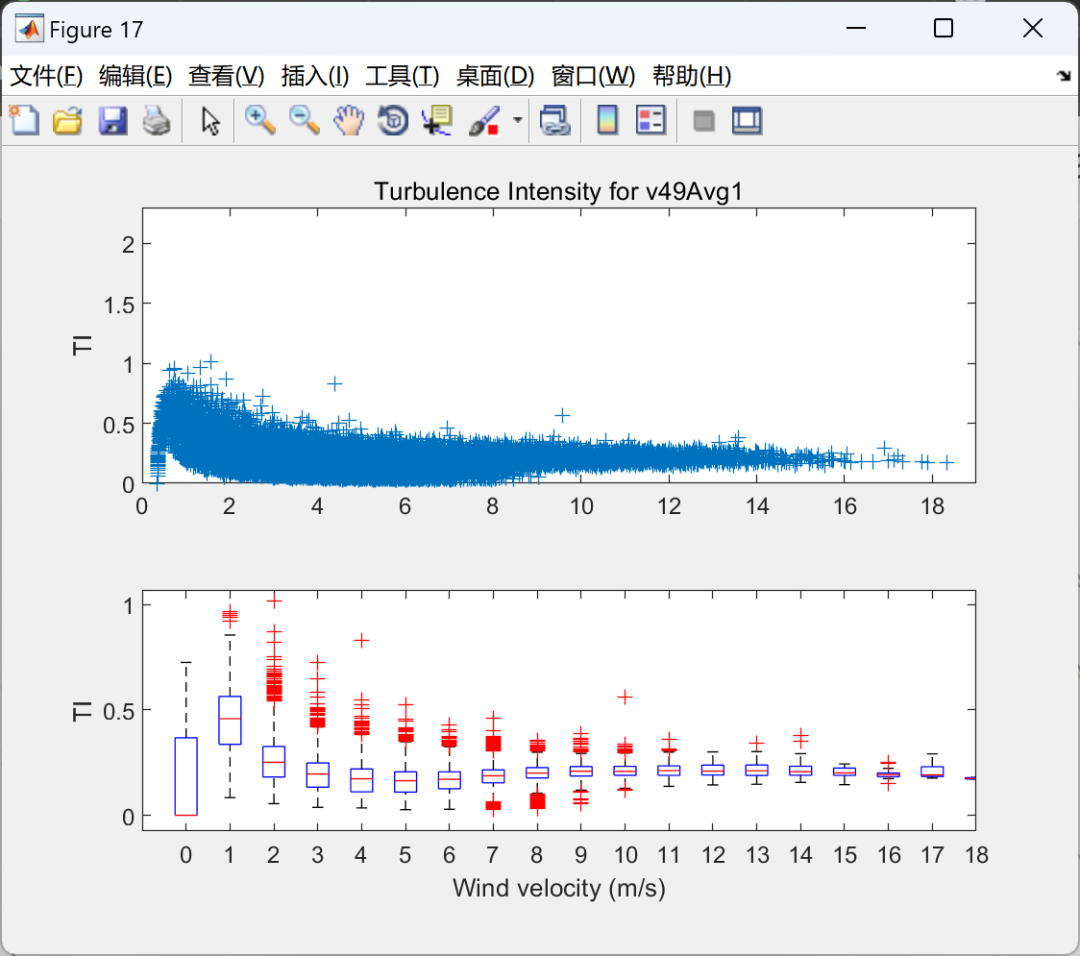
% Plot the results
figure
plot(wresults.diurnal.hour,wresults.diurnal.data,'-o');
    ylabel('v_{diurnal} (m/s)')
    xlabel('Hour of Day')
    xlim([wresults.diurnal.hour(1) wresults.diurnal.hour(end)])
    legend(wind.Properties.VarNames(ivh),'Location','SouthWest')
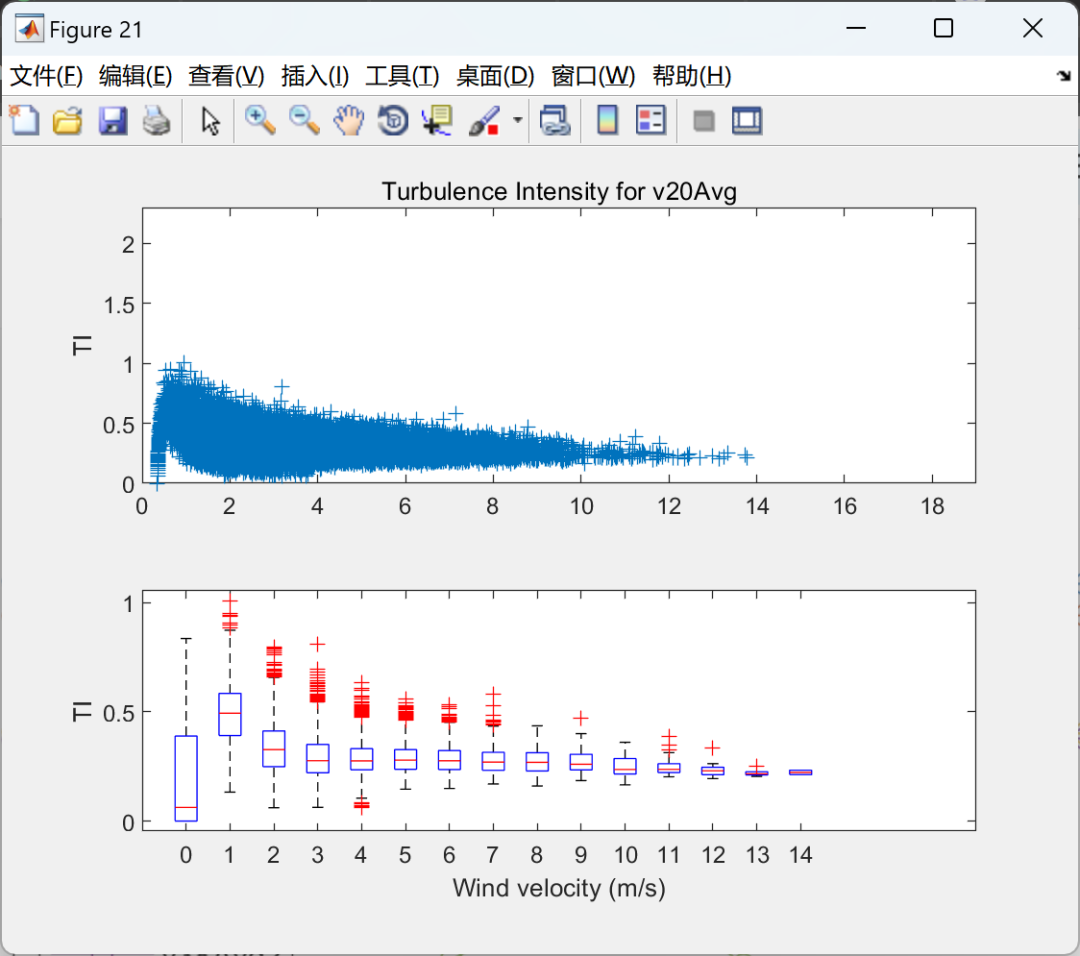
%% Turbulence Intensity
% Compute the turbulence intensity for each observation and velocity
% sensor and the distribution for each sensor.  The turbulence intensity is
% defined as the 10-minute standard deviation of the velocity divided by
% the 10-minute average velocity.
% Compute turbulence intensities
wresults.ti.data =double(wind(:,iv+1))./double(wind(:,iv));
% Display turbulence intensities versus wind speed for each sensor
 timax =ceil(10*max(max(wresults.ti.data)))/10;
vmax =ceil(max(max(double(wind(:,iv)))));
% Visualize data
for ii =1:length(iv)
    figure
    subplot(2,1,1);
            plot(double(wind(:,iv(ii))),wresults.ti.data(:,ii),'+')
            xlim([0 ceil(vmax)])
            ylim([0 ceil(10*timax)/10])
            box on
%xlabel('Wind velocity (m/s)')
            ylabel('TI')
            title(['Turbulence Intensity for ' ...
char(wind.Properties.VarNames(iv(ii)))])
        subplot(2,1,2);
            boxplot(wresults.ti.data(:,ii),round(double(wind(:,iv(ii)))))
            xlim([0 ceil(vmax)])
            xlabel('Wind velocity (m/s)')
            ylabel('TI')
end
3 References
Some content in this article is sourced from the internet, and references will be noted. If there are any inaccuracies, please feel free to contact us for removal.
4 MATLAB Code Implementation
Data acquisition, more fan benefits, MATLAB | Simulink | Python resource acquisition