In-Depth Analysis of Linux Debugfs: A Powerful Tool for Kernel Debugging
1 Overview and Design Philosophy of Debugfs
Debugfs is a virtual file system specifically designed for kernel debugging purposes within the Linux kernel. It provides kernel developers with a simple way to access kernel debugging information from user space. Unlike <span>/proc</span> and <span>/sysfs</span>, debugfs is designed to be unstructured, flexibly variable, allowing kernel developers to place any debugging information they need here without being constrained by the strict “one file, one value” rule.
1.1 Why Debugfs is Needed
Before the advent of debugfs, kernel developers typically used the following methods to expose debugging information:
- • procfs: Originally designed to provide process information, but later misused as an interface for various kernel debugging information.
- • sysfs: Has strict structure and rules, where each file can only contain one value, making it unsuitable for complex debugging data.
- • Direct device nodes: Requires complex permission management and device registration.
These methods have various limitations and cannot meet the kernel developers’ need for a flexible debugging interface. Debugfs was created specifically to address these issues. Its core idea is to provide a “rule-free” space for kernel debugging, where developers can freely define the file and directory structure according to debugging needs without adhering to strict API contracts.
1.2 Comparison with Procfs and Sysfs
To better understand the positioning of debugfs, let’s compare the characteristics of these three virtual file systems in a table:
Table: Comparison of Linux Virtual File Systems
| Feature | Debugfs | Procfs | Sysfs |
|---|---|---|---|
| Main Purpose | Kernel debugging | Process information query | Device model management |
| Rule Restrictions | No rules, flexible | Moderate, some structure | Strict, one value per file |
| Stability | No guarantee of stable ABI interface | Some interfaces stable | Provides stable ABI |
| Content Type | Any debugging information | Process status, system information | Device, driver, module information |
| Typical Path | <span>/sys/kernel/debug</span> |
<span>/proc</span> |
<span>/sys</span> |
| Usage License | GPL only | Any license | Any license |
1.3 Design Philosophy of Debugfs
The design of Debugfs embodies several important philosophical principles of Linux kernel development:
- 1. Separation of Mechanism and Policy: Debugfs provides the mechanism to create debugging interfaces but does not enforce specific policies or structures.
- 2. Pragmatism First: Emphasizes flexibility and development efficiency over stability.
- 3. Self-Restraint: Although there are no rules, developers are expected to use it judiciously to avoid overuse.
It is important to note that debugfs cannot be used as a stable ABI interface. This means that kernel developers can modify the debugfs interface at any time without needing to maintain backward compatibility. This is a significant consideration in production environments but provides great flexibility during development and debugging phases.
2 Debugfs Architecture and Core Data Structures
To deeply understand how debugfs works, we need to analyze its architectural design and core data structures. Debugfs is built on top of the VFS (Virtual File System) layer of the Linux kernel, providing file operation capabilities by implementing the VFS interface like other file systems.
2.1 Overall Architecture
The following diagram shows the overall architectural position of debugfs within the Linux kernel:
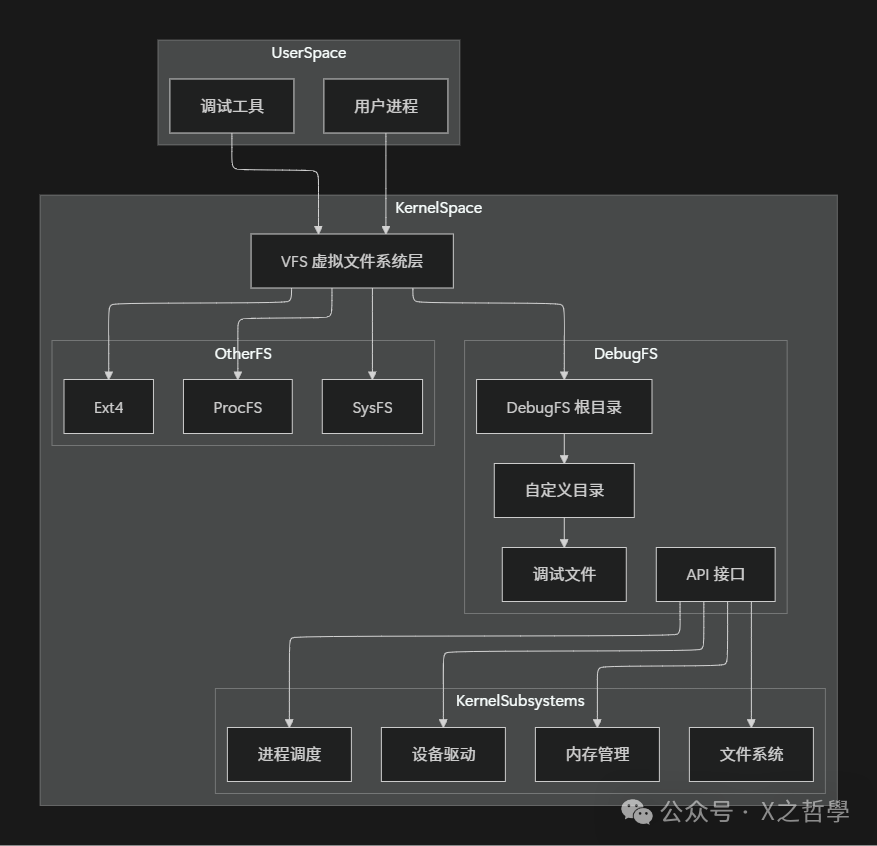
From the architecture diagram, it can be seen that debugfs, as a file system within the kernel, provides debugging interfaces to user space above and debugging data export capabilities to various kernel subsystems below. User space processes access files and directories in debugfs through the VFS layer, while kernel subsystems create and manage these debugging contents through the debugfs API.
2.2 Core Data Structures
The core data structures of Debugfs consist of general structures from VFS and debugfs-specific structures. The main data structures include:
2.2.1 dentry and inode
Like all Linux file systems, debugfs uses <span>dentry</span> (directory entry) and <span>inode</span> (index node) to represent objects in the file system:
struct dentry {
    // ...
    struct inode *d_inode;
    struct dentry_operations *d_op;
    // ...
};

struct inode {
    // ...
    umode_t i_mode;
    kuid_t i_uid;
    kgid_t i_gid;
    struct inode_operations *i_op;
    struct file_operations *i_fop;
    void *i_private;  // Used to store debugfs specific data
    // ...
};
In debugfs, the <span>inode</span>’s <span>i_private</span> field is used to store a pointer to file-specific data, which is very useful when implementing file operations.
2.2.2 file_operations
<span>file_operations</span> structure is one of the cores of debugfs, defining the methods for file operations:
struct file_operations {
    struct module *owner;
    loff_t (*llseek) (struct file *, loff_t, int);
    ssize_t (*read) (struct file *, char __user *, size_t, loff_t *);
    ssize_t (*write) (struct file *, const char __user *, size_t, loff_t *);
    int (*open) (struct file *, struct inode *);
    int (*release) (struct file *, struct inode *);
    // ...
};
When developers use <span>debugfs_create_file()</span><code><span> to create a file, they need to provide the corresponding </span><code><span>file_operations</span><span> structure, implementing at least the </span><code><span>read</span> and/or <span>write</span> operations.
2.2.3 Debugfs Specific Structures
Debugfs also defines some specific data structures to simplify the implementation of common debugging tasks:
// For exporting binary data
struct debugfs_blob_wrapper {
    void *data;
    unsigned long size;
};

// For exporting register information
struct debugfs_reg32 {
    char *name;
    unsigned long offset;
};

struct debugfs_regset32 {
    struct debugfs_reg32 *regs;
    int nregs;
    void __iomem *base;
};
These specific structures make it easier to export specific types of data (such as binary blobs, register values, etc.).
2.3 Data Structure Relationship Diagram
To clearly illustrate the relationships between these data structures, we use a Mermaid chart for visualization:
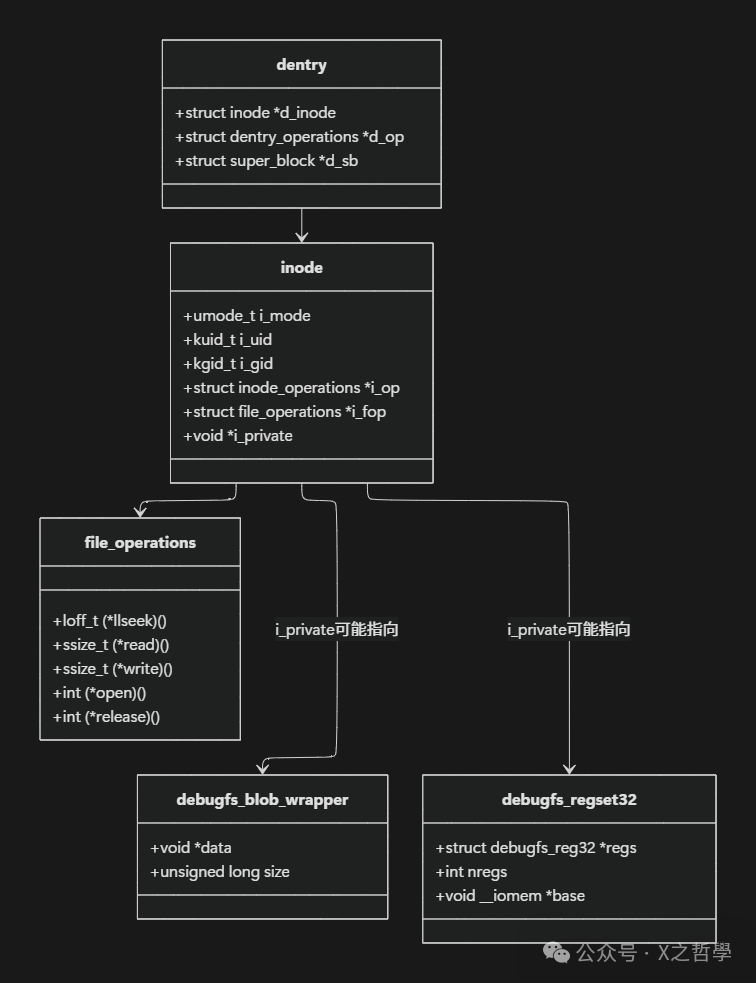
This class diagram shows the relationships between core data structures in debugfs. The <span>dentry</span> and <span>inode</span> are general structures from the VFS layer, while the <span>inode</span>’s <span>i_private</span> field can point to debugfs-specific data structures, such as <span>debugfs_blob_wrapper</span> or <span>debugfs_regset32</span>. The <span>file_operations</span> structure defines the actual operations for the file.
3 In-Depth Analysis of Debugfs Implementation Mechanisms
Having understood the architecture and core data structures of debugfs, we need to delve into its specific implementation mechanisms. This section will analyze the file creation process, data output mechanisms, and resource management strategies of debugfs in detail.
3.1 File System Initialization and Mounting
The initialization process of debugfs begins at kernel startup. Like other kernel file systems, debugfs registers itself through the <span>module_init</span> mechanism:
// Simplified initialization code
static int __init debugfs_init(void)
{
    int retval;

    // Create the inode for the root directory of debugfs
    debugfs_mount = kern_mount(&debugfs_fs_type);
    if (IS_ERR(debugfs_mount)) {
        retval = PTR_ERR(debugfs_mount);
        pr_err("debugfs: mount failed\n");
        return retval;
    }

    // Set default permissions
    debugfs_mount->mnt_sb->s_flags |= SB_NOUSER;
    debugfs_mount->mnt_sb->s_d_op = &debugfs_dops;

    return 0;
}

core_initcall(debugfs_init);
During initialization, debugfs sets critical mount options and operation functions. It is worth noting that the default permission for the root directory of debugfs is initially 0700, meaning only the root user can access it. This is a design choice made for security reasons, but users can modify permissions through mount options.
3.2 File Creation Process Analysis
Debugfs provides a series of APIs for creating debugging files and directories. Let’s analyze the implementation mechanisms of these APIs in depth.
3.2.1 Directory Creation
Creating a directory is the first step in using debugfs, implemented through the <span>debugfs_create_dir()</span> function:
struct dentry *debugfs_create_dir(const char *name, struct dentry *parent)
{
    struct dentry *dentry;
    struct inode *inode;
    int mode = S_IFDIR | S_IRWXU | S_IRUGO | S_IXUGO;

    // If parent directory is NULL, use root directory
    if (!parent)
        parent = debugfs_mount->mnt_root;

    // Create directory entry
    dentry = lookup_one_len(name, parent, strlen(name));
    if (IS_ERR(dentry))
        return dentry;

    // Create inode
    inode = debugfs_get_inode(dentry->d_sb);
    if (!inode) {
        dput(dentry);
        return ERR_PTR(-ENOMEM);
    }

    // Set inode attributes
    inode->i_mode = mode;
    inode->i_op = &debugfs_dir_inode_operations;
    inode->i_fop = &simple_dir_operations;

    // Associate dentry with inode
    d_instantiate(dentry, inode);
    dget(dentry);  // Additional reference count

    return dentry;
}
This function creates a directory and sets the appropriate inode operations and file operations. If the <span>parent</span> parameter is NULL, it creates the directory under the debugfs root directory.
3.2.2 General File Creation
The most general file creation function is <span>debugfs_create_file()</span>, and its implementation mechanism is as follows:
struct dentry *debugfs_create_file(const char *name, umode_t mode,
                   struct dentry *parent, void *data,
                   const struct file_operations *fops)
{
    struct dentry *dentry;
    struct inode *inode;

    // Parameter validation and default value setting
    if (!(mode & S_IFMT))
        mode |= S_IFREG;

    if (!parent)
        parent = debugfs_mount->mnt_root;

    // Create dentry
    dentry = lookup_one_len(name, parent, strlen(name));
    if (IS_ERR(dentry))
        return dentry;

    // Create inode
    inode = debugfs_get_inode(dentry->d_sb);
    if (!inode) {
        dput(dentry);
        return ERR_PTR(-ENOMEM);
    }

    // Set inode attributes
    inode->i_mode = mode;
    inode->i_fop = fops ? fops : &debugfs_file_operations;

    // Store private data
    inode->i_private = data;

    // Associate dentry and inode
    d_instantiate(dentry, inode);
    dget(dentry);

    return dentry;
}
The key points of this function are:
- 1. It allows the caller to specify the file permission mode (mode).
- 2. It accepts a
<span>data</span>pointer, which will be stored in the inode’s<span>i_private</span>field. - 3. It requires the caller to provide a
<span>file_operations</span>structure to define file operations.
3.2.3 Simplified Helper Functions
In addition to the general file creation function, debugfs also provides many simplified helper functions for creating specific types of files. For example, to create a file for outputting hexadecimal values:
void debugfs_create_x32(const char *name, umode_t mode,
            struct dentry *parent, u32 *value)
{
    // Create a file with specific file operations
    debugfs_create_file(name, mode, parent, value, &fops_x32);
}

// File operations for x32 files
static const struct file_operations fops_x32 = {
    .read = debugfs_read_file_x32,
    .write = debugfs_write_file_x32,
    .open = debugfs_open_file,
    .llseek = default_llseek,
};
These helper functions simplify the creation process of files for common types by providing predefined file operation functions. Developers do not need to implement <span>read</span> and <span>write</span> functions themselves, as debugfs already provides standard implementations for basic data types.
3.3 Data Output Mechanisms
Debugfs supports various data output mechanisms, from simple integer values to complex binary data and register dumps.
3.3.1 Simple Value Output
For simple data types (u8, u16, u32, u64, size_t, etc.), debugfs uses unified read and write functions:
static ssize_t debugfs_read_file_x32(struct file *file, char __user *user_buf,
                 size_t count, loff_t *ppos)
{
    u32 *value = file->private_data;
    char buf[32];
    int len;

    // Get value from private data and format it
    len = snprintf(buf, sizeof(buf), "%#x\n", *value);

    // Copy data to user space via VFS
    return simple_read_from_buffer(user_buf, count, ppos, buf, len);
}
The key here is <span>file->private_data</span>, which actually comes from the <span>data</span> parameter passed when creating the file, set during the <span>open</span> operation.
3.3.2 Binary Data Output
For binary data, debugfs provides the <span>debugfs_create_blob()</span> function:
struct dentry *debugfs_create_blob(const char *name, umode_t mode,
                   struct dentry *parent,
                   struct debugfs_blob_wrapper *blob)
{
    return debugfs_create_file(name, mode, parent, blob, &debugfs_blob_fops);
}
Blob files are read-only, returning the data pointed to in the <span>debugfs_blob_wrapper</span> structure when read.
3.3.3 Register Dumps
For hardware register debugging, debugfs provides dedicated register set support:
struct dentry *debugfs_create_regset32(const char *name, umode_t mode,
                   struct dentry *parent,
                   struct debugfs_regset32 *regset)
{
    return debugfs_create_file(name, mode, parent, regset, &regset32_fops);
}
This mechanism allows developers to easily export and view the status of hardware registers, which is very useful for device driver debugging.
3.4 File Operation Flow
When a user space process accesses a debugfs file, the entire processing flow involves multiple levels of the kernel. The following diagram illustrates the timing relationship of this process:
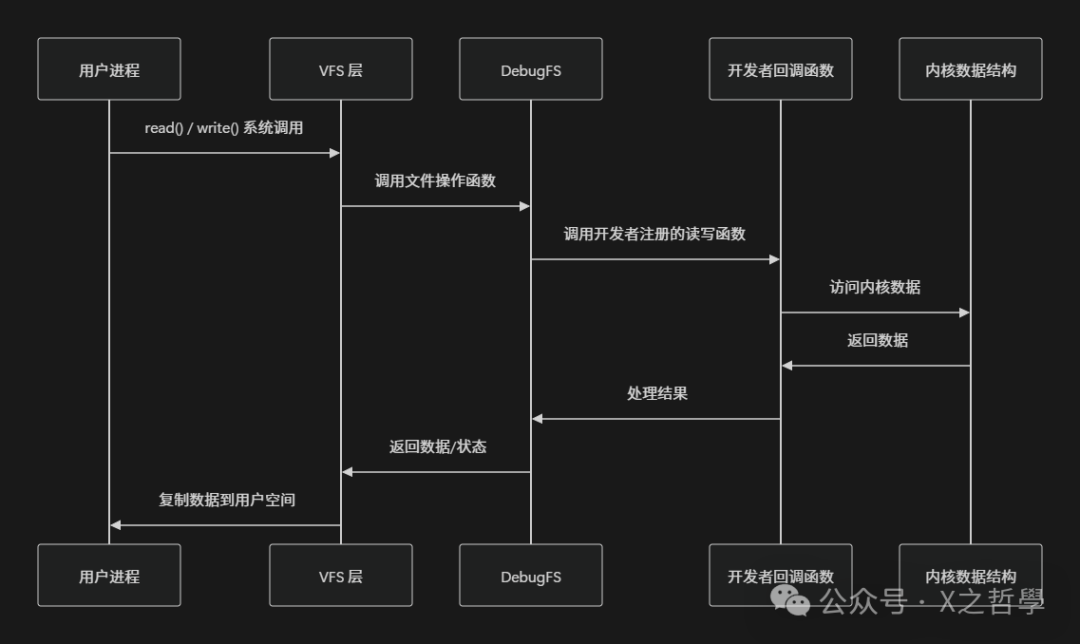
This sequence diagram shows the complete process from initiating read/write calls from user space to kernel processing and returning results. The key points are:
- 1. System calls are routed through the VFS layer to debugfs.
- 2. Debugfs calls the file operation functions registered by the developer.
- 3. File operation functions access the actual kernel data.
- 4. Results are returned to user space via the VFS layer.
3.5 Automatic Cleanup Mechanism
An important design consideration is resource management. Debugfs does not automatically clean up files and directories created within it. If a kernel module does not explicitly delete its debugfs entries upon unloading, it can lead to dangling pointers and system instability.
To address this issue, debugfs provides two deletion mechanisms:
// Delete a single file/directory
void debugfs_remove(struct dentry *dentry);

// Recursively delete an entire directory tree
void debugfs_remove_recursive(struct dentry *dentry);
Modern kernel development recommends using <span>debugfs_remove_recursive()</span><span>, as it can delete the entire debugging directory tree at once, simplifying error handling code.</span>
4 Practical Examples and Applications of Debugfs
After theoretical analysis, let’s demonstrate how to use debugfs in a kernel module through practical examples. This section will gradually build a complete debugfs example module, showcasing various debugfs functionalities.
4.1 Creating a Basic Module Framework
First, we create a basic kernel module framework:
#include <linux/module.h>
#include <linux/kernel.h>
#include <linux/debugfs.h>
#include <linux/fs.h>
#include <linux/uaccess.h>

#define MODULE_NAME "debugfs_example"

static struct dentry *dir_root;
static u32 example_value = 0x12345678;
static atomic_t example_atomic = ATOMIC_INIT(0);
static bool example_bool = true;
static u8 example_u8 = 0xAB;
static u16 example_u16 = 0xABCD;
static u32 example_u32 = 0xABCDEF01;
static u64 example_u64 = 0xABCDEF0123456789;

static int __init debugfs_example_init(void)
{
    // Create module root directory in debugfs
    dir_root = debugfs_create_dir(MODULE_NAME, NULL);
    if (!dir_root) {
        pr_err("Failed to create debugfs directory\n");
        return -ENOMEM;
    }

    pr_info("Debugfs example module loaded\n");
    return 0;
}

static void __exit debugfs_example_exit(void)
{
    // Recursively delete all debug files
    debugfs_remove_recursive(dir_root);
    pr_info("Debugfs example module unloaded\n");
}

module_init(debugfs_example_init);
module_exit(debugfs_example_exit);
MODULE_LICENSE("GPL");
MODULE_AUTHOR("Kernel Developer");
MODULE_DESCRIPTION("Debugfs Example Module");
This basic framework creates a debugfs directory and automatically cleans up upon module unloading. This is the basic pattern for using debugfs.
4.2 Adding Simple Value Files
Next, we add various simple value files to demonstrate the usage of debugfs helper functions:
static int __init debugfs_example_init(void)
{
    // ... Previous initialization code ...

    // Create various simple value files
    debugfs_create_u8("value_u8", 0644, dir_root, &example_u8);
    debugfs_create_u16("value_u16", 0644, dir_root, &example_u16);
    debugfs_create_u32("value_u32", 0644, dir_root, &example_u32);
    debugfs_create_u64("value_u64", 0644, dir_root, &example_u64);

    // Create files for hexadecimal display
    debugfs_create_x8("value_x8", 0444, dir_root, &example_u8);
    debugfs_create_x16("value_x16", 0444, dir_root, &example_u16);
    debugfs_create_x32("value_x32", 0444, dir_root, &example_u32);
    debugfs_create_x64("value_x64", 0444, dir_root, &example_u64);

    // Create atomic variable and boolean value files
    debugfs_create_atomic_t("atomic_value", 0644, dir_root, &example_atomic);
    debugfs_create_bool("bool_value", 0644, dir_root, &example_bool);

    return 0;
}
The permission modes of the files created by these helper functions vary: readable and writable files have a mode of 0644, while read-only files have a mode of 0444. Boolean value files return “Y” or “N” when read and accept “Y”/”N”, “1”/”0″, or “y”/”n” when written.
4.3 Implementing Custom File Operations
For more complex needs, we need to implement custom file operations. Below is a complex example that includes read and write operations:
static char custom_data[256] = "Hello DebugFS!\n";

static ssize_t custom_read(struct file *file, char __user *user_buf,
               size_t count, loff_t *ppos)
{
    return simple_read_from_buffer(user_buf, count, ppos,
                                  custom_data, strlen(custom_data));
}

static ssize_t custom_write(struct file *file, const char __user *user_buf,
                size_t count, loff_t *ppos)
{
    ssize_t ret;

    if (*ppos != 0)
        return -EINVAL;

    if (count >= sizeof(custom_data))
        return -EINVAL;

    ret = simple_write_to_buffer(custom_data, sizeof(custom_data) - 1,
                                 ppos, user_buf, count);
    if (ret < 0)
        return ret;

    custom_data[ret] = '\0';  // Ensure string termination
    return ret;
}

static const struct file_operations custom_fops = {
    .read = custom_read,
    .write = custom_write,
    .llseek = default_llseek,
};

static int __init debugfs_example_init(void)
{
    // ... Previous initialization code ...

    // Create custom file
    debugfs_create_file("custom_file", 0644, dir_root, NULL, &custom_fops);

    return 0;
}
This example demonstrates how to implement complete file operations, including reading, writing, and seeking. <span>simple_read_from_buffer</span> and <span>simple_write_to_buffer</span> are kernel-provided helper functions that simplify data copying between user space and kernel space.
4.4 Implementing Complex Data Structure Output
For complex kernel data structures, we often need to implement more complex output logic. Below is an example using the <span>seq_file</span> interface:
#include <linux/seq_file.h>

static struct debugfs_reg32 example_regs[] = {
    {"REG_CTRL", 0x00},
    {"REG_STATUS", 0x04},
    {"REG_DATA", 0x08},
    {"REG_CONFIG", 0x0C},
};

static void __iomem *fake_reg_base = (void __iomem *)0x12345678;

static int registers_show(struct seq_file *m, void *v)
{
    int i;
    struct debugfs_reg32 *regs = example_regs;
    int nregs = ARRAY_SIZE(example_regs);

    seq_printf(m, "Example Device Registers:\n");
    seq_printf(m, "%-10s %-10s\n", "Register", "Value");
    seq_printf(m, "---------- ----------\n");

    for (i = 0; i < nregs; i++) {
        // In actual drivers, readl() would be used to read registers here
        u32 value = i * 0x1000 + 0xABCD;
        seq_printf(m, "%-10s 0x%08X\n", regs[i].name, value);
    }

    return 0;
}

DEFINE_SHOW_ATTRIBUTE(registers);

static int __init debugfs_example_init(void)
{
    // ... Previous initialization code ...

    // Create file with seq_file interface
    debugfs_create_file("registers", 0444, dir_root, NULL, &registers_fops);

    return 0;
}
<span>seq_file</span> interface is particularly suitable for outputting complex or large amounts of data, as it automatically handles pagination and buffer management.
4.5 Complete Example Module Testing
After compiling and loading this module, we can access the created debugging files in user space:
# Mount debugfs (if not already mounted)
mount -t debugfs none /sys/kernel/debug

# View the directory created by the module
ls /sys/kernel/debug/debugfs_example/

# Read various value files
cat /sys/kernel/debug/debugfs_example/value_u32
cat /sys/kernel/debug/debugfs_example/value_x32

# Write values
echo 0x89ABCDEF > /sys/kernel/debug/debugfs_example/value_u32

# View register information
cat /sys/kernel/debug/debugfs_example/registers
Through these simple commands, developers can view and modify the internal state of the kernel module in real-time, greatly simplifying the debugging process.
5 Debugfs Tool Commands and Debugging Techniques
Having mastered the implementation principles and programming interfaces of debugfs, we need to understand how to use tool commands and debugging techniques in actual debugging processes to fully leverage the potential of debugfs. This section will detail the daily usage commands, advanced debugging techniques, and performance analysis methods of debugfs.
5.1 Basic Mounting and Access Commands
The basic usage of debugfs starts with mounting. Although modern Linux distributions typically auto-mount debugfs, understanding manual management methods is still important:
# Manually mount debugfs
mount -t debugfs none /sys/kernel/debug

# Check if mounted successfully
mount | grep debugfs

# View contents of the debugfs root directory
ls -la /sys/kernel/debug/

# Check mount options, especially permission settings
grep debugfs /proc/mounts
By default, the debugfs root directory is only accessible to the root user. If permission adjustments are needed, they can be specified during mounting:
# Mount with specific permissions
mount -t debugfs -o uid=1000,gid=1000,mode=0755 none /sys/kernel/debug

# Automatically mount via /etc/fstab
echo "none /sys/kernel/debug debugfs uid=1000,gid=1000,mode=0755 0 0" >> /etc/fstab
5.2 Common Debugging Command Examples
Once debugfs is successfully mounted, regular file operation commands can be used to access debugging information. The following table summarizes the most commonly used command patterns:
Table: Common Debugfs Debugging Commands
| Purpose | Command Example | Description |
|---|---|---|
| View available interfaces | <span>ls -la /sys/kernel/debug/</span> |
List all debugging interfaces |
| Read simple values | <span>cat /sys/kernel/debug/.../some_value</span> |
Read values or states |
| Write parameters | <span>echo 1 > /sys/kernel/debug/.../enable</span> |
Modify kernel parameters |
| View binary data | <span>hexdump -C /sys/kernel/debug/.../data</span> |
View binary data in hexadecimal |
| Track dynamic changes | <span>watch cat /sys/kernel/debug/.../counter</span> |
Real-time monitoring of value changes |
| Find specific interfaces | <span>find /sys/kernel/debug -name "*pattern*"</span> |
Search for debugging interfaces by name |
5.3 Practical Debugging Case: DAMON Memory Monitoring
Using the Linux kernel’s DAMON (Data Access MONitor) as an example, we demonstrate how to monitor memory access patterns through debugfs:
# 1. Switch to the DAMON debugfs directory
cd /sys/kernel/debug/damon

# 2. Set monitoring attributes
echo 5000 100000 1000000 10 1000 > attrs

# 3. Set monitoring target (process PID)
echo 1234 > target_ids

# 4. Start monitoring
echo on > monitor_on

# 5. View monitoring results
cat monitor_on
cat records

# 6. Stop monitoring
echo off > monitor_on
This example demonstrates the application of debugfs in actual kernel subsystems. Through simple file operations, users can configure complex memory monitoring functionalities without special debugging tools.
5.4 Advanced Debugging Techniques
For more complex debugging scenarios, the following advanced techniques may be useful:
5.4.1 Automated Debugging Scripts
#!/bin/bash
# debugfs_monitor.sh

DEBUGFS_ROOT="/sys/kernel/debug/my_driver"

while true; do
    clear
    echo "=== Driver Debug Information ==="
    echo "Timestamp: $(date)"
    echo "Status: $(cat $DEBUGFS_ROOT/status)"
    echo "Queue Length: $(cat $DEBUGFS_ROOT/queue_len)"
    echo "Last Error: $(cat $DEBUGFS_ROOT/last_error)"
    echo "Active Requests: $(cat $DEBUGFS_ROOT/active_requests)"
    sleep 1
done
This script can monitor the driver’s status changes in real-time, helping to identify race conditions and timing issues.
5.4.2 Performance Analysis Interfaces
Many performance-sensitive kernel subsystems expose performance statistics through debugfs:
# View scheduler statistics
cat /sys/kernel/debug/sched/statistics

# View memory allocation information
cat /sys/kernel/debug/slabinfo

# View interrupt statistics
cat /sys/kernel/debug/interrupts

# View power management status
cat /sys/kernel/debug/pmc_core/pstate_status
This information is crucial for performance tuning and system bottleneck analysis.
5.5 Security and Permission Considerations
When using debugfs, security and permission management are aspects that require special attention:
# Check current permissions
ls -ld /sys/kernel/debug/

# If normal user access is needed, use ACL
setfacl -m u:username:rx /sys/kernel/debug/some_path

# Or create a symbolic link to a user-accessible location
ln -s /sys/kernel/debug/some/interface /tmp/debug_interface
It is important to note that access to debugfs should generally be restricted in production environments because:
- 1. It may expose sensitive kernel information.
- 2. It may allow modification of critical kernel parameters.
- 3. Performance impact considerations.
5.6 Troubleshooting Common Issues
During the use of debugfs, some common issues may arise:
# Issue 1: Permission denied
sudo cat /sys/kernel/debug/some_file

# Issue 2: Interface does not exist (module not loaded)
sudo modprobe module_name

# Issue 3: Write failed (interface is read-only)
echo 123 | sudo tee /sys/kernel/debug/some_writable_file

# Issue 4: Resource busy (another process is using)
sudo fuser -v /sys/kernel/debug/some_file
Understanding these common issues and their solutions can greatly enhance debugging efficiency.
6 Summary and Best Practices for Debugfs
Through the in-depth analysis of debugfs presented earlier, we can now comprehensively summarize its characteristics, usage scenarios, and best practices. This section will review the core value of debugfs, explore its application patterns in actual projects, and look forward to its future development directions.
6.1 Core Value Summary of Debugfs
As a dedicated debugging file system of the Linux kernel, debugfs has several irreplaceable core values:
- 1. Unconstrained Flexibility: Unlike sysfs’s strict “one file, one value” rule, debugfs allows developers to freely define the structure and content of debugging interfaces as needed.
- 2. Zero Overhead Simplicity: The amount of code required to create debugfs interfaces is minimal, often just a few lines of code to expose complex kernel state information.
- 3. Interactive Debugging Capability: Through the file system interface, developers can query and modify kernel state in real-time without needing to recompile or restart the system.
- 4. Standardized Interface: While the content is flexible, debugfs provides a unified access mode (standard file operations), eliminating the need to learn new debugging commands or tools.
- 5. Modular Design: Debugging interfaces are automatically bound to the kernel module lifecycle, and proper resource management can prevent dangling pointers and memory leaks.
6.2 Application Scenarios and Limitations
To clearly define the applicable scope of debugfs, we summarize its main application scenarios and known limitations in a table:
Table: Debugfs Application Scenarios and Limitations
| Applicable Scenarios | Not Applicable Scenarios | Remarks |
|---|---|---|
| Driver Development Debugging | Stable User Space API | Debugging interfaces can change at any time. |
| Performance Analysis | Production Environment Monitoring | May impact performance. |
| Hardware Register Inspection | High-Frequency Data Collection | File operations have overhead. |
| Algorithm State Tracking | Security-Sensitive Data | Information may be exposed. |
| Temporary Function Switches | Permanent Configuration Storage | Lost after reboot. |
6.3 Best Practice Guidelines
Based on the analysis of debugfs implementation mechanisms and practical usage experiences, we summarize the following best practices:
6.3.1 Resource Management Practices
// Recommended: Use recursive deletion to simplify error handling
static struct dentry *debug_dir;

static int __init my_module_init(void)
{
    debug_dir = debugfs_create_dir("my_module", NULL);

    // Create various debugging files
    debugfs_create_u32("value1", 0644, debug_dir, &value1);
    debugfs_create_file("data", 0644, debug_dir, NULL, &data_ops);

    return 0;
}

static void __exit my_module_exit(void)
{
    // One-click cleanup of all debugging files
    debugfs_remove_recursive(debug_dir);
}
This pattern ensures that even in the case of initialization failure, no dangling debugging interfaces are left behind.
6.3.2 Permission and Security Practices
// Set appropriate permissions based on sensitivity
// General statistics: readable by all users
debugfs_create_u32("public_stats", 0444, dir, &stats);

// Sensitive information: readable only by root
debugfs_create_u32("sensitive_info", 0400, dir, &sensitive);

// Debug control: writable only by root
debugfs_create_bool("debug_switch", 0200, dir, &debug_enable);
Correct permission settings can prevent unauthorized access, especially in production environments.
6.3.3 Content Organization Practices
For complex subsystems, it is recommended to organize debugging files by functionality:
// Create hierarchical structure
struct dentry *subsys_dir = debugfs_create_dir("subsys", NULL);
struct dentry *stats_dir = debugfs_create_dir("stats", subsys_dir);
struct dentry *config_dir = debugfs_create_dir("config", subsys_dir);

// Statistics
debugfs_create_u64("requests", 0444, stats_dir, &request_count);
debugfs_create_u64("errors", 0444, stats_dir, &error_count);

// Configuration parameters
debugfs_create_u32("timeout", 0644, config_dir, &timeout_ms);
debugfs_create_bool("enable_feature", 0644, config_dir, &feature_enable);
This organizational method keeps related debugging information centralized, making it easier to find and use.
6.4 Performance Considerations and Optimizations
While debugfs is very convenient, its overhead needs to be considered in performance-sensitive scenarios:
- 1. File Operation Overhead: Each read/write operation involves context switching and memory copying.
- 2. Concurrent Access: Ensure the thread safety of debugging interfaces, using mutexes when necessary.
- 3. Memory Usage: Large blob data or complex data structures may consume significant memory.
For high-performance scenarios, the following optimization strategies can be considered:
static ssize_t optimized_read(struct file *file, char __user *user_buf,
                size_t count, loff_t *ppos)
{
    // For frequently read statistics, consider reducing update frequency
    // or using lock-free data structures
    return simple_read_from_buffer(user_buf, count, ppos,
                                  cached_data, data_size);
}
6.5 Conclusion
Debugfs is an extremely valuable debugging tool in the Linux kernel ecosystem, providing kernel developers with unprecedented flexibility and convenience through a simple file system interface. Through this in-depth analysis, we can see:
- 1. The design philosophy of Debugfs reflects the pragmatic tradition of Linux.
- 2. Its implementation is built on a solid VFS architecture while providing a simplified API.
- 3. A rich set of helper functions covers various debugging needs from simple values to complex data structures.
- 4. Proper resource management and permission control are crucial for production-quality code.