Improved Infectious Disease Transmission Dynamics (SEIAR Model)SEIAR Model
The SEIAR model is a compartmental model in infectious disease dynamics used to simulate the transmission process of diseases within a population. It extends the classic SIR model (Susceptible, Infectious, Recovered) by adding two key compartments: Exposed and Asymptomatic, allowing for a more detailed description of disease transmission characteristics.
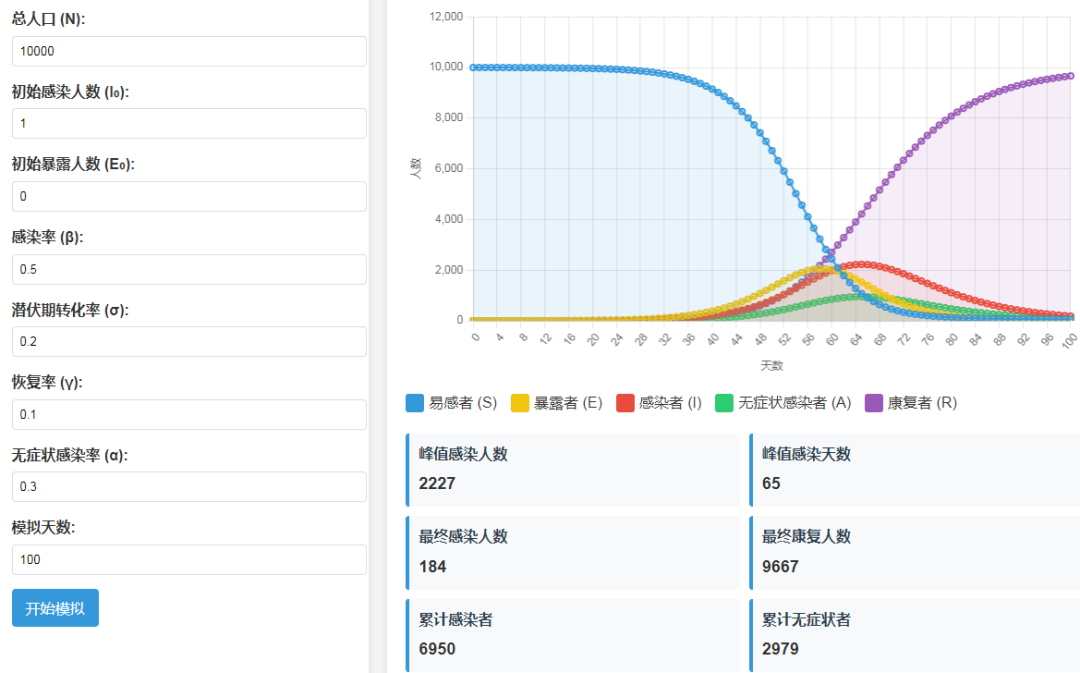
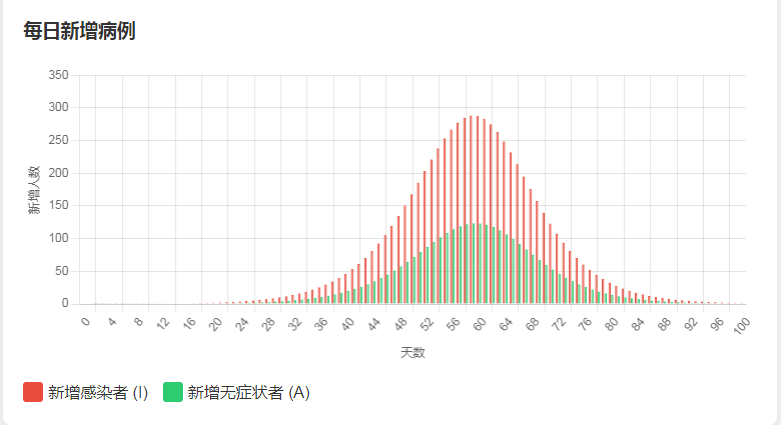
A few days ago, I created a web-based model calculation, and some followers indicated that it was not comprehensive enough and needed additional features. Based on their feedback, this update includes the display of asymptomatic individuals and a trend chart for daily new cases.
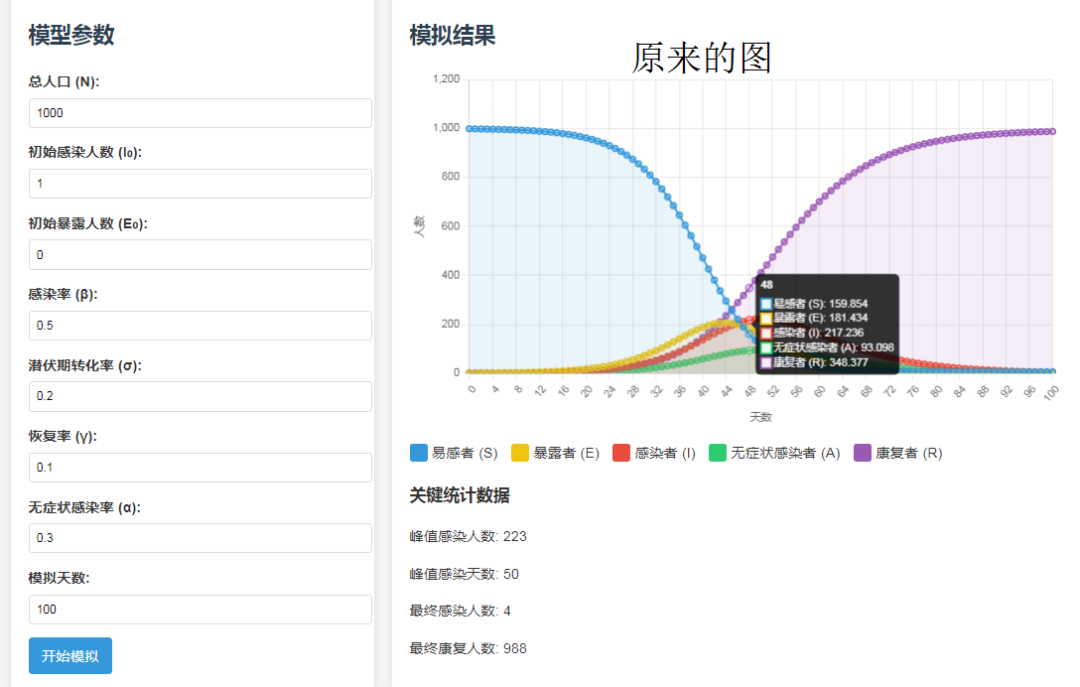
The updated charts are as follows:
Applicable Infectious Diseases
Applicable to diseases with a certain incubation period and asymptomatic transmission (e.g., COVID-19, influenza, etc.)
Model Explanation
Variable Explanation
S (Susceptible): Individuals who are not infected but may become infected.
E (Exposed): Individuals who are infected but not yet infectious (incubation period).
I (Infectious): Symptomatic individuals who are infectious.
A (Asymptomatic): Individuals who are infected but have no (or very mild) symptoms and are infectious.
R (Recovered): Individuals who have recovered or been removed (including deaths or immune individuals).
N = S + E + I + A + R: Total population (assumed to be constant).
Parameter Explanation
β: Infection rate (the probability of an infected individual (symptomatic or asymptomatic) effectively transmitting to a susceptible individual per unit time).
σ: Rate of transition from exposed to infectious (σ = 1/average incubation period).
α: Proportion of exposed individuals who become asymptomatic (0 ≤ α ≤ 1).
γ: Recovery rate (γ = 1/average infectious period).
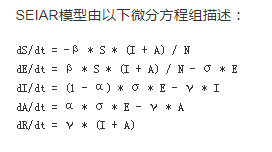
1. Change in Susceptible (S)
dS/dt = -β * S * (I + A) / N
Meaning: The number of susceptible individuals decreases due to contact with infectious individuals (I + A).
Key Point: The infectivity is proportional to the proportion of infected individuals in the total population (I+A)/N.
2. Change in Exposed (E)
dE/dt = β * S * (I + A) / N – σ * E
First term: New exposed individuals (from susceptible individuals).
Second term: Exposed individuals transition to infectious at rate σ.
3. Change in Infectious (I)
dI/dt = (1 – α) * σ * E – γ * I
First term: Proportion 1−α of exposed individuals become infectious.
Second term: Infectious individuals recover or are removed at rate γ.
4. Change in Asymptomatic (A)
dA/dt = α * σ * E – γ * A
First term: Proportion α of exposed individuals become asymptomatic.
Second term: Asymptomatic individuals recover at the same rate γ (assuming symptoms do not affect recovery rate).
5. Change in Recovered (R)
dR/dt = γ * (I + A)
All infectious individuals (symptomatic + asymptomatic) enter this category after recovery.
Model Assumptions
1. All individuals (whether susceptible or infectious) have equal contact opportunities, and the contact rate is constant (e.g., each person randomly contacts a fixed number of people each day).
2. The total population is closed. The total number remains constant, ignoring births, natural deaths, migration, and deaths caused by the epidemic, and ignoring the impact of population movement on transmission.
3. Parameters are constant, and the time individuals spend from exposed to infectious (E→I/A) or from infectious to recovered (I/A→R) follows an exponential distribution. Transition rates σ and γ are constants, β does not dynamically change with control measures (e.g., lockdowns), and α does not change with pathogenic variations.
4. Symptomatic (I) and asymptomatic (A) individuals have the same infectivity β.
5. Recovered individuals (R) have lifelong immunity and no longer participate in transmission or become susceptible again.
6. Asymptomatic individuals (E) are not infectious; they only begin to transmit after becoming I or A.
7. Disease transmission is not affected by geographical space or individual behavior (e.g., wearing masks after an outbreak).
Modeling Analysis
The web file can be opened with any browser without the need to install any programs, and it can be operated on both mobile and computer. If needed, please send a private message or leave a comment.
Sample Code:
for (let t = 1; t <= days; t++) {
// Calculate changes
const dS = -beta * S * (I + A); const dE = beta * S * (I + A) / N – sigma * E;
const dI = (1 – alpha) * sigma * E – gamma * I;
const dA = alpha * sigma * E – gamma * A;
const dR = gamma * (I + A);
// Update states
S += dS;
E += dE;
I += dI;
A += dA;
R += dR;
To learn more, please continue to follow this public account, which regularly shares knowledge on disinfection, hospital infection, and infectious disease prevention. Suggestions or feedback can be left in comments or private messages.