1. Background:
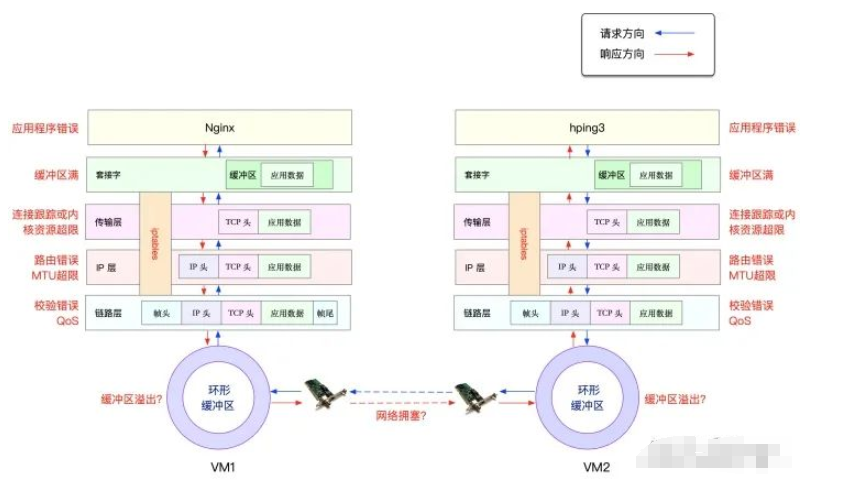
From the image, you can see the potential locations where packet loss may occur, which actually spans the entire network protocol stack. In other words, there is a possibility of packet loss at every stage.
- • Between two VMs, transmission failures may occur due to errors such as network congestion or line faults;
- • After the network card receives packets, the ring buffer may overflow, leading to packet loss;
- • At the link layer, packet loss may occur due to network frame checksum failures, QoS, etc.;
- • At the IP layer, packet loss may occur due to routing failures or packet sizes exceeding the MTU;
- • At the transport layer, packet loss may occur due to unlistened ports or resource usage exceeding kernel limits;
- • At the socket layer, packet loss may occur due to socket buffer overflow;
- • At the application layer, packet loss may occur due to application exceptions;
- • Additionally, if iptables rules are configured, these network packets may also be lost due to iptables filtering rules.
2. Link Layer
When packet loss occurs at the network card due to reasons such as buffer overflow, Linux records the number of send/receive errors in the network card’s statistics. You can check the packet loss records of the network card using ethtool or netstat.
netstat -i

Kernel Interface table
Iface      MTU    RX-OK RX-ERR RX-DRP RX-OVR    TX-OK TX-ERR TX-DRP TX-OVR Flg
eth0       100       31      0      0      0             8      0      0      0 BMRU
lo         65536        0      0      0      0             0      0      0      0
RX-OK, RX-ERR, RX-DRP, RX-OVR represent:
- • Total number of packets received
- • Total number of errors
- • Number of packets dropped after entering the Ring Buffer due to other reasons (e.g., insufficient memory)
- • Number of packets dropped due to Ring Buffer overflow.
TX-OK, TX-ERR, TX-DRP, TX-OVR also represent similar meanings, but refer to the corresponding metrics during transmission.
Here we did not find any errors, indicating that the virtual network card did not experience packet loss. However, it is important to note that if QoS is configured using tools like tc, then packet loss caused by tc rules will not be included in the network card’s statistics. Therefore, we also need to check if tc rules are configured on eth0 and see if there is any packet loss. Add the -s option to output statistical information:
tc for traffic control in the Linux kernel
tc -s qdisc show dev eth0

qdisc netem 800d: root refcnt 2 limit 1000 loss 30%
Sent 432 bytes 8 pkts (dropped 4, overlimits 0 requeues 0)
backlog 0b 0 prequeues 0
It can be seen that a network emulation queuing rule (qdisc netem) is configured on eth0, with a packet loss rate of 30% (loss 30%). Looking at the subsequent statistics, 8 packets were sent, but 4 were lost. This seems to be the reason why the response packets from Nginx were dropped by the netem module.
Since we have identified the problem, the solution is simple: just delete the netem module. Execute the following command to remove the netem module from tc:
tc qdisc del dev eth0 root netem loss 30%
After deletion, re-execute the previous hping3 command to see if there are still issues:
hping3 -c 10 -S -p 80 192.168.0.30

HPING 192.168.0.30 (eth0 192.168.0.30): S set, 40 headers + 0 data bytes
len=44 ip=192.168.0.30 ttl=63 DF id=0 sport=80 flags=SA seq=0 win=5120 rtt=7.9 ms
len=44 ip=192.168.0.30 ttl=63 DF id=0 sport=80 flags=SA seq=2 win=5120 rtt=1003.8 ms
len=44 ip=192.168.0.30 ttl=63 DF id=0 sport=80 flags=SA seq=5 win=5120 rtt=7.6 ms
len=44 ip=192.168.0.30 ttl=63 DF id=0 sport=80 flags=SA seq=6 win=5120 rtt=7.4 ms
len=44 ip=192.168.0.30 ttl=63 DF id=0 sport=80 flags=SA seq=9 win=5120 rtt=3.0 ms

--- 192.168.0.30 hping statistic ---
10 packets transmitted, 5 packets received, 50% packet loss
round-trip min/avg/max = 3.0/205.9/1003.8 ms
Unfortunately, from the output of hping3, we can still see 50% packet loss, and the RTT fluctuations are still significant, ranging from 3ms to 1s. Clearly, the problem has not been resolved, and packet loss continues to occur. However, since we have completed the checks at the link layer, we will continue to analyze the upper layers to see if there are issues at the network layer and transport layer.
3. Network Layer and Transport Layer
In the network layer and transport layer, there are many factors that can cause packet loss. However, confirming whether packet loss has occurred is quite simple, as Linux provides us with a summary of the send/receive statistics for each protocol. By executing the netstat -s command, we can see the protocol’s send/receive summary and error information:
netstat -s
# Output
Ip:
    Forwarding: 1          // Forwarding enabled
    31 total packets received    // Total packets received
    0 forwarded            // Packets forwarded
    0 incoming packets discarded // Packets discarded
    25 incoming packets delivered // Packets delivered
    15 requests sent out      // Packets sent out
Icmp:
    0 ICMP messages received    // ICMP packets received
    0 input ICMP message failed    // ICMP failures
    ICMP input histogram:
    0 ICMP messages sent      // ICMP sent
    0 ICMP messages failed      // ICMP failures
    ICMP output histogram:
Tcp:
    0 active connection openings // Active connections
    0 passive connection openings // Passive connections
    11 failed connection attempts // Failed connection attempts
    0 connection resets received // Connection resets received
    0 connections established    // Connections established
    25 segments received      // Segments received
    21 segments sent out      // Segments sent
    4 segments retransmitted    // Segments retransmitted
    0 bad segments received      // Bad segments received
    0 resets sent          // Resets sent
Udp:
    0 packets received
    ...
TcpExt:
    11 resets received for embryonic SYN_RECV sockets // Half connection resets
    0 packet headers predicted
    TCP Timeouts: 7    // Timeout count
    TCP Syn Retrans: 4 // SYN retransmissions
...
Netstat summarizes the send/receive statistics for various protocols such as IP, ICMP, TCP, and UDP. However, our goal is to troubleshoot packet loss, so we mainly observe the error counts, packet loss counts, and retransmission counts. It can be seen that only the TCP protocol has experienced packet loss and retransmissions, specifically:
- • 11 failed connection attempts
- • 4 retransmissions
- • 11 half connection resets
- • 4 SYN retransmissions
- • 7 timeouts
This result indicates that the TCP protocol has multiple timeouts and failed retries, with the main error being half connection resets. In other words, the primary failures are due to the three-way handshake failing. However, while we see many failures here, the specific root cause of the failures is still undetermined. Therefore, we need to continue analyzing the protocol stack. How should we analyze the next few layers?
4. iptables
First, in addition to the various protocols in the network layer and transport layer, iptables and the kernel’s connection tracking mechanism may also cause packet loss. Therefore, this is also a factor we must check when packet loss occurs.
Let’s first look at connection tracking. To confirm whether connection tracking is causing the issue, we only need to compare the current connection tracking count with the maximum connection tracking count.
# Query kernel configuration in the host terminal
$ sysctl net.netfilter.nf_conntrack_max
net.netfilter.nf_conntrack_max = 262144
$ sysctl net.netfilter.nf_conntrack_count
net.netfilter.nf_conntrack_count = 182
It can be seen that the connection tracking count is only 182, while the maximum connection tracking count is 262144. Clearly, the packet loss here cannot be caused by connection tracking.
Next, let’s look at iptables. To review the principle of iptables, it is based on the Netfilter framework, which filters (e.g., firewall) and modifies (e.g., NAT) network packets through a series of rules. These iptables rules are managed in a series of tables, including filter, nat, mangle (for modifying packet data), and raw (for raw packets). Each table can include a series of chains for grouping iptables rules.
For packet loss issues, the most likely cause is that the rules in the filter table are dropping packets. To clarify this, we need to confirm whether the rules targeting DROP and REJECT that would discard packets have been executed. We can directly query the statistics of DROP and REJECT rules to see if they are 0. If they are not 0, we can extract the relevant rules for analysis.
iptables -t filter -nvL
# Output
Chain INPUT (policy ACCEPT 25 packets, 1000 bytes)
pkts bytes target     prot opt in     out     source               destination
    6   240 DROP       all -- *      *       0.0.0.0/0            0.0.0.0/0            statistic mode random probability 0.29999999981

Chain FORWARD (policy ACCEPT 0 packets, 0 bytes)
pkts bytes target     prot opt in     out     source               destination

Chain OUTPUT (policy ACCEPT 15 packets, 660 bytes)
pkts bytes target     prot opt in     out     source               destination
    6   264 DROP       all -- *      *       0.0.0.0/0
From the output of iptables, you can see that the statistics for the two DROP rules are not 0; they are present in the INPUT and OUTPUT chains. These two rules are actually the same, indicating that a random 30% packet loss is applied using the statistic module. The 0.0.0.0/0 indicates that all source and destination IPs are matched, meaning that all packets will experience a random 30% packet loss. It seems that this should be the “culprit” causing some packet loss.
Execute the following two iptables commands to delete these two DROP rules.
root@nginx:/# iptables -t filter -D INPUT -m statistic --mode random --probability 0.30 -j DROP
root@nginx:/# iptables -t filter -D OUTPUT -m statistic --mode random --probability 0.30 -j DROP
Re-execute the previous hping3 command to see if it is now normal.
# Output
HPING 192.168.0.30 (eth0 192.168.0.30): S set, 40 headers + 0 data bytes
len=44 ip=192.168.0.30 ttl=63 DF id=0 sport=80 flags=SA seq=0 win=5120 rtt=11.9 ms
len=44 ip=192.168.0.30 ttl=63 DF id=0 sport=80 flags=SA seq=1 win=5120 rtt=7.8 ms
...
len=44 ip=192.168.0.30 ttl=63 DF id=0 sport=80 flags=SA seq=9 win=5120 rtt=15.0 ms

--- 192.168.0.30 hping statistic ---
10 packets transmitted, 10 packets received, 0% packet loss
round-trip min/avg/max = 3.3/7.9/15.0 ms
However, so far, the hping3 tool we have been using can only verify that the Nginx’s 80 port is in a normal listening state, but we have not yet accessed Nginx’s HTTP service. Therefore, do not rush to conclude this optimization; we need to further confirm whether Nginx can respond to HTTP requests normally. We continue in terminal two, executing the following curl command to check Nginx’s response to HTTP requests:
$ curl --max-time 3 http://192.168.0.30
curl: (28) Operation timed out after 3000 milliseconds with 0 bytes received
Strangely, the result from hping3 shows that Nginx’s 80 port is in a normal state, but why can it still not respond to HTTP requests? Don’t forget, we have a powerful tool—packet capture. It seems necessary to capture packets to investigate.
5. tcpdump
Execute the following tcpdump command to capture packets on port 80:
tcpdump -i eth0 -nn port 80
# Output
tcpdump: verbose output suppressed, use -v or -vv for full protocol decode
listening on eth0, link-type EN10MB (Ethernet), capture size 262
Then, switch to terminal two and execute the previous curl command again:
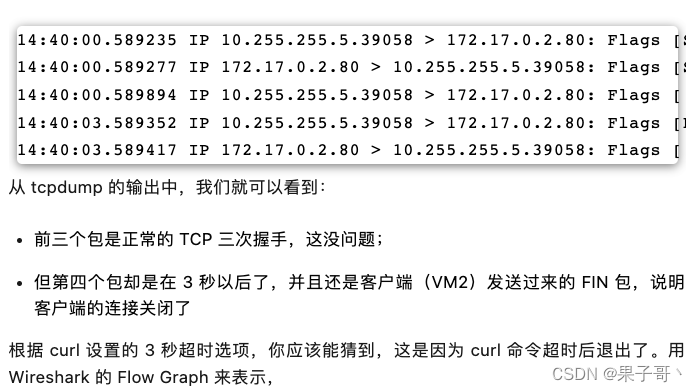
Wireshark flow graph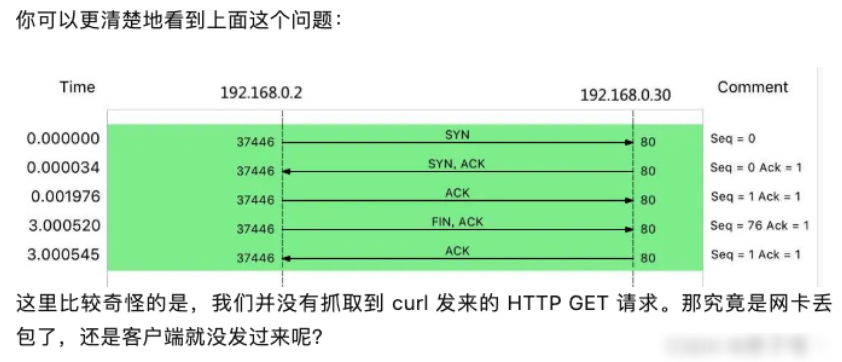
We can re-execute the netstat -i command to confirm if there are any packet loss issues with the network card:
netstat -i

Kernel Interface table
Iface      MTU    RX-OK RX-ERR RX-DRP RX-OVR    TX-OK TX-ERR TX-DRP TX-OVR Flg
eth0       100      157      0    3440            94      0      0      0 BMRU
lo         65536        0      0      0      0             0      0
From the output of netstat, you can see that the number of received dropped packets (RX-DRP) is 344, indicating that packets were indeed dropped during reception at the network card. However, the question arises: why was there no packet loss when using hping3, but now with GET, it cannot be received? As mentioned before, when encountering phenomena that are difficult to understand, it is advisable to check the principles of the tools and methods used. We can compare these two tools:
- • hping3 actually only sends SYN packets;
- • curl, after sending the SYN packet, also sends an HTTP GET request. The HTTP GET is essentially a TCP packet, but compared to the SYN packet, it also carries the HTTP GET data.
From this comparison, you might think that this could be caused by an MTU configuration error. Why?
In fact, if you closely observe the output of netstat above, the second column is the MTU value for each network card. The MTU of eth0 is only 100, while the default MTU for Ethernet is 1500, making 100 seem too small. Of course, the MTU issue is easy to resolve; just change it to 1500.
ifconfig eth0 mtu 1500
# After modification, switch to terminal two and execute the curl command again to confirm whether the issue is really resolved:

curl --max-time 3 http://192.168.0.30/
# Output
<!DOCTYPE html>
<html>
...
<p><em>Thank you for using nginx.</em></p>
</body>
</html>
<span><span><span><span>It was not easy, but we finally saw the familiar </span></span></span><span><span>Nginx</span></span><span><span><span> response, indicating that the packet loss issue has been completely resolved.</span></span></span></span>