
What are the noise sources of operational amplifiers? What is the noise frequency curve? What is equivalent input noise? What is the relationship between noise and bandwidth? What is flicker noise, and what is white noise?
This article will give you a comprehensive analysis, with a lengthy text and clearly organized simulation files. Save it first, read it later.
(To obtain the simulation file, reply with the keyword in the WeChat public account: Operational Amplifier Noise)
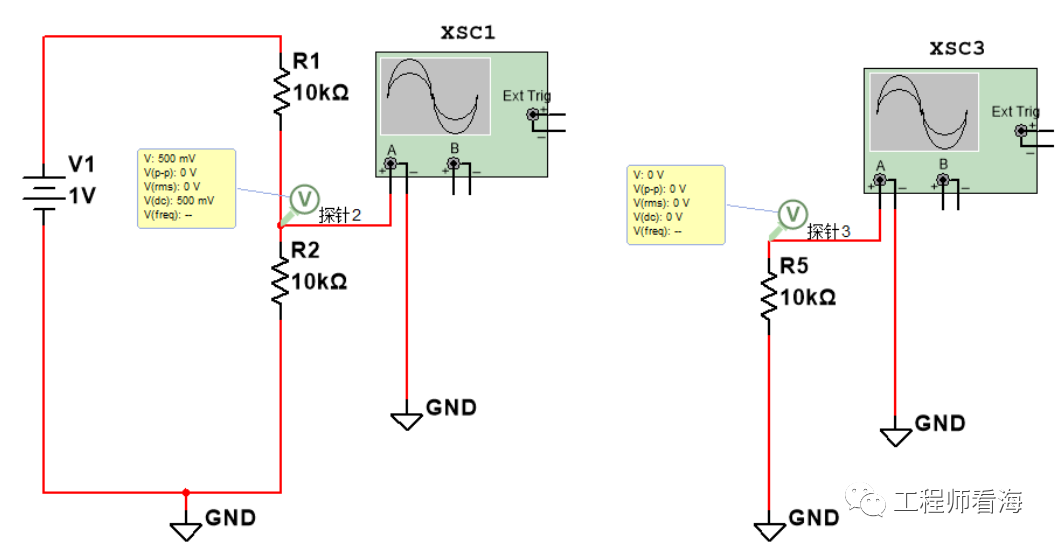
Let’s start with thermal noise from resistors. Figure 1-1 shows the simulation results of an ideal resistor using Multisim. An ideal resistor only has its resistance value as a parameter and does not consider the noise of the resistor. Two 10kΩ resistors divide a 1V DC voltage, resulting in 500mV.
-
Figure 1-1 Ideal Resistor Simulation
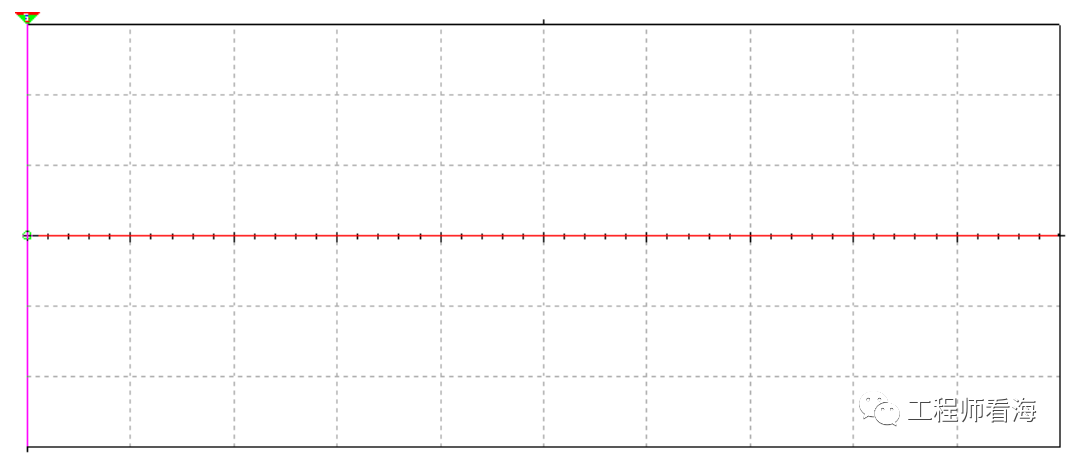
Figure 1-2 shows the simulation results. When the circuit is open, there is also no voltage across the resistor, which is 0V. Whether using a multimeter or an oscilloscope in AC mode, the AC test result is also 0V.
-
Figure 1-2 Ideal Resistor Simulation Result
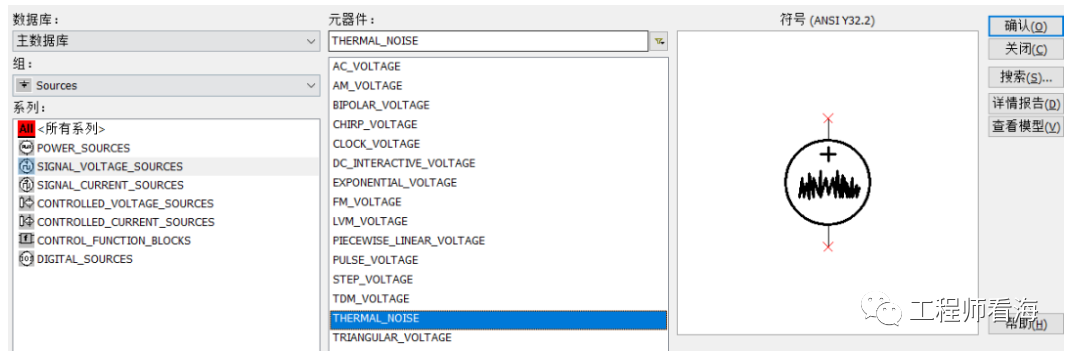
Next, we will add the thermal noise of the resistor and look at the results. The position of the resistor’s thermal noise in the library is shown in Figure 1-3.
-
Figure 1-3 Adding Resistor Thermal Noise
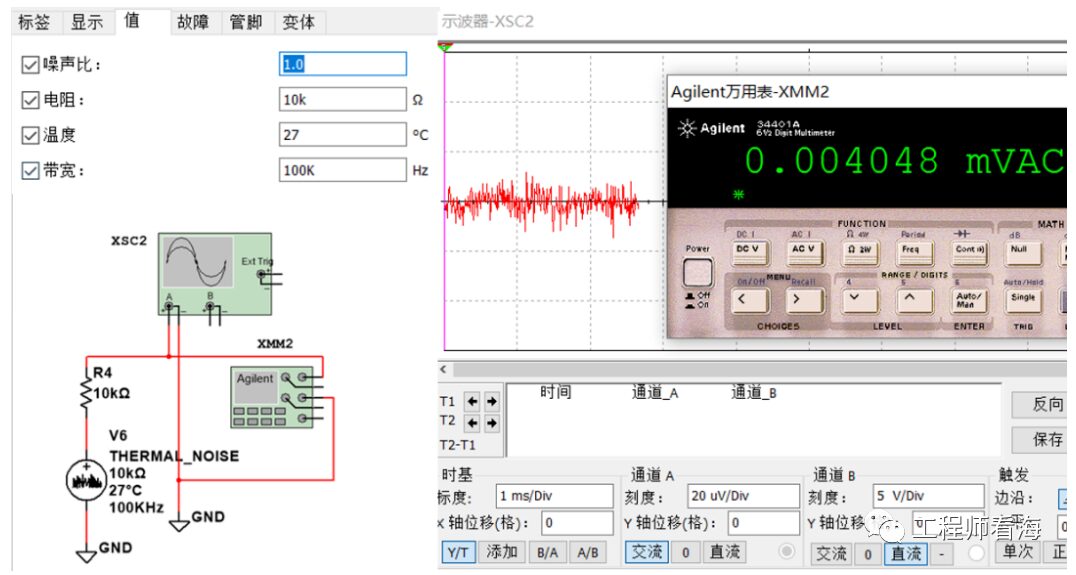
Figure 1-4 is the simulation schematic with resistor thermal noise added. The resistor is 10KΩ, and the bandwidth is 100KHz. At this time, even if the resistor is in an open state, it will still produce voltage fluctuations across its terminals, generating noise. The effective value of the voltage measured across the resistor with a multimeter in AC mode is 4uV. In a previous article titled “Where Does Resistor Noise Come From?” (https://www.dianyuan.com/eestar/article-4761.html), it was introduced that the calculation formula for thermal noise across an open resistor is as follows:
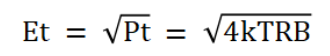
k is Boltzmann’s constant, k=1.38*10-23 J/K, T is the thermodynamic temperature in Kelvin, R is the resistance value, and B is the system’s equivalent noise bandwidth.
For example:
When the temperature is 27℃ (300 Kelvin), the effective value of the thermal noise voltage across a 10KΩ resistor in a 100KHz bandwidth amplification circuit is 4uV. This result is consistent with our simulation results. The above formula also indicates that the larger the resistor, the greater the noise. Therefore, when designing circuits based on operational amplifiers, the resistance should not be too large, typically in the KΩ range. If the resistance is large, the noise introduced by the resistor will also be significant.
-
Figure 1-4 Resistor Thermal Noise Simulation Result
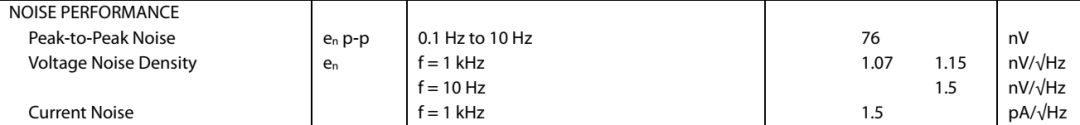
Having discussed resistors, let’s talk about operational amplifiers. Figure 1-5 shows the noise parameters of the AD8599, which mainly include three types of noise: peak-to-peak noise from 0.1Hz to 100Hz, voltage noise density above 1KHz, and current noise density. Here, we will primarily introduce low-frequency peak-to-peak noise and voltage noise.
-
Figure 1-5 Operational Amplifier Noise Parameters
Figure 1-6 shows the noise curve of the operational amplifier. Almost every operational amplifier provides such a curve. The first row is the time-domain peak-to-peak noise graph, mainly focusing on 0.1Hz-10Hz (with filtering functionality to observe only this portion of the noise). This part is dominated by flicker noise, which decreases as frequency increases and is inversely proportional to frequency, as seen in the starting position of the second row in the figure. Therefore, it is also called 1/f noise. As the frequency increases, 1/f noise decreases, and white noise becomes the dominant noise.

-
Figure 1-6 Operational Amplifier Noise Curve
The noise curve in Figure 1-6 is actually a combination of 1/f and white noise, as shown in Figure 1-7. We can calculate the magnitude of 1/f noise and white noise through the curve to assess the noise situation of the circuit.

-
Figure 1-7 Synthesis of Operational Amplifier Noise Curve
No more talk, as it may be too abstract and tedious, let’s directly use Multisim to draw the noise curve in the manual. The simulation parameters and circuit are shown in Figure 1-8, a simple follower where the output of the operational amplifier equals the input. The simulation frequency is consistent with the curve in the manual, set to 1Hz-1000Hz. (To obtain the simulation file, reply with the keyword in the WeChat public account:Operational Amplifier Noise)

-
Figure 1-8 Operational Amplifier Noise Simulation
We compare the curve in the manual with our simulated curve in Figure 1-9. Although these two curves cannot be called “exactly the same”, we can agree that they are “very similar.” For instance, at 1Hz, the noise density is approximately 5.9nV/√Hz, and at 1KHz, the noise density is approximately 1nV/√Hz. The simulation results are very close to the manual.
The simulation results actually consist of two curves: one is the input noise curve, and the other is the output noise curve. Since the simulation is a voltage follower, the noise gain (in-phase amplification factor) is 1, so the input and output are the same.
(To obtain the simulation file, reply with the keyword in the WeChat public account:Operational Amplifier Noise)

-
Figure 1-9 Operational Amplifier Noise Simulation Result 1
We set the circuit amplification factor to 10 times, and the simulation result is shown in Figure 1-10. At this time, the input noise and output noise differ by 10 times.

-
Figure 1-10 Operational Amplifier Noise Simulation Result 2
We will continue to study the 10 times amplification circuit this time. Let’s simulate the noise effective value and see how to manually calculate this effective value using the voltage curve graph. The simulation circuit and parameter settings are shown in Figure 1-11.

-
Figure 1-11 Operational Amplifier Noise Simulation Result 3
The simulation results are shown in Figure 1-12. You can see that whether it is the noise curve or the noise effective value simulation, the output and input differ by 10 times. To calculate the noise effective value, we need to calculate the effective value of white noise Uw and the effective value of 1/f noise Uf separately, and then sum their total noise contribution.
Here I will directly present the formulas:

Only 3 formulas are needed, where Uw is the effective value of white noise, Un is the effective value of 1/f noise, fb is the upper limit frequency (both in simulation and manual are 1000Hz), and fa is the lower limit frequency (both in simulation and manual are 1Hz). We need to take a closer look at how K and C are derived.
In Figure 1-12, we look at the red curve (input noise curve). The noise density value at the final stable position of the curve is K, which is approximately 4.9 nV/√Hz in the figure. According to formula 2-1, we can calculate Uw to be approximately 4.9*√(1000-1)=154.87nV.

-
Figure 1-12 Operational Amplifier Noise Simulation Result 4
What about C? In the red input noise curve of Figure 1-12, the noise density value at a frequency of 1Hz is C, which is approximately 31.32 nV/√Hz in the figure. According to formula 2-2, we can calculate Un to be approximately 31.32* √ln(1000)=82.32nV.
Thus, we obtain Uw=154.87nV and Un=82.32nV (showing that white noise contributes more than 1/f noise). According to formula 2-3, we can derive the total noise: Usum=√(284.462+82.322)=175.38nV.
The effective value of the input noise we calculated is 175.38nV, while the simulation result is 172.69nV, indicating that the simulation and calculation are basically consistent.
Similarly, we can also calculate the noise effective value when the amplification factor is 1 using the noise frequency curve from the manual. The principle is the same. Once familiar with the calculation process, we can use simulation to calculate directly without having to do step-by-step manual calculations.
(To obtain the simulation file, reply with the keyword in the WeChat public account:Operational Amplifier Noise)
That’s all for today’s content. Did you learn anything?
If you have read this far, please like, save, and share!
Limited time free scan to join the group and exchange more industry technology

Recommended Reading▼
Batteries, Power Supplies
Selected Hardware Articles
Huawei HiSilicon Software and Hardware Development Materials