
Ozone helps users quickly analyze and locate software bugs that cause CPU failures. This article explains how to use Ozone’s debugging features to gain insights into these errors on the Cortex-M architecture.
Fault Analysis Process
We will first demonstrate Ozone’s fault analysis workflow based on a sample application. The sample application can generate different types of Cortex-M faults. The project download link is https://wiki.segger.com/File:CortexM_FaultTest.zip (please copy the link to your browser to download). In the image below, the sample application is downloaded to the SEGGER Cortex-M trace reference board, with the debugging tool using J-Trace PRO. The program executes to the function _NoThumbFunc, where the PC is at the instruction that jumps to address 0. Since there is a Thumb instruction at address 0, continuing the program will cause a Cortex-M CPU fault. Let’s resume program execution and see how Ozone handles the fault.
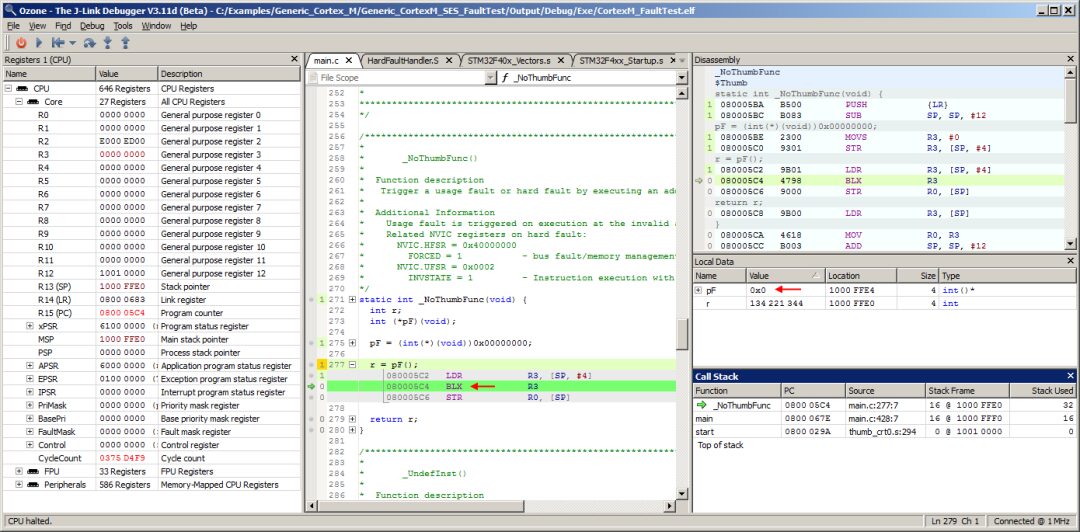
Target Exception Dialog
After clicking GO, program execution is interrupted, and Ozone pops up the target exception dialog:
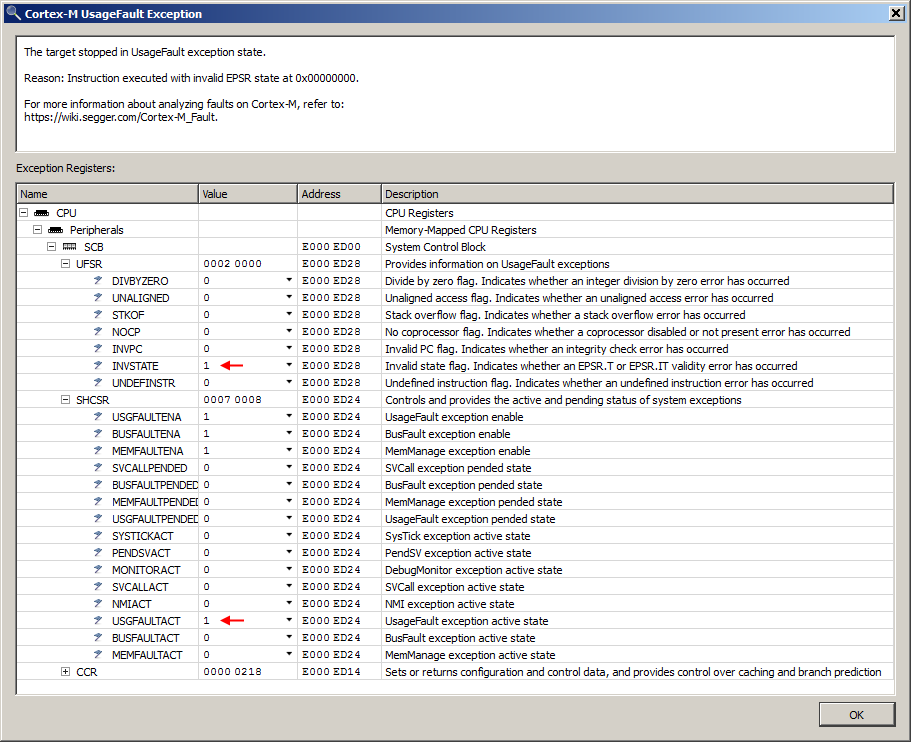
The target exception dialog describes the CPU fault and its system register context. In this case, the USGFAULTACT bit of the SHCSR register indicates that a Cortex-M UsageFault exception has occurred. The UFSR register provides the specific type of UsageFault exception that occurred. In this example, the INVSTATE bit is set, indicating that an instruction was executed in an invalid CPU state. The USGFAULTENA field indicates that the UsageFault handler is enabled; otherwise, the exception would escalate to a HardFault. The explanation of the exception register context is architecture-specific, and Ozone is designed to display as much processing information as possible through exception descriptions. When program execution halts and the target is in an exception state, the target exception dialog will be displayed.
Vector Capture
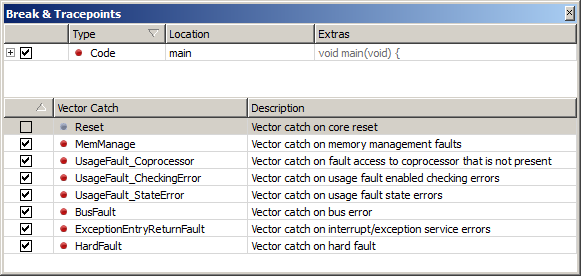
When the debugging session starts, Ozone sets to capture all Cortex-M fault vectors, interrupting execution immediately when the program enters the error handler, allowing Ozone to pop up the target exception dialog at the moment of the fault. A specific vector capture can be set or cleared through Ozone’s Break & Tracepoints window. Ozone also provides the command Break.SetVectorCatch to programmatically set the target’s vector catch status. For example, this command can be used to modify the default vector catch behavior of Ozone at the start of the debugging session, and it is used in the project script function OnProjectLoad.
Debugging Window
Use Ozone’s debugging window to further understand the fault.
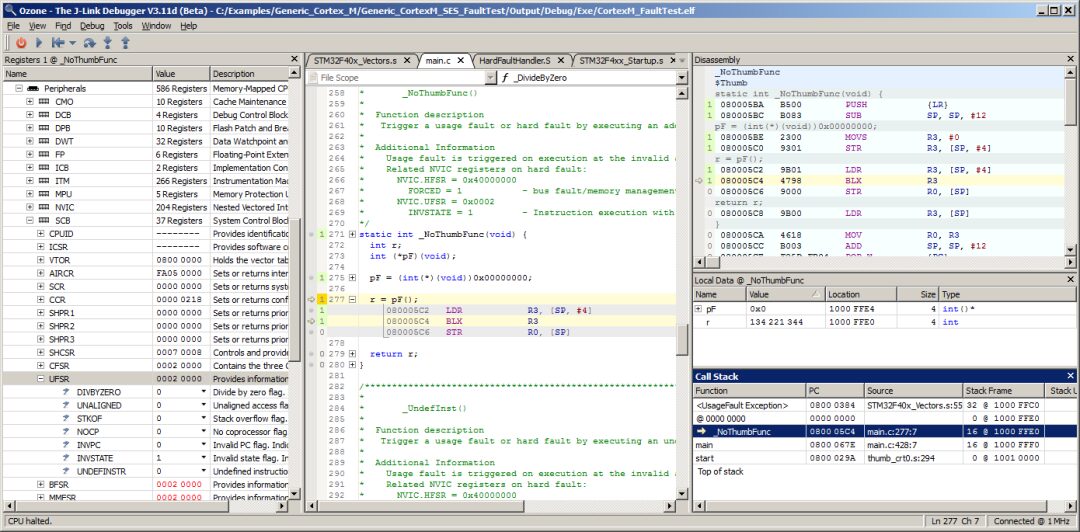
The Call Stack window indicates that the target is in a UsageFault exception state. This window also points out that the fault originated from the function _NoThumbFunc. By selecting the _NoThumbFunc call frame in the Call Stack window, Ozone’s call frame-aware debugging window will switch to the execution context of the selected frame. The Local Data window indicates that a jump to address 0 was executed in the _NoThumbFunc function, causing the CPU to execute a Thumb instruction in ARM state. Checking Ozone’s register window, the UFSR register confirms that the CPU has issued an INVSTATE UsageFault. This is the basic fault analysis workflow of Ozone.
Nesting Exceptions
Ozone can provide accurate information about nested exceptions and nested faults on Cortex-M. To demonstrate this, let’s continue debugging the sample application from the previous section. We now overwrite a single branch instruction of the UsageFault handler with an undefined instruction:
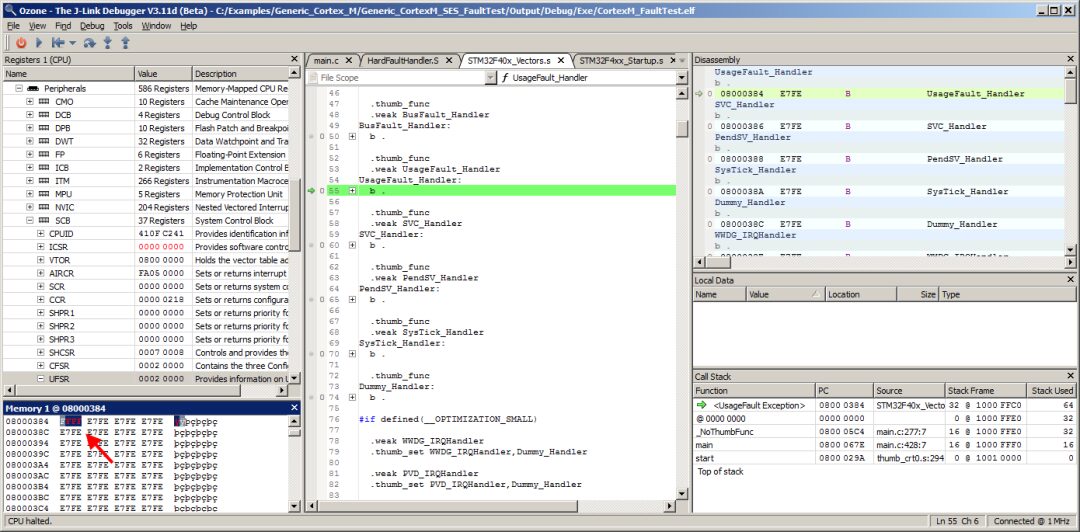
After skipping the undefined instruction at address 0x8000384, Ozone’s target exception dialog pops up again:
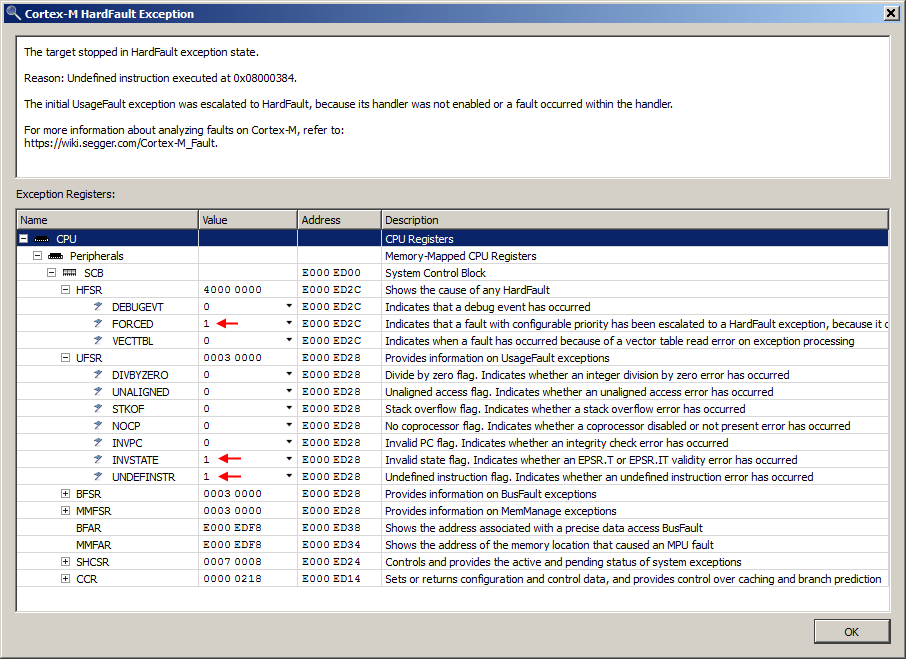
The dialog indicates that the HardFault exception has preempted the UsageFault exception. In addition to the INVSTATE register field, the UNDEFINSTR field is also set. This indicates that two types of UsageFault exceptions occurred in the call path. The HFSR register field FORCED further indicates that the UNDEFINSTR exception has escalated to a HardFault.
Since the Cortex-M CPU is now handling nested exceptions, Ozone’s Call Stack window updates accordingly:
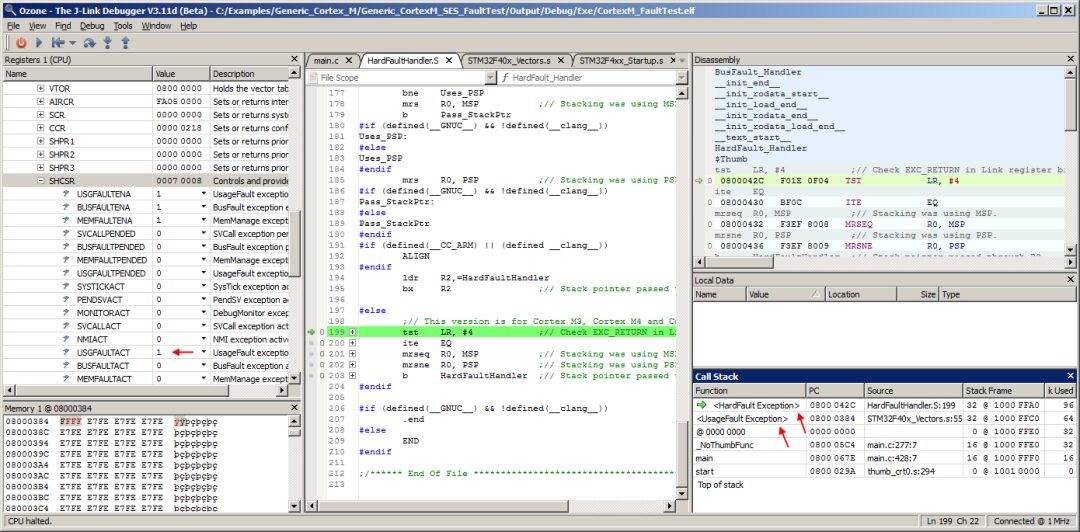
Nesting Exceptions on Multiple Stacks
Information about nested exceptions can occupy two stacks, as shown in the next example, where Ozone is able to provide accurate call stack and local data information. In this case, program execution has stopped at the SVC instruction at the fifth level of the call stack:
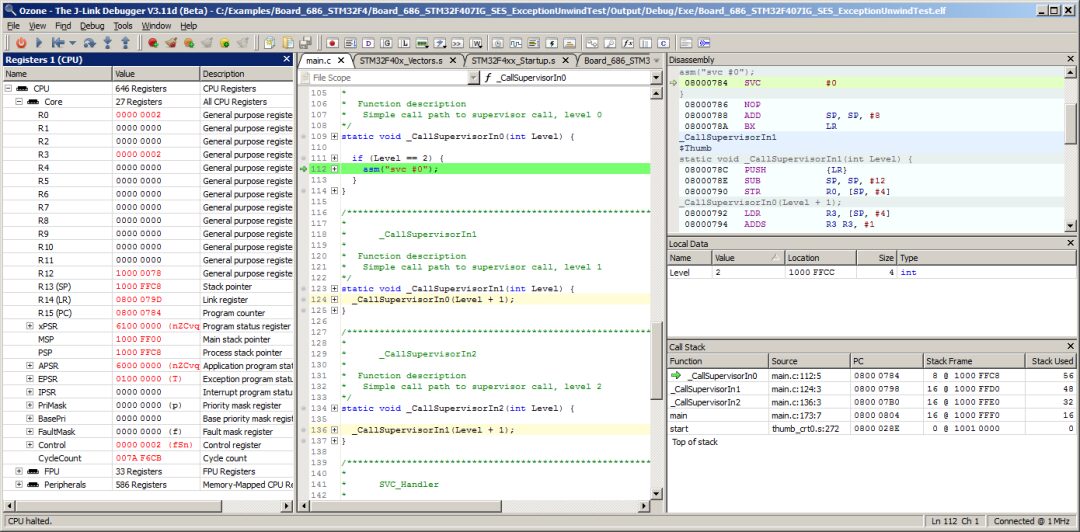
After executing the SVC call, an additional function call path was executed in handler mode. The application is now stopped at a load instruction that is about to load from invalid address 0x100000:
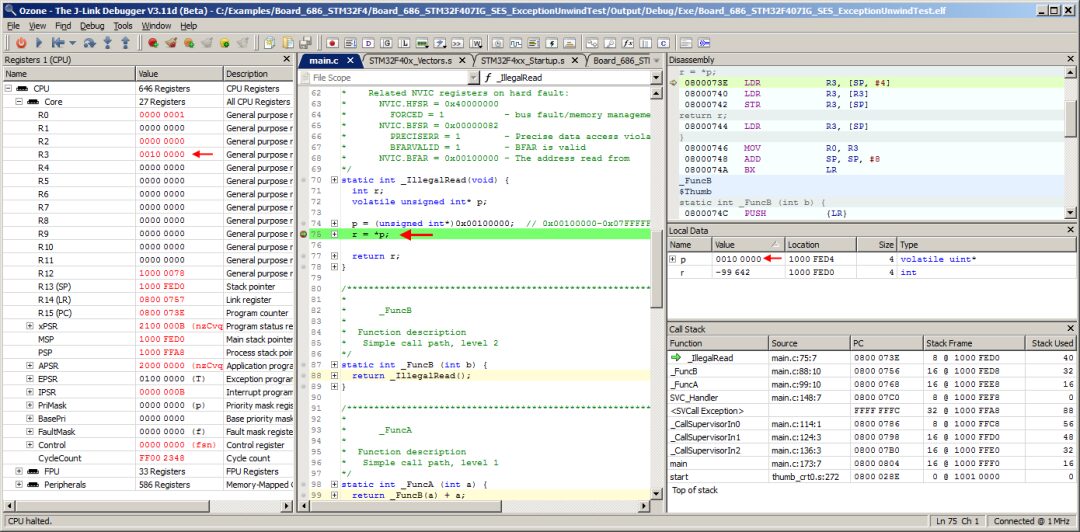
At this point, Ozone’s Call Stack window indicates that a stack switch has occurred. From the stack Used value of 0 in the table, users can see:
The upper call frames, including SVC_Handler, are on the main stack.
The lower call frames, including SVCall Exception, are on the process stack.
Currently, 40 bytes of the main stack and 88 bytes of the process stack are used.
Note that Ozone brackets target-specific call frames with angle brackets. Continuing program execution will show how Ozone handles the imminent fault. After resuming program execution, the target exception dialog immediately pops up, indicating a HardFault exception:
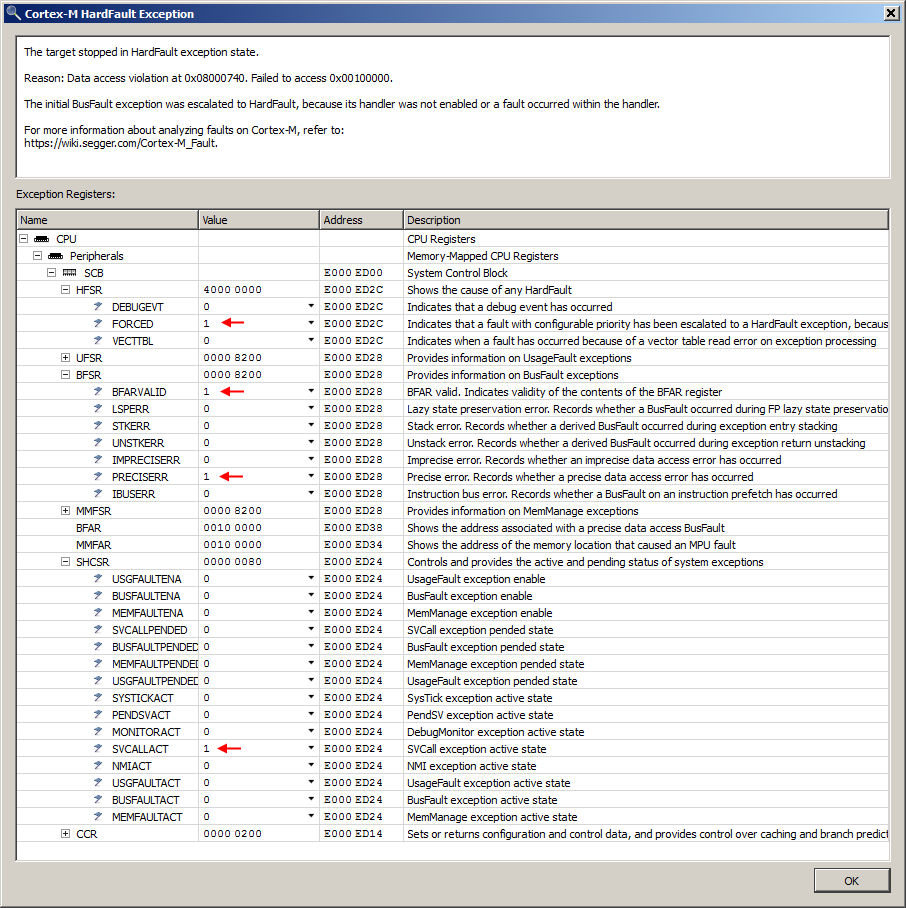
Since the BusFault exception handler is not enabled, the Cortex-M escalates the BusFault exception to a HardFault. The PRECISERR register field indicates that a precise BusFault exception has occurred. The BFARVALID field indicates that the memory access address of the erroneous load/store instruction is available. Ozone integrates all this information into the exception description in the top area of the target exception dialog. The SVCALLACT field further indicates that an SVC handler has been preempted by the current exception.
Close the target exception dialog and use Ozone’s debugging window to further investigate the fault.
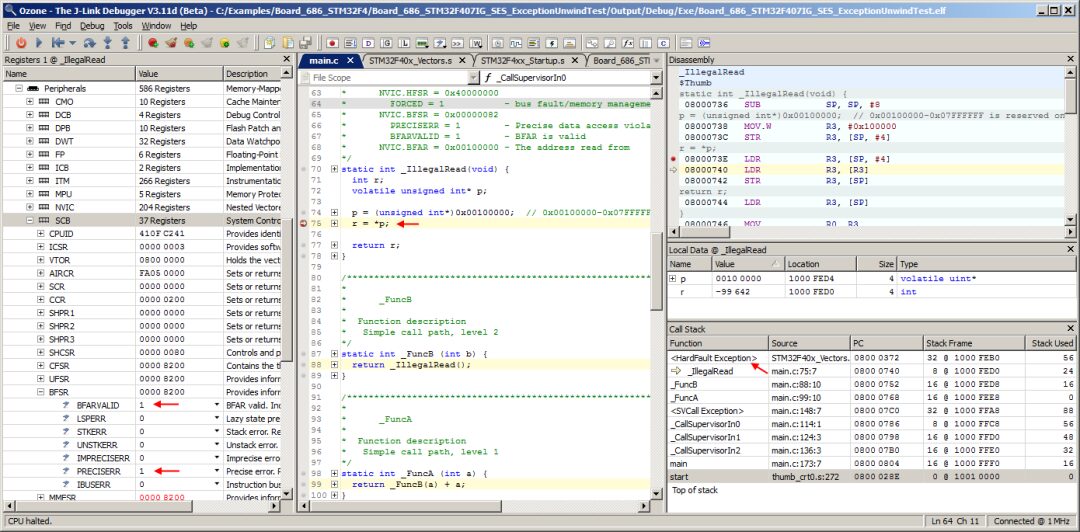
As shown in the figure above, Ozone’s call frame-aware debugging window provides a clear picture of the fault: The Local Data window shows an invalid value for the dereferenced data pointer. The Call Stack window displays the complete program execution path, tracking multiple nested exceptions and the CPU stack. Users can query the same information in the register window.
Using Trace to Analyze Faults
In imprecise fault scenarios, when the Cortex-M core cannot provide the exact PC of the fault instruction, Ozone’s trace window can be used to quickly identify the fault instruction and determine the cause of more complex faults, especially imprecise faults.
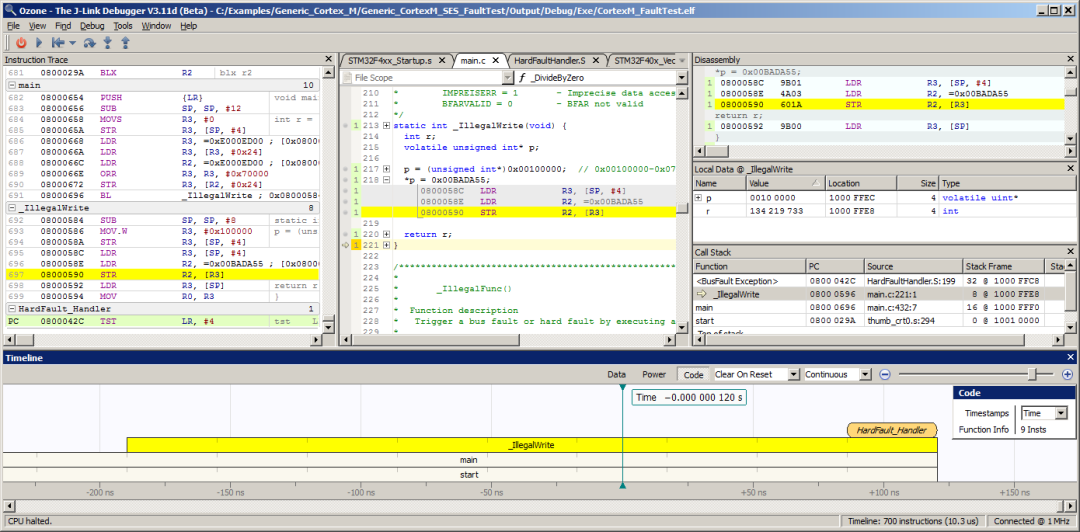
As shown in the figure above, using Ozone’s backtrace feature, it is easy to trace the imprecise BusFault exception back to the erroneous store instruction.
Ozone is a debugger aimed at embedded applications. With Ozone, you can debug embedded applications at the C/C++/Rust source code and assembly level. Ozone is closely integrated with J-Link and J-Trace, providing rich debugging analysis capabilities.
BMR Tech provides commercial licensing services for Ozone, with extensive knowledge and experience in software development and debugging tools. For inquiries, please contact [email protected].
Welcome to follow our WeChat public account【BMR Tech】, reply “Join Group” to join the technical exchange group
Product inquiries:
Beijing: 010-62975900
Shanghai: 021-62127690
Shenzhen: 0755-82977971
 Share, Like, and Comment, at least I want to have one