Written in advance: The main compilation of this illustrated content comes from “A Little Steamed Bun” (not fully confirmed), with edits made, hereby declared. As the new year begins, it’s really busy (just excuses =.=), hope everyone is busy and prosperous in 2024~!
1. Basic Principles of Reverse Osmosis
Reverse Osmosis (RO) is a common water treatment purification technology. By applying high pressure to the feed water and the reverse osmosis membrane, water flows from one side of the membrane (the feed side) to the other side (the product side). Most other components in the feed water, such as dissolved salts, particles, bacteria, and pyrogens, remain on the feed side of the membrane and are ultimately discharged as wastewater.
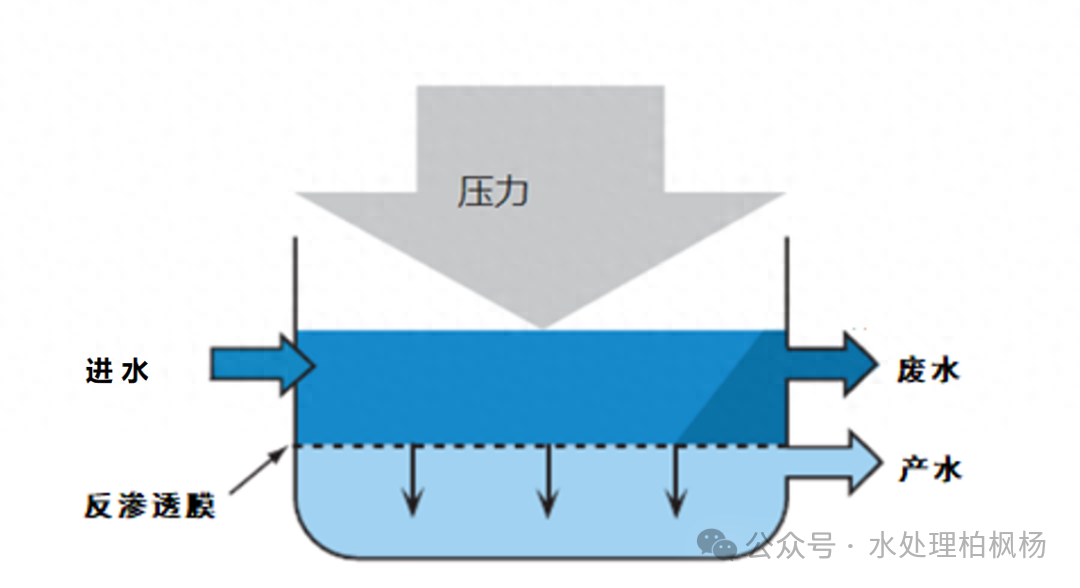
Figure 1: Principle of Reverse Osmosis Membrane
Why is it called reverse osmosis?
In a natural state, water flows from a dilute solution to a concentrated solution across a semi-permeable membrane, but when we apply a sufficiently large pressure on the concentrated solution side, water will flow from the concentrated solution back to the dilute solution. This reverse flow of the solvent is opposite to the original direction of osmosis, hence it is called reverse osmosis.
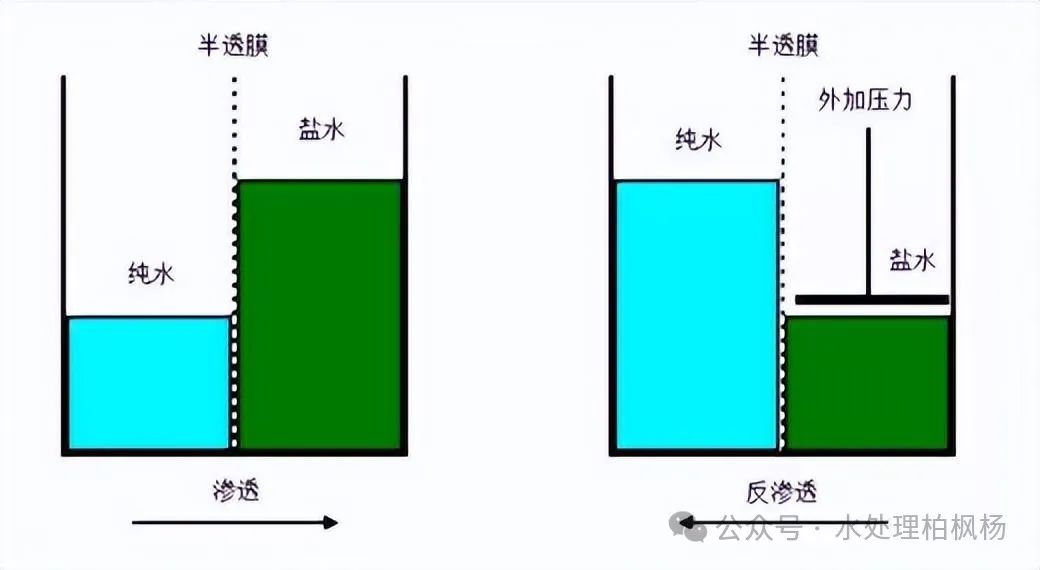
Figure 2: Schematic Diagram of Reverse Osmosis (Image from the Internet)
2. Structure and Working Principle of Spiral-Wound Reverse Osmosis Membrane
① Structure of Spiral-Wound Reverse Osmosis Membrane
The reverse osmosis system consists of an external membrane housing and an internal spiral-wound reverse osmosis membrane. To understand the spiral-wound reverse osmosis membrane, we first need to know the structure of a reverse osmosis membrane.
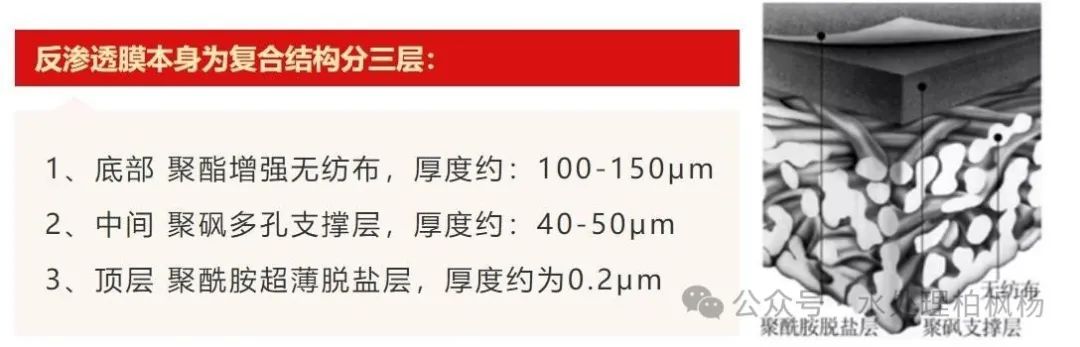
Figure 3: Schematic Diagram of Three Layers of Reverse Osmosis Membrane
A single three-layer reverse osmosis composite membrane, while being the soul of the entire system, does not form the “spiral” membrane we see. In fact, a typical “roll” of reverse osmosis membrane is mainly composed of five structures: end caps at both ends, a central tube, O-rings, the reverse osmosis membrane, and the feed/product water separation grid.
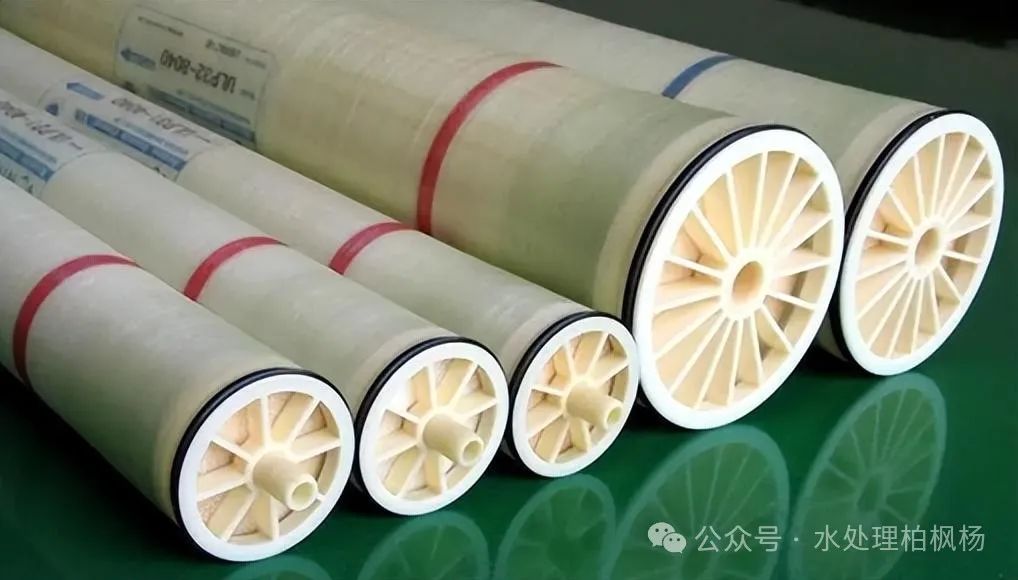
Figure 4: Appearance of Spiral-Wound Reverse Osmosis Composite Membrane
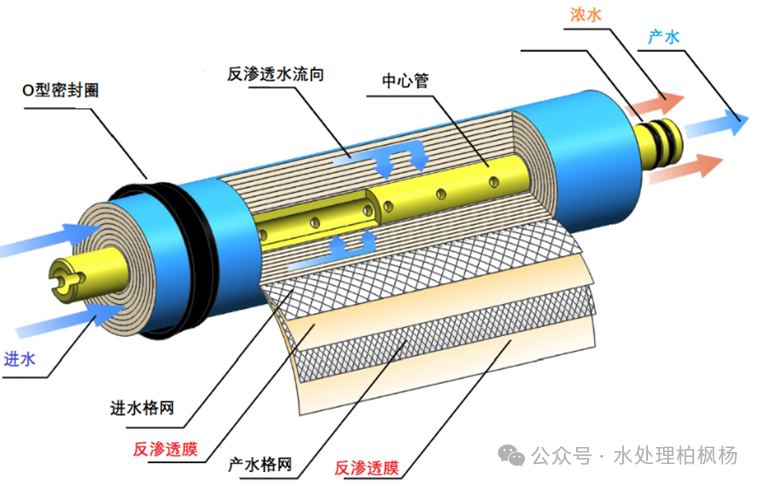
Figure 5: Basic Structure of Spiral-Wound Reverse Osmosis Membrane
Multiple reverse osmosis membranes and the product/feed water grid are stacked one after another, sealed with glue at their edges, and then rolled around the central tube. The grid layer provides channels for raw water inflow and product water outflow, preventing the RO membrane sheets from sticking together, while the reverse osmosis membrane layer is responsible for desalting and filtering the feed water.
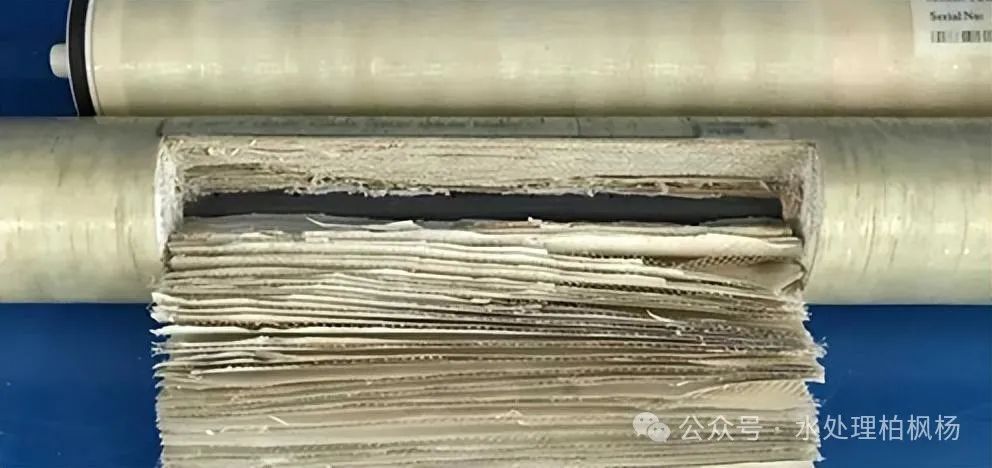
Figure 6: Layered Structure of Spiral-Wound Reverse Osmosis Membrane
② Working Principle of Reverse Osmosis Membrane
The raw water enters the reverse osmosis membrane through the feed water grid, and under pressure, water filters through the layers of membrane sheets. The water that passes through the reverse osmosis membrane is directed into the central tube by the product water grid, ultimately forming RO water (Figure 7 Green), while the part of the concentrate with impurities cannot pass through the reverse osmosis membrane and is discharged along the concentrate path (Figure 7 Orange).
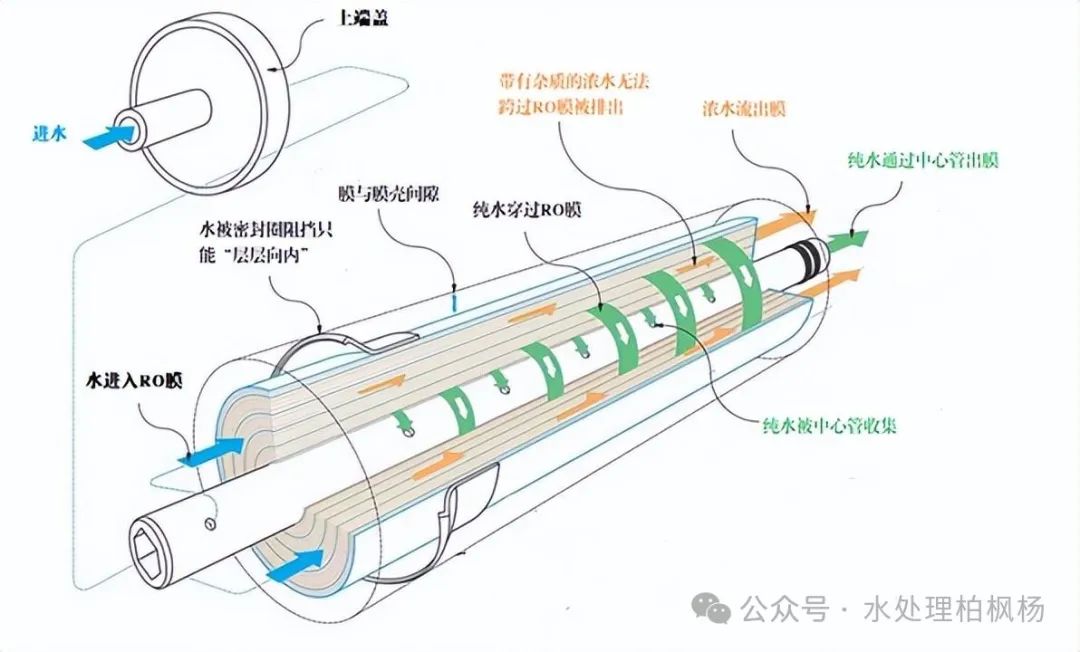
Figure 7: Working Principle of Reverse Osmosis
3. Main Performance Indicators of Reverse Osmosis Membrane The core indicators of the reverse osmosis system include desalination rate, water production rate/membrane flux, and recovery rate.
① Desalination Rate (SR)

The desalination rate is an important technical indicator of reverse osmosis membrane performance, representing the membrane’s ability to remove salts. The term “salt” here is not limited to NaCl, but refers to various ions and chemical pollutants (see Figure 9). With the same salinity of feed water, the higher the desalination rate, the lower the salt content in the product water, indicating better performance of the reverse osmosis membrane.
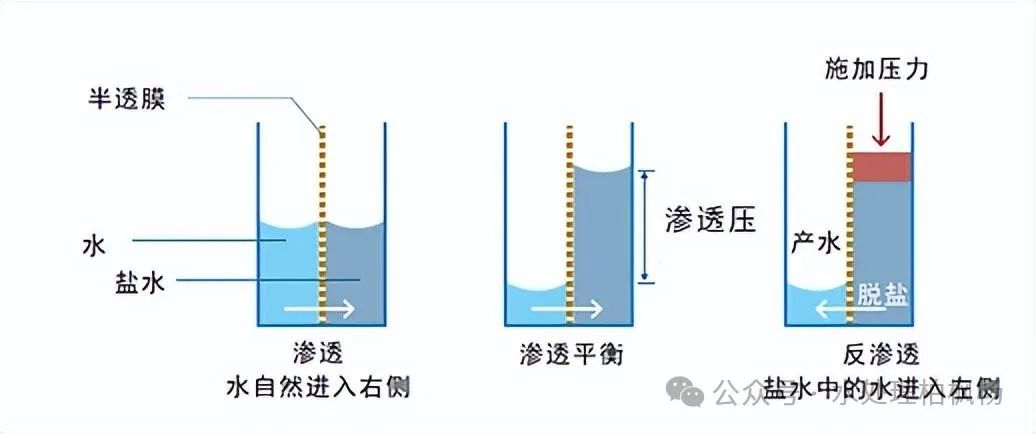
Figure 8: Schematic Diagram of Reverse Osmosis Desalination
The standard desalination rate of a reverse osmosis membrane depends on the density of the ultra-thin desalination layer on the membrane element surface; the denser the layer, the higher the desalination rate, but the lower the water production rate. However, actual working conditions differ from nominal test conditions, and the actual desalination rate of reverse osmosis membranes fluctuates and is lower than the standard desalination rate.
RO membranes have different desalination rates for different substances, mainly determined by the structure and molecular weight of the substances. The desalination rate for divalent ions can exceed 99%, for monovalent ions over 98%, and for organic compounds with a molecular weight greater than 100, the removal rate exceeds 98%, but for small molecular weight organic compounds, the removal rate is slightly lower. Common ion desalination rates are as follows:
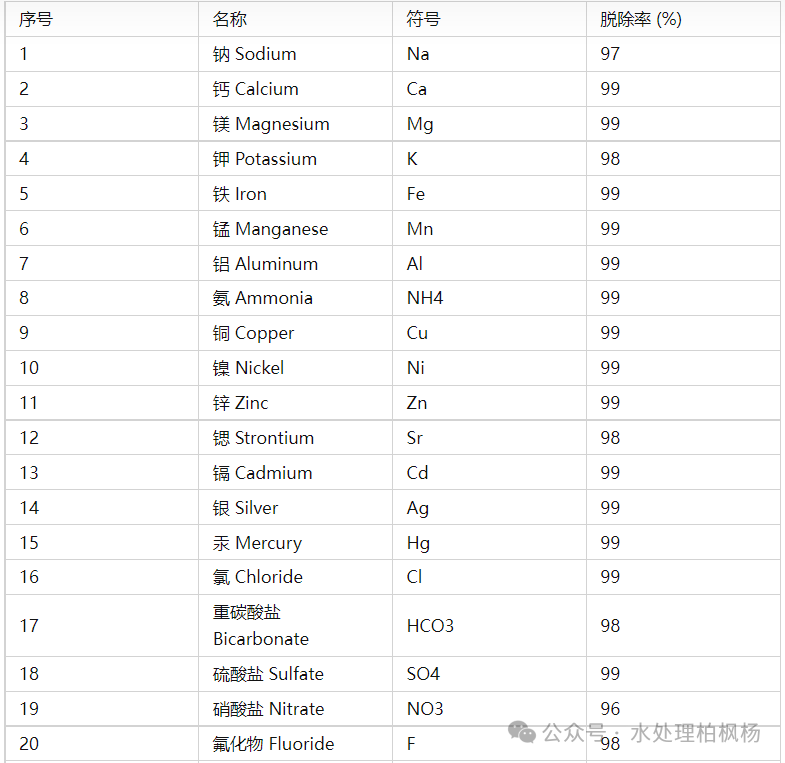
Figure 9: Common Ion Desalination Rates (from a specific model manual of Haide Energy)
In general, for RO membranes: organic substances are easier to remove than inorganic substances, for electrolytes: divalent ions are easier to remove than monovalent ions, and for non-electrolytes: the larger the molecule, the easier it is to remove.
② Water Production Rate/Membrane Flux

The water production capacity of the reverse osmosis membrane, also known as membrane flux, is the amount of water passing through the RO membrane per unit time, usually expressed in t/h. Here, we need to understand two important terms: permeate flow rate (GDF), which is the liquid permeability rate of the reverse osmosis membrane per unit area. Many factors that affect the water production rate of reverse osmosis membranes change the water production rate by influencing the permeate flow rate. The higher the permeate flow rate, the higher the water production rate; correspondingly, the salt flux of the membrane, which is the rate of salt passing through the reverse osmosis membrane per unit time and area, is a factor affecting the desalination rate of reverse osmosis membranes. The higher the salt flux, the lower the desalination rate. The maximum permeate flow rate is related to the membrane’s pore size, material, and process; theoretically, the higher the GDF, the greater the water production rate, but if it is too high, the water flow speed and flow rate in the vertical direction of the membrane may increase, which can accelerate membrane fouling and pollution.
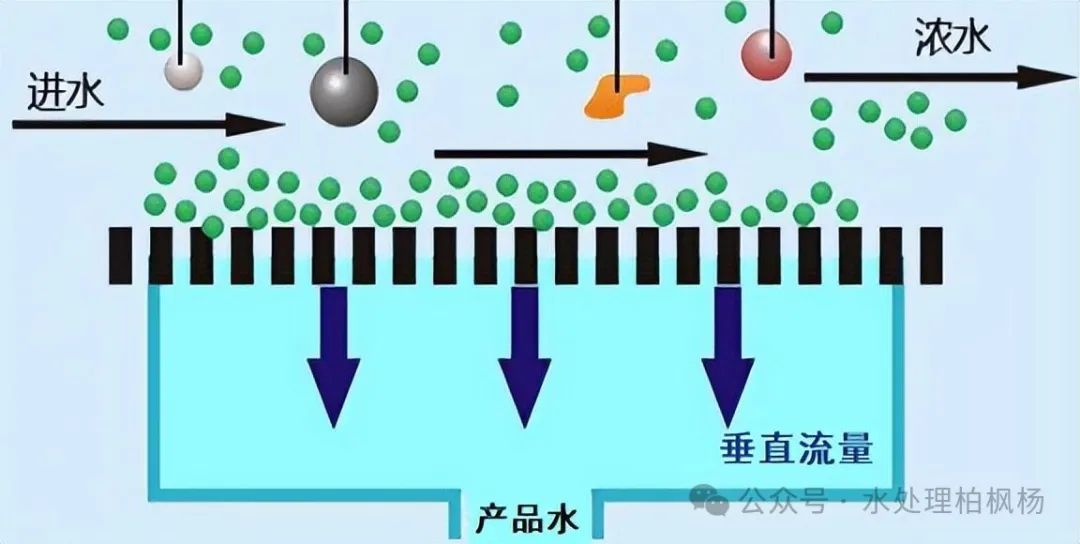
Figure 10: Schematic Diagram of Water Flow Direction in Reverse Osmosis System
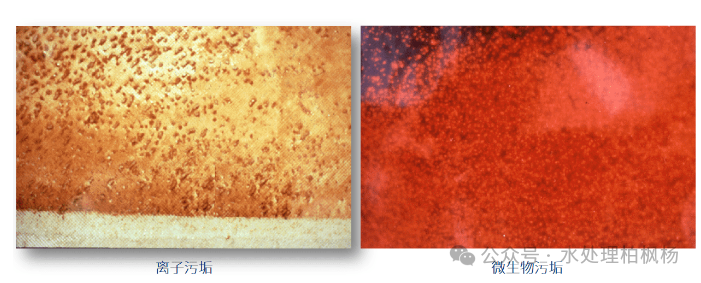
Figure 11: Fouling of Reverse Osmosis Membrane
③ Recovery Rate (R)

The recovery rate refers to the percentage of feed water converted into product water in the membrane system, which can be adjusted by changing the pressure of the RO membrane. Here, it is emphasized that we are not concerned with the recovery rate of the reverse osmosis membrane itself, but with the overall recovery rate of the entire system.
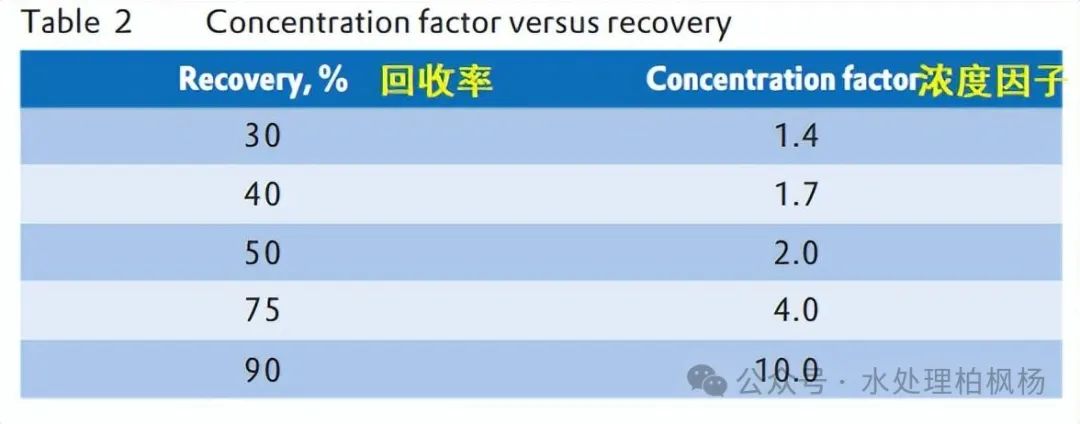
Figure 12: Relationship Between Recovery Rate and Concentration Factor
From Figure 12, it can be seen that as the recovery rate increases, the concentration factor on the membrane surface rises rapidly; at a recovery rate of 90%, the concentration factor increases sharply. Generally speaking, the recovery rate of water treatment systems is around 50% to 75%, and should not be too high or too low. Too low leads to serious waste of water resources, while too high concentrates the feed water, affecting the quality of the product water, and can easily lead to scaling of the reverse osmosis membrane, severely affecting the membrane’s lifespan.
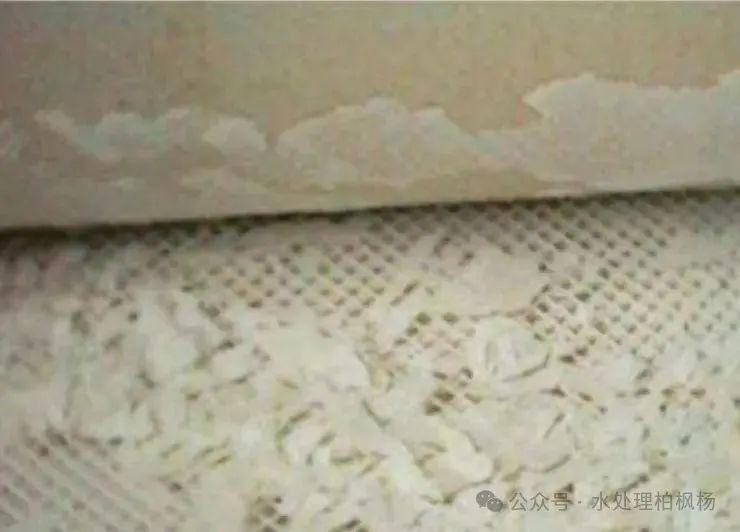
Figure 13: Scaling of Reverse Osmosis Membrane (Calcium Carbonate/Sulfate)
4. Factors Affecting Water Production Rate and Desalination Rate of Reverse Osmosis Membrane
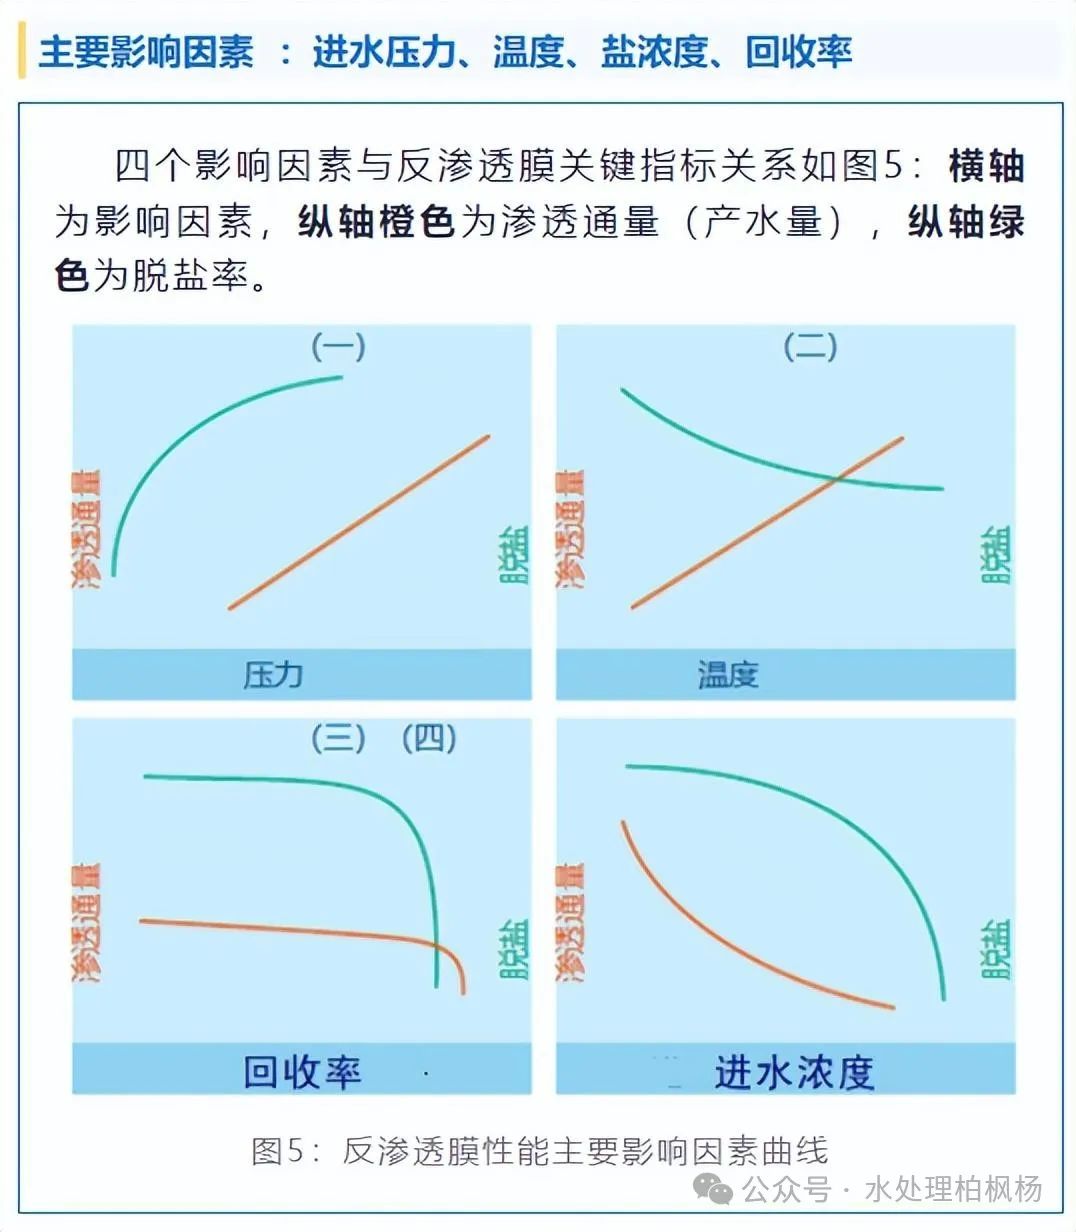
Everyone is familiar with the saying “the higher the pressure, the greater the water production rate” and “for every 1°C increase in temperature, the water production rate changes by 3%”, but the reasons behind these statements may not be fully understood.
① Pressure
Pressure is a direct factor affecting water production rate; the water production rate is basically proportional to the working pressure of the membrane because increasing pressure directly enhances the driving force for water to pass through the membrane, leading to a linear increase in water production rate, which is easy to understand. However, the effect of pressure on the desalination rate is different; as pressure increases, the change in desalination rate is relatively gentle. Why is that? Here, we raise an interesting question: why does the desalination rate increase with rising pressure?
Are more salts being retained? In fact, not at all; within a certain pressure range, the feed water pressure has little effect on the amount of salt passing through. However, as pressure increases, the water production rate rises, diluting the salt content of the reverse osmosis water, which passively induces an increase in desalination rate.
But as pressure continues to increase, the salt concentration difference across the membrane increases, and at a certain pressure, the amount of salt passing through the membrane inevitably increases due to concentration polarization, which partially offsets the dilution effect brought by the increased water production rate, causing the salt content of the product water to no longer decrease, and the desalination rate tends to stabilize.
What is concentration polarization?
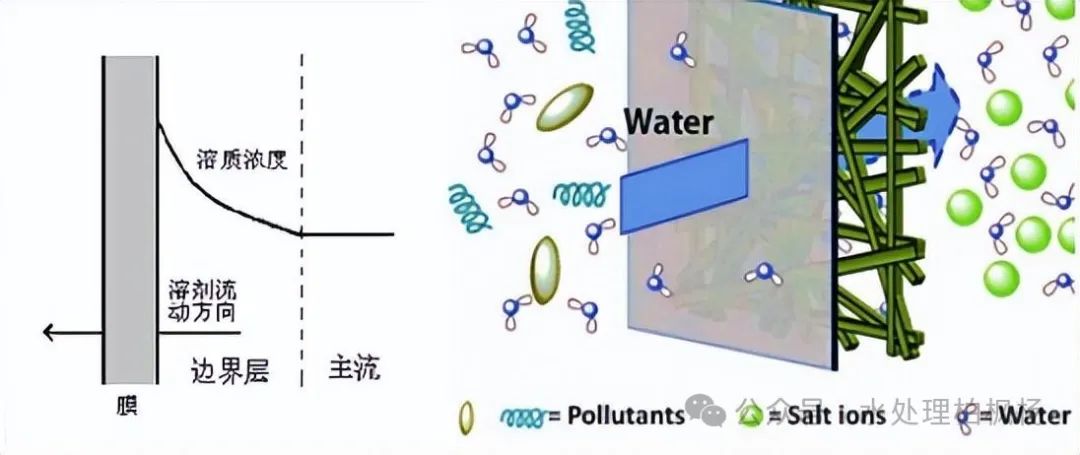
During the reverse osmosis separation process, after water molecules pass through, the salt content on the membrane surface increases, forming a high-concentration layer of concentrate, which creates a steep concentration gradient with the water flow. This phenomenon is called membrane concentration polarization. Concentration polarization increases the osmotic pressure on both sides of the membrane; under the same pressure, the net driving force of the system decreases, leading to a drop in water flux. Meanwhile, because concentration polarization increases the salt concentration difference on both sides of the membrane, the salt flux will rise, continuously degrading system performance.
② Temperature
Temperature and reverse osmosis can be described as a love-hate relationship; even the most capable RO membranes become sluggish in winter. In fact, the temperature of the feed water does not directly affect the performance of reverse osmosis membranes but affects the viscosity of water: as water temperature rises, viscosity decreases, and the permeate flow rate of the membrane increases, leading to higher water production rates.
The famous 3% theory originates from a formula: the permeate flow rate of the membrane is influenced by the temperature correction factor (TFC), where for every 1°C increase, TFC increases by 1.03 times, and the permeate flow rate rises by 3%.
P2=P1×TFC
TFC = (1.03)(t1-t2)
In the graph, you can also see that as temperature rises, the desalination rate decreases. This is because as temperature increases, the mass transfer coefficient of solutes increases, in simple terms, salts diffuse faster, which inevitably leads to a decrease in desalination rate.
Temperature has a significant impact on membrane water production; generally, the nominal water production rate of RO membranes is based on 25°C. When purchasing water treatment, this becomes a “word game”. For example, water treatment equipment rated at 2400L/h at 25°C is not the same concept as 2400L/h at 10°C.
③ Feed Water Concentration
The higher the salt content in the feed water, the higher the osmotic pressure on the feed side, which reduces the pressure difference across the membrane, directly decreasing the driving force and leading to a lower water production rate. At the same time, the higher the feed concentration, the greater the concentration difference across the membrane, which increases the amount of salt passing through the membrane into the product water, resulting in a decrease in desalination rate.
④ Feed Water pH
The pH of the feed water does not affect the water production rate of reverse osmosis membranes, but it has a significant impact on the desalination rate. How does pH affect the desalination rate of RO membranes? In nature, CO2 can partially dissolve in water, which is a reversible chemical reaction.
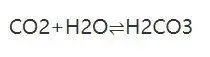
Under acidic conditions, CO2 exists in water in gaseous form, while under alkaline conditions, it exists in the form of carbonate and bicarbonate ions.
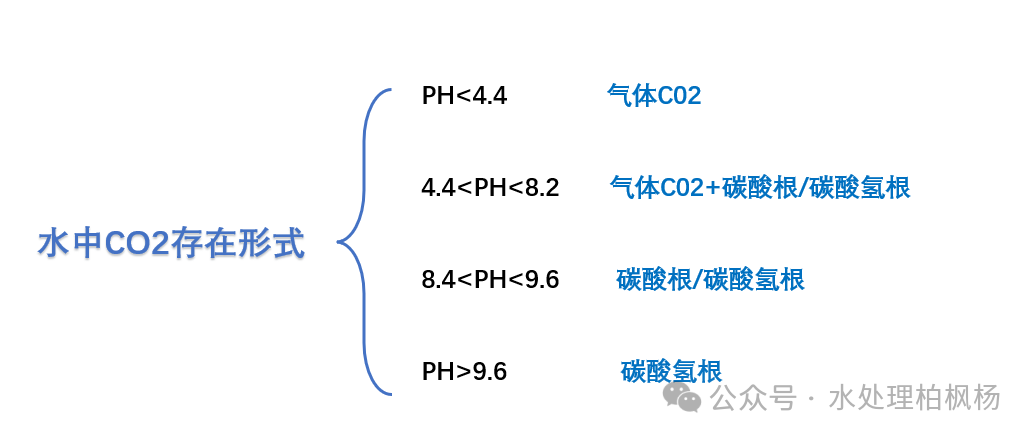
Figure 14: Relationship Between CO2 Forms in Water and pH Value
Reverse osmosis membranes have a higher removal rate for monovalent/divalent ions, meaning that ions formed under alkaline conditions are more easily removed. However, under slightly acidic conditions, CO2 gas can pass directly through the membrane. Therefore, the higher the pH of the feed water, the higher the desalination rate of the reverse osmosis membrane. When the pH is particularly high, RO membranes are prone to fouling, which can actually lead to a decrease in desalination rate. The GB5749-2022 “Sanitary Standards for Drinking Water” stipulates that the pH of tap water should be between 6.5 and 8.5.
⑤ Recovery Rate
Increasing the system recovery rate raises the membrane pressure and increases the water production rate, but it also leads to the concentration of solutes on the surface of the reverse osmosis membrane, i.e., the increase in salt concentration, which results in more salt passing through the membrane and a decrease in desalination rate. Moreover, if the salt concentration becomes too high and exceeds its solubility, the RO membrane will foul, severely affecting its performance and lifespan.