Having worked in operations for several years, I still remember when I first started; I only knew how to use some basic commands, and when writing scripts, I kept them as simple as possible, which often resulted in long and messy scripts.
If I had known some advanced commands, such as the xargs command, pipe commands, and automated response commands, I could have written more concise and efficient scripts.
For whatever reason, I want to explain the usage of some advanced Linux commands, benefiting both myself and others, so that I can refer back to them in the future if I forget.
1. Practical xargs Command
In my regular usage, I find the xargs command to be quite important and convenient. We can use this command to pass the output of one command as arguments to another command.
For example, if we want to find files ending with .conf in a certain path and categorize them, the usual approach would be to first find the files ending with .conf, output them to a file, then cat that file and use the file command to categorize the output files.
This ordinary method can indeed be a bit cumbersome, and that’s where the xargs command comes in handy.Example 1: Find files ending with .conf in the / directory and categorize themCommand: # find / -name *.conf -type f -print | xargs fileOutput results are as follows:
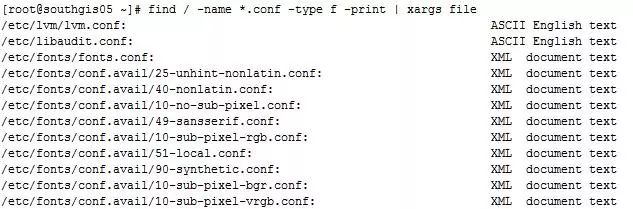
After xargs, you can not only add file classification commands but also many other commands. For instance, with the tar command, you can use the find command in conjunction with tar to find specific files in a designated path and then package them directly with tar. The command is as follows:
# find / -name *.conf -type f -print | xargs tar cjf test.tar.gz
2. Running Commands or Scripts in the Background
Sometimes when we perform certain operations, we do not want our operations to terminate when the terminal session disconnects, especially for database import and export operations. If large amounts of data are involved, we cannot guarantee that our network will not have issues during our operations, so running scripts or commands in the background is a significant safeguard for us.
For example, if we want to run a database export operation in the background and log the command’s output to a file, we can do it like this:nohup mysqldump -uroot -pxxxxx –all-databases > ./alldatabases.sql & (xxxxx is the password)
Of course, if you do not want the password in plain text, you can do it like this:nohup mysqldump -uroot -pxxxxx –all-databases > ./alldatabases.sql (without adding the & symbol at the end)
After executing the above command, it will prompt you to enter the password. After entering the password, the command will still run in the foreground, but our goal is to run the command in the background. At this point, you can press Ctrl+Z and then type bg to achieve the effect of running the command in the background while also allowing for hidden password input.
The result of the command running in the background will leave a nohup.out file in the current directory where the command was executed, and you can check this file to see if there were any execution errors.
3. Finding Processes with High Memory Usage in the Current System
In many operations, we find that memory usage is quite high. So how can we find and sort the processes consuming the most memory?Command: # ps -aux | sort -rnk 4 | head -20
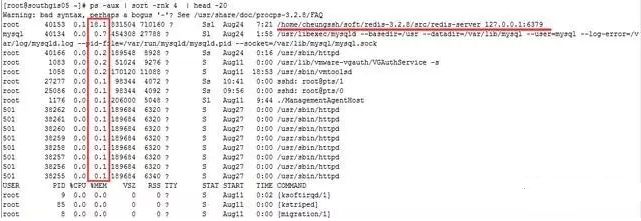
The 4th column of the output is the percentage of memory usage, and the last column corresponds to the process.
4. Finding Processes with High CPU Usage in the Current System
In many operations, we find that CPU usage is quite high. So how can we find and sort the processes consuming the most CPU?Command: # ps -aux | sort -rnk 3 | head -20
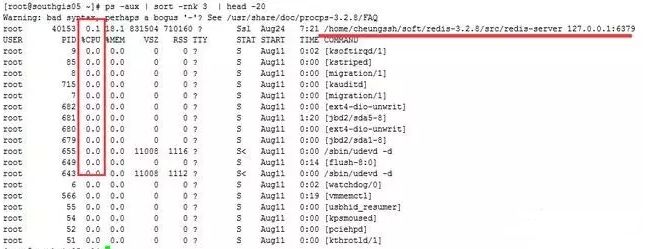
The 3rd column of the output is the percentage of CPU usage, and the last column corresponds to the process.
You may have noticed that the 3 and 4 after the sort command represent sorting by the 3rd and 4th columns, respectively.
5. Viewing Multiple Logs or Data Files Simultaneously
In daily work, we might use the tail command to view log files one by one in separate terminals, with one terminal for each log file. I, too, have done this, but sometimes it feels a bit cumbersome. There is actually a tool called multitail that allows you to view multiple log files simultaneously in the same terminal.
First, install multitail:
# wget ftp://ftp.is.co.za/mirror/ftp.rpmforge.net/redhat/el6/en/x86_64/dag/RPMS/multitail-5.2.9-1.el6.rf.x86_64.rpm
# yum -y localinstall multitail-5.2.9-1.el6.rf.x86_64.rpm
The multitail tool supports text highlighting, content filtering, and many more features you might need.
Here’s a useful example: at this time, we want to view the secure log while filtering for specific keywords and also want to see real-time network ping status:Command: # multitail -e “Accepted” /var/log/secure -l “ping baidu.com”
# multitail -e “Accepted” /var/log/secure -l “ping baidu.com”
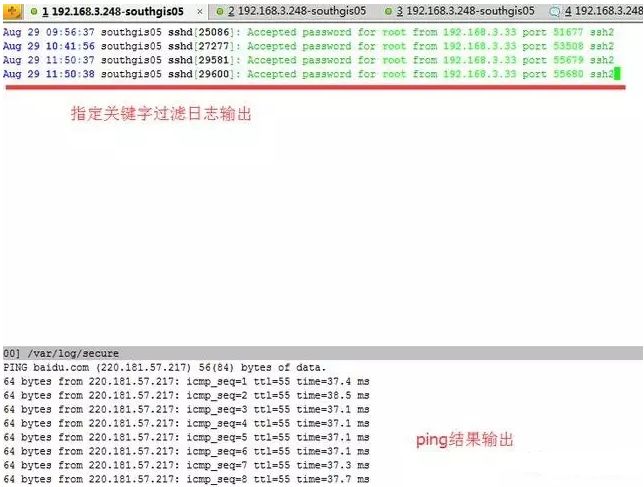
Isn’t that convenient? If we want to check the correlation between two logs, we can observe whether the log outputs trigger each other. Switching between two terminals can be a bit time-consuming, so using the multitail tool is a good method.
6. Continuous Ping and Logging Results
Often, operations hear the question, “Is there a problem with the network?” leading to strange symptoms in the business. It’s often blamed on server network issues. This is commonly referred to as scapegoating; when business issues arise, the relevant personnel often cannot find the cause and will attribute the problem to server network issues.
At this point, if you ping a few packets and show the results, people might counter that there was just a problem for a short time, and now everything is back to normal, so the network must be fine. This can be quite frustrating.
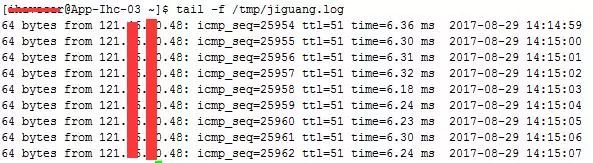
If you present data from network monitoring tools like Zabbix, it may not be appropriate, as you cannot set Zabbix to collect data every second. I have encountered this issue, and I used the following command for ping monitoring:
Then, when someone tries to scapegoat me, I can extract the ping database for the time period when the issue occurred, and we can discuss it openly. That time, I managed to turn the tables, and they no longer dared to scapegoat me.
Command: ping api.jpush.cn | awk ‘{ print $0 ” ” strftime(“%Y-%m-%d %H:%M:%S”, systime()) }’ >> /tmp/jiguang.log &The output will be recorded in /tmp/jiguang.log, with a new ping record added every second, as shown below:
7. Checking TCP Connection Status
Specify to check the TCP connection status on port 80, which is helpful for analyzing whether connections are released or for status analysis during attacks.
Command: # netstat -nat | awk ‘{print $6}’ | sort | uniq -c | sort -rn

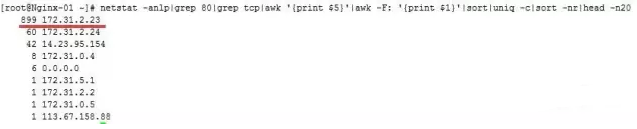
8. Finding the Top 20 IPs with the Most Requests to Port 80
Sometimes when the request volume for a business suddenly increases, we can check the source IPs of the requests. If they are concentrated on a few IPs, there may be an attack. We can use a firewall to block them. The command is as follows:
# netstat -anlp | grep 80 | grep tcp | awk ‘{print $5}’ | awk -F: ‘{print $1}’ | sort | uniq -c | sort -nr | head -n20
9. SSH for Port Forwarding
Many people have heard of SSH as a secure protocol for remote login in Linux, commonly used for managing servers. However, few may know that SSH can also be used for port forwarding. In fact, SSH has powerful capabilities for port forwarding, and here’s an example.
Example Background: Our company has a bastion host, and all operations must be performed on the bastion host. Some developers need to access the ElasticSearch head panel to check the cluster status, but we do not want to expose the ElasticSearch port 9200. We still want to access it through the bastion host. Therefore, we will forward requests to the bastion host (192.168.1.15) to the ElasticSearch server (192.168.1.19) on port 9200.
Example: Forward access to port 9200 on the local machine (192.168.1.15) to port 9200 on 192.168.1.19ssh -p 22 -C -f -N -g -L 9200:192.168.1.19:9200 [email protected]Note: Make sure to perform key transfer first.
After executing the command, accessing port 192.168.1.15:9200 will actually access port 192.168.1.19:9200.

往期推荐
-
Production Environment Troubleshooting Ideas and Toolbox: Practical Experience Sharing from Operations Veterans
-
Why Can’t Your Nginx Handle High Concurrency?
-
Batch Management Server Tool Ansible, Very Detailed!
-
Is Our CMDB Model Wrong in Operations?
-
High Availability Tool Keepalived, Achieving Zero Downtime!
-
Linux Shell Tricks: sed
-
Cloud Automation Operations Tool: Terraform
-
How to Handle Mining Viruses on Online Linux Servers?
-
Jenkins Setup, Permission Management, Parameterization, Pipeline, etc., Very Detailed!
-
Jenkins Pipeline Detailed Explanation, Recommended for Collection!
-
Finally Understood Nginx Reverse Proxy!
-
How to Troubleshoot Linux Network Packet Loss? Finally Understood!
-
How to Achieve Canary/Gray Release in K8s?
-
Analysis of 20+ Linux Commands for Log Analysis, Very Comprehensive!
-
Deploying a MySQL Cluster on K8s, Stable!
-
40 Common Nginx Interview Questions (with Answers)
-
Jenkins Production Environment Notes, Very Detailed!
-
19 Common Issues in K8s Clusters, Recommended for Collection
-
Nginx Working Principles and Optimization Summary (Super Detailed)
-
Six High-Frequency Linux Operations Troubleshooting Notes!
-
17 Common Metrics in Operations, 90% of People Don’t Know!
-
Why Does Performance Drop So Much After Containerizing Applications?
-
Nginx Rate Limiting Explained, Responding to Sudden Traffic and Malicious Attacks
-
How to Troubleshoot When Linux Disk is Full?
-
What to Do When the Interviewer Asks: CPU Spiking to 900%?
-
Nginx Performance Optimization, This Article is Enough!
-
K8s Pod “OOM Killer”, Found the Cause
-
Summary of Nginx High Concurrency Performance Optimization from Major Companies
-
Building a CI/CD System Based on Jenkins
-
Seven Major Application Scenarios of Nginx (with Configuration)
- The Most Comprehensive Jenkins Pipeline Detailed Explanation
- Mainstream Monitoring System Prometheus Learning Guide
- 40 Common Nginx Interview Questions
-
Common Linux Operations Interview Questions, A Must-Read for Job Seekers!
-
25 Common MySQL Interview Questions and Answers
Light it up, and the server won’t go down for three years