Content
I have been asked countless times: how do you debug more efficiently in the terminal? Or how do you debug in Vim? Well, today I will answer this uniformly: I never debug in Vim because it is not mature enough. So, aside from running GDB in the command line, is there a more efficient method in the terminal? One that allows me to achieve more with less effort?
Of course, there is. Choosing the right tools and methods can significantly enhance GDB debugging efficiency without any issues. The prerequisite is that you at least know how to use the most basic GDB.
Bare-bones State: Basic GDB Command Line
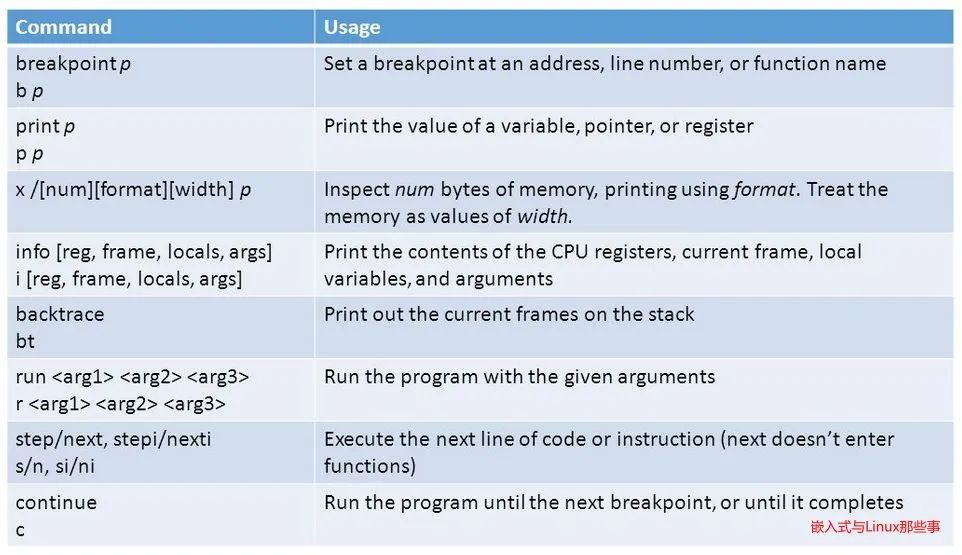
Before putting on various outfits, you must at least learn to run bare, so find a simple GDB cheat sheet to refer to:
When a crash occurs in a production environment, since online servers generally do not have a development environment or accompanying source code, if you are too lazy to drag the core file back to the development machine for inspection, you can first use GDB on the online server to take a quick look.
GDB commands are numerous, but the commonly used ones are just a few from the cheat sheet. For example, after entering, the first step is to use bt to check the call stack, info local to view local variables, and then use up/down to navigate between different levels of the call stack to check the values of local variables, and print a certain expression. Even without code, you can check the symbols and disassembly, and generally, you can debug quite effectively.
When encountering more complex bugs, you must refer to the source code. You need to pull the core file to the development environment and use GDB to debug against the source code, using list [line number] to view the current running source code, and then use other methods for debugging.
At this point, if the complexity of debugging continues to rise, you will need to set breakpoints constantly. After each next/step, you will need to list the source code before and after, or use disassemble [function name/address] to view the instructions. Many people may feel overwhelmed, so we need to give our bare-bones GDB some underwear.
Putting on Underwear: TUI
This is the text user interface that comes with GDB, started with the command gdb -tui, for example:
gdb -tui helloThis opens our text interface:
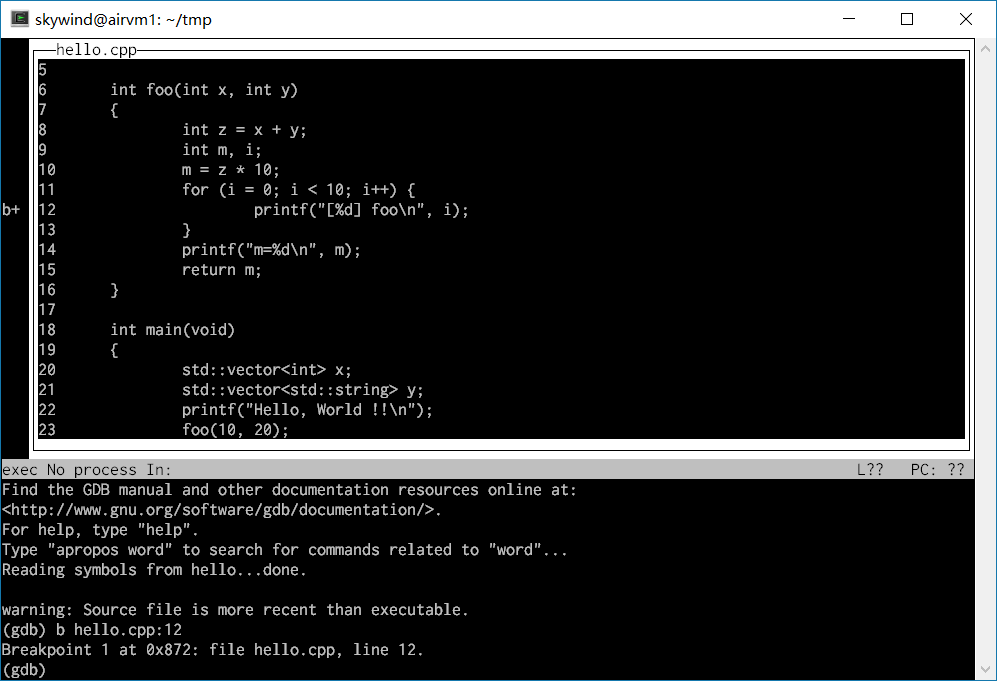
The upper part is the source code window, and the lower part is the GDB terminal. The window management shortcuts mimic Emacs, using c-x o to switch windows. If you want to view the instruction window, you can enter:<span>layout split</span>
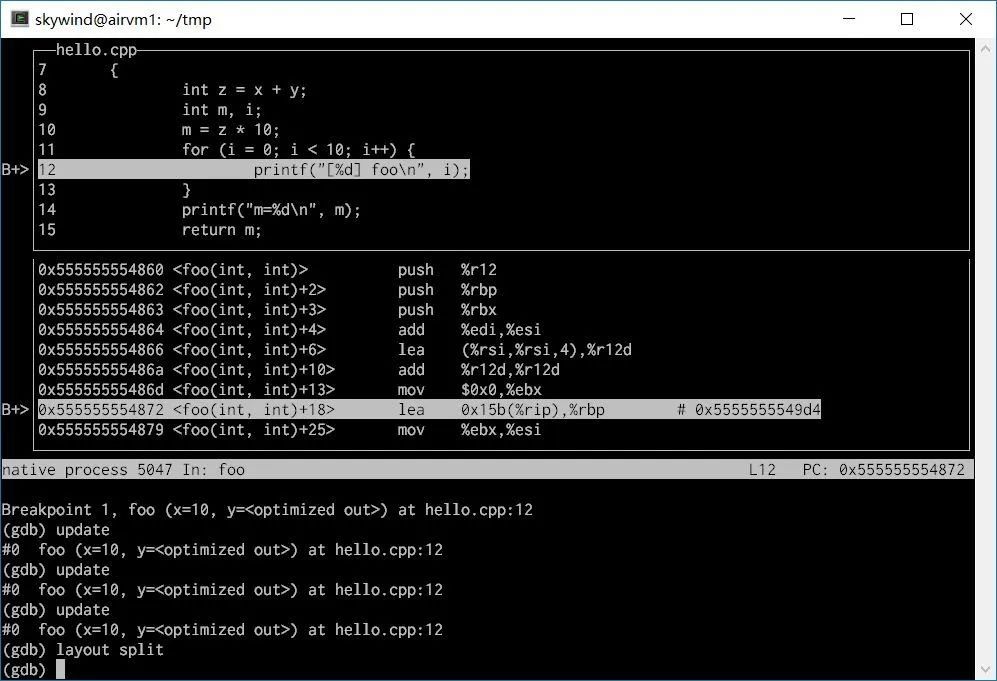
Then, when you step through, the upper source code window will scroll along, which is much more convenient than constantly listing. If you want to see the source code before and after, you can continue to switch windows with c-x o and scroll up and down.
Sometimes, after you switch stack frames with up/down, the upper code may not update in time. In that case, you can use the update command to let the upper code window locate your latest execution position, and sometimes you may need to use CTRL-L to redraw the entire interface.
In GDB’s built-in TUI mode, you can not only view code/instructions at any time but also check registers. Well, GDB, despite its simplicity, still comes with a pair of underwear; many people just forget to take it out and wear it.
Putting on Lingerie: gdbinit
If the information in the above text TUI is not rich enough, you might be interested in ~/.gdbinit, which is a GDB configuration script that can set up some plugins written in Python, such as PEDA:
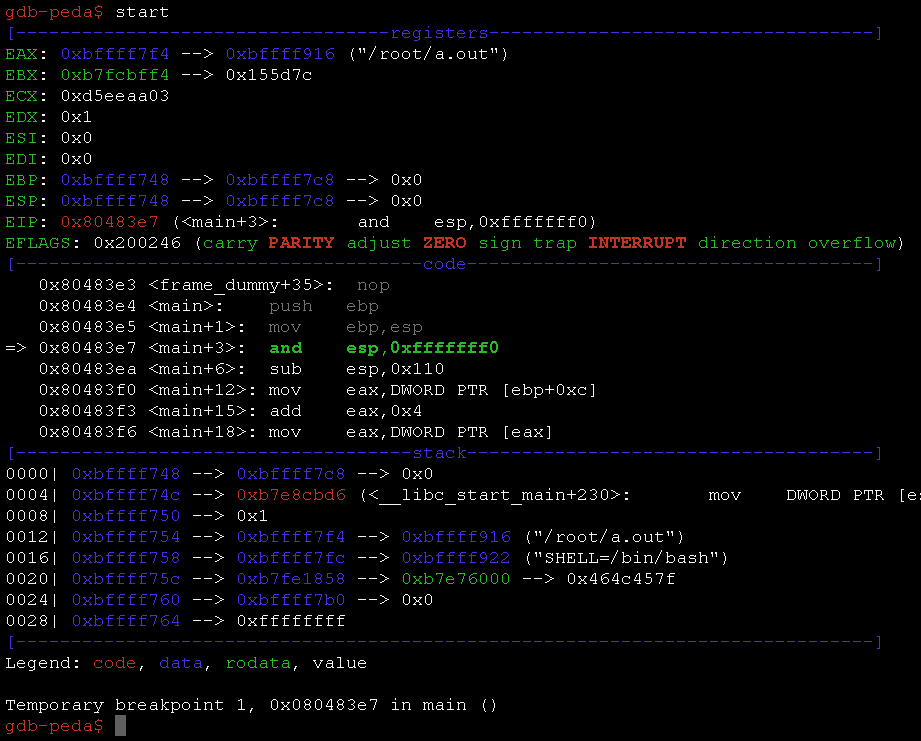
After configuring PEDA in ~/.gdbinit, you will see the command prompt change from (gdb) to gdb-peda$. Each time you enter a step command, PEDA will display an abundance of information, and you can configure to add more. With highlighting, you can get an enhanced command line.
However, I don’t use this much because it affects the TUI mode interface, and I don’t like to clutter my GDB with too many things. Meanwhile, as our debugging needs become more complex, you will need to set breakpoints continuously and frequently step through. Inputting various commands in the traditional command line can be exhausting. Is it possible to view the source code directly in the interface and set breakpoints and step through with shortcuts?
Yes, you can try CGDB.
Putting on a Coat: cgdb
CGDB is similar to GDB TUI, consisting of a terminal window and a code window:
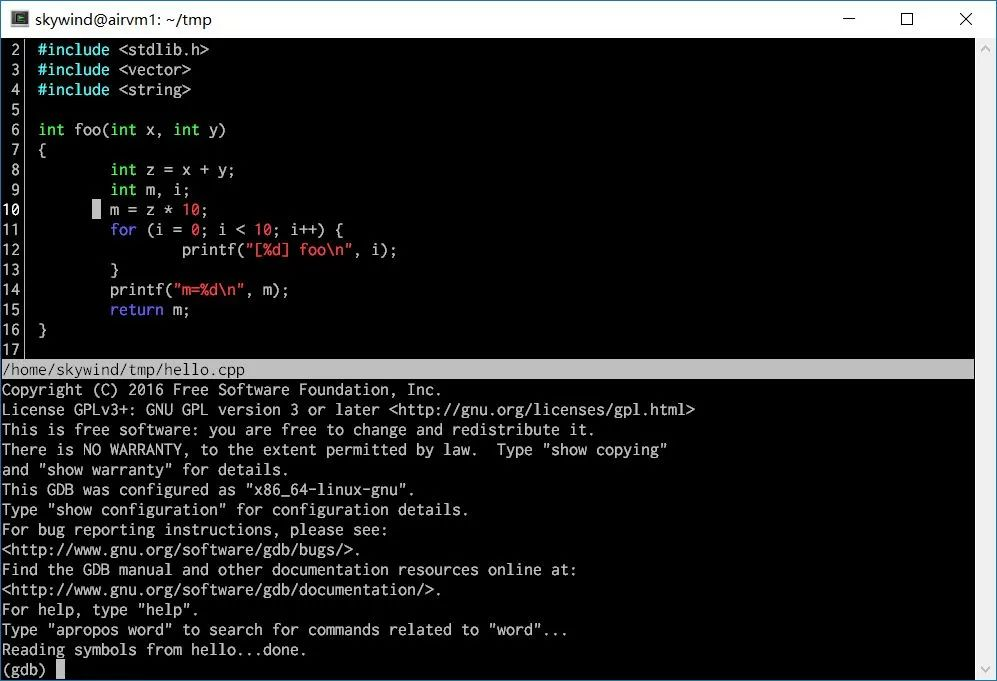
The upper code window is called CGDB mode, and the lower GDB window is called GDB mode. Debugging involves constantly switching between the two modes, with key operations mimicking Vim. Press ESC to switch back to CGDB mode and i to switch to GDB mode.
This looks similar to TUI GDB, right? Aside from syntax highlighting, how is it more efficient than GDB TUI? The answer is: most operations can be performed in CGDB mode (the source code window) using shortcut keys.
You can move the cursor with the arrow keys or hjkl, flip pages with page-down/up or c-f / c-b, and pressing o will list the source code files of the current executable, allowing you to switch to view other related code files. You can search the documentation with / or ?.
These shortcuts correspond closely to Vim, allowing you to browse the source code conveniently. In the code window, you can use the space bar to toggle breakpoints, along with other shortcuts:
- F5 – Send a run command to GDB.
- F6 – Send a continue command to GDB.
- F7 – Send a finish command to GDB.
- F8 – Send a next command to GDB.
- F10 – Send a step command to GDB.
For more shortcuts, see here. Now stepping and setting breakpoints is much easier; you can basically stay in the source code window without needing to go back to the GDB command line to input next/step one by one.
Edit ~/.cgdb/cgdbrc to make it more convenient:
set ignorecase
set ts=4
set wso=vertical
set eld=shortarrow
set hls
map <F9> :until<cr>
This roughly sets case-insensitive search, tab size, split screen mode (default changed to left-right split), search highlighting, and adds an F9 shortcut for breaking out of loops (which does not have this shortcut by default):
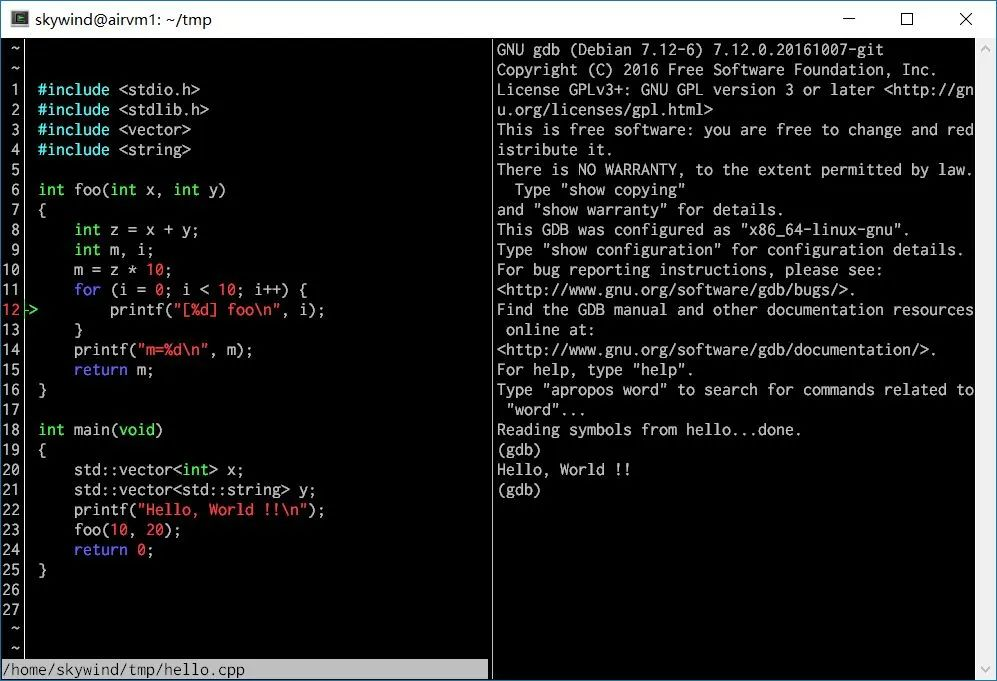
Now that everyone has wide-screen monitors, changing the default to a left-right split (requires CGDB 7.0) is much more comfortable.
CGDB has more features, such as viewing assembly when there are no source files, or cross-referencing source code and assembly, setting marks, etc. For specifics, refer to its official documentation.
This small tool can liberate you from a lot of GDB command line work, and the configuration file allows you to bind various commands to shortcuts according to your preferences.
Fully Dressed: Emacs GDB
Although most operations in CGDB can be performed with shortcuts, there are still many times when you need to switch back to the right GDB mode to type commands, such as when you need to use info local to check local variables or print a global variable’s value after each step. Frequent switching can be exhausting.
When debugging relatively complex issues, the above tools may not hold up. For those who usually write code in Vim, I do not hesitate to use Emacs’s GDB mode to debug complex issues. Undoubtedly, Emacs is currently the strongest GDB frontend in the terminal.
If you have never used Emacs, it doesn’t matter; just install Emacs and remember the following commands to debug:
- Switch files:
c-x c-f(pressctrl_xthenctrl_f), you can usetabfor completion when entering the file name. - Move the cursor: arrow keys, or
c-f, c-b, c-p, c-n; page up/down orc-v / m-v. - Switch buffers:
c-x bto switch the current window’s buffer,c-x c-bto open a new window and switch buffers. - Window operations:
c-x oto switch windows,c-x 2 / c-x 3for vertical/horizontal splits,c-x 0 / c-x 1to close/exclusive. - Input commands:
m-x(pressALT_x) to input commands with tab completion,c-gto exit command input.
Of course, don’t forget that the exit command is c-x c-c. That’s enough; first, we start Emacs:
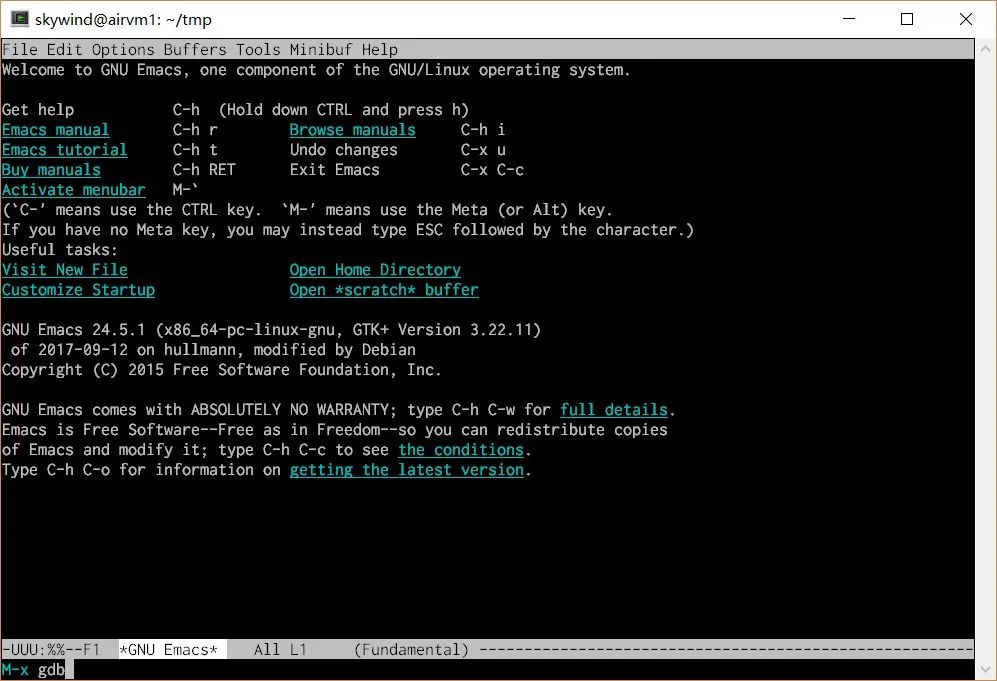
Press m-x (alt+x), and it will prompt you to input a command (if the terminal software’s alt key doesn’t work, you can set it up, or press ESC then x within a second, which is equivalent in xterm), type “gdb” and press enter:
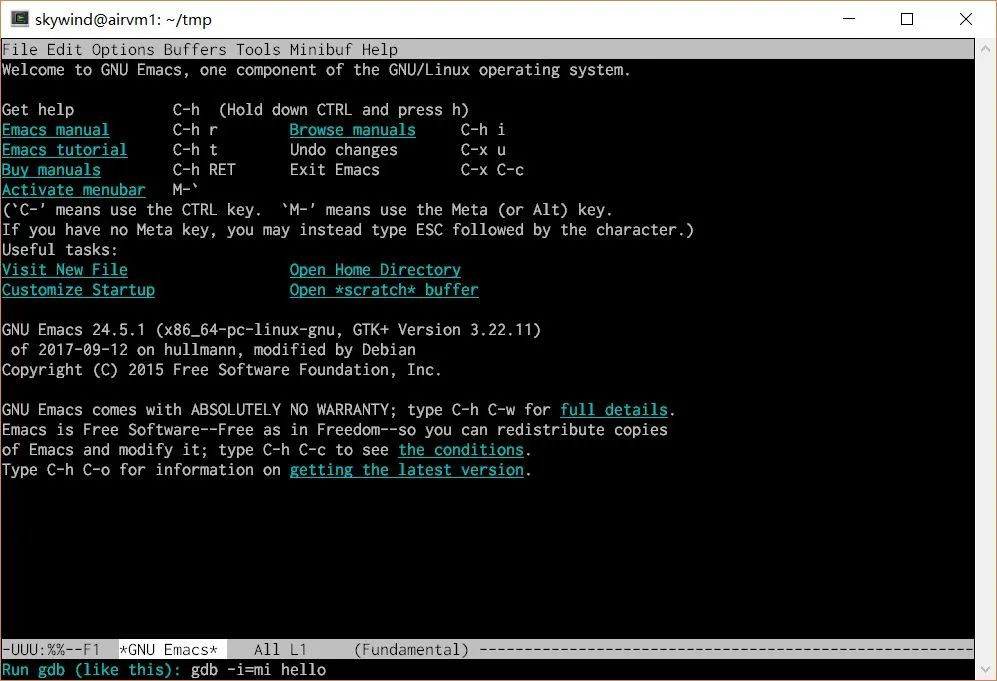
It will then ask how to run GDB; input the shell command to start GDB and press enter to begin GDB mode:
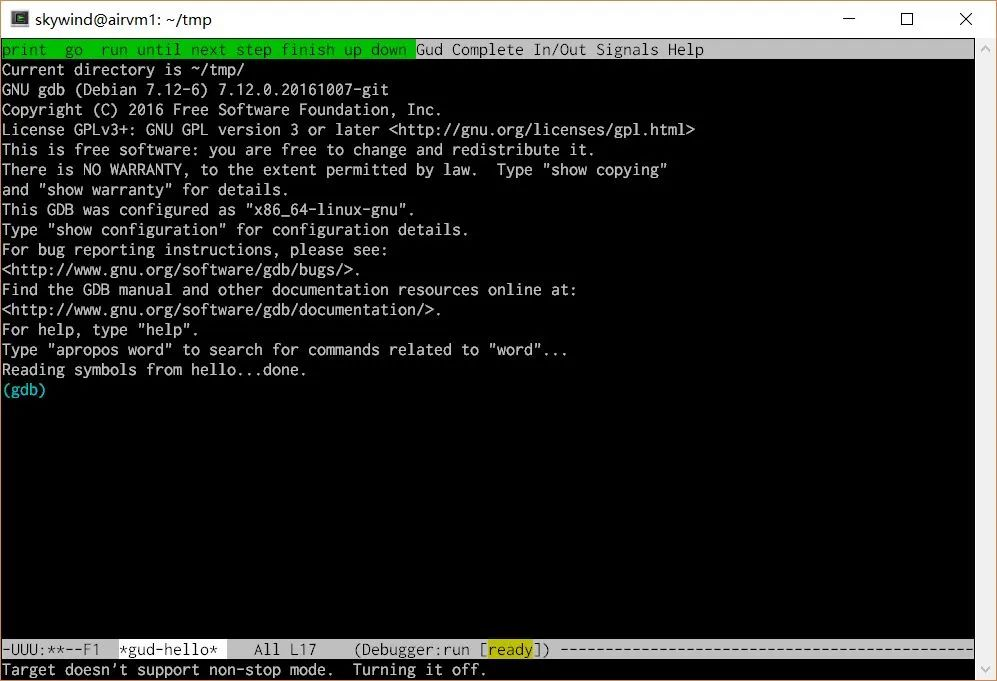
You may wonder if this is any different from running GDB directly in the command line. Hold on, continue with m-x to input the command:
gdb-many-windowsAnd it will immediately satisfy you:
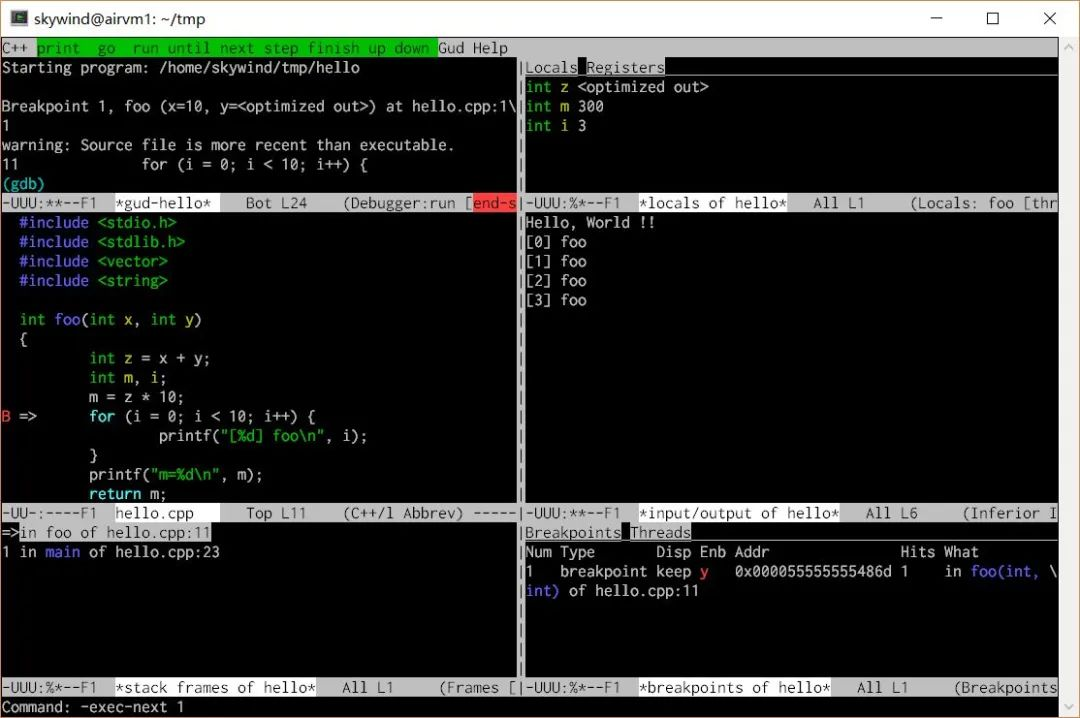
These commands starting with gud- are universal debugging commands in Emacs GDB mode, corresponding one-to-one with GDB commands. You can input these commands with m-x or operate them directly with shortcut keys.
If you want to replace a window with disassembly or register monitoring, you can use m-x to input:
gdb-display-disassembly-bufferThen one of the windows will switch to the disassembly window:
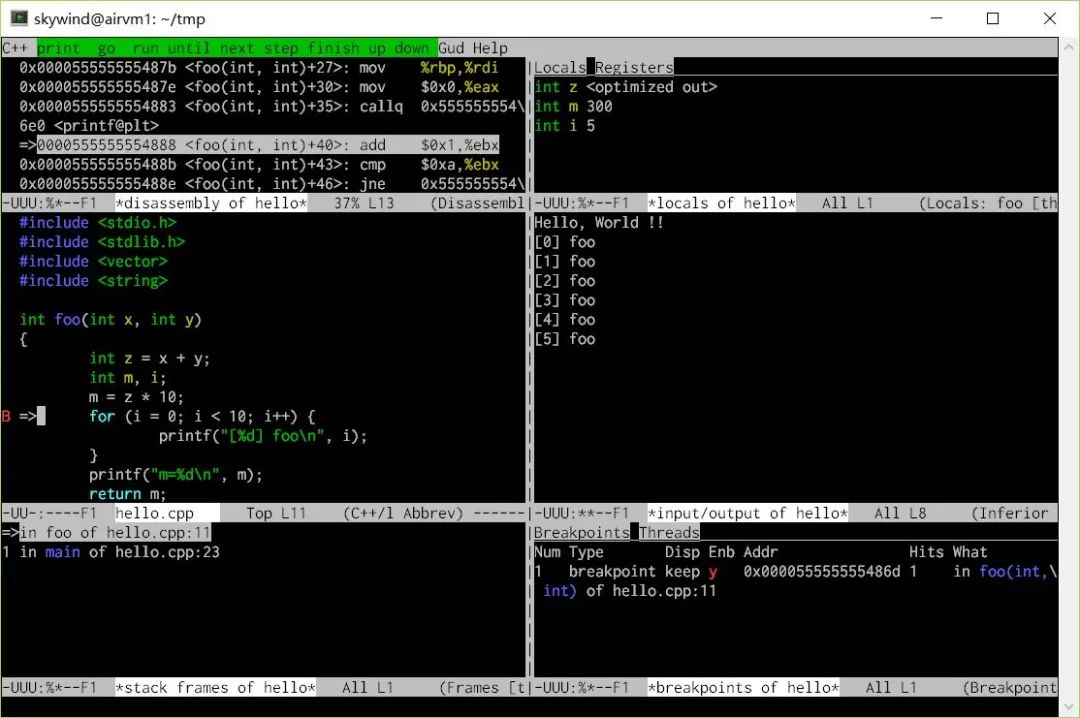
The upper left GDB terminal has been switched to the disassembly window. After viewing, remember to use c-x b to switch back to the GDB console. If you want to prevent a window from being switched, you can search for Emacs’s dedicated window feature. Furthermore, we can use window management shortcuts to split the layout according to our preferences:
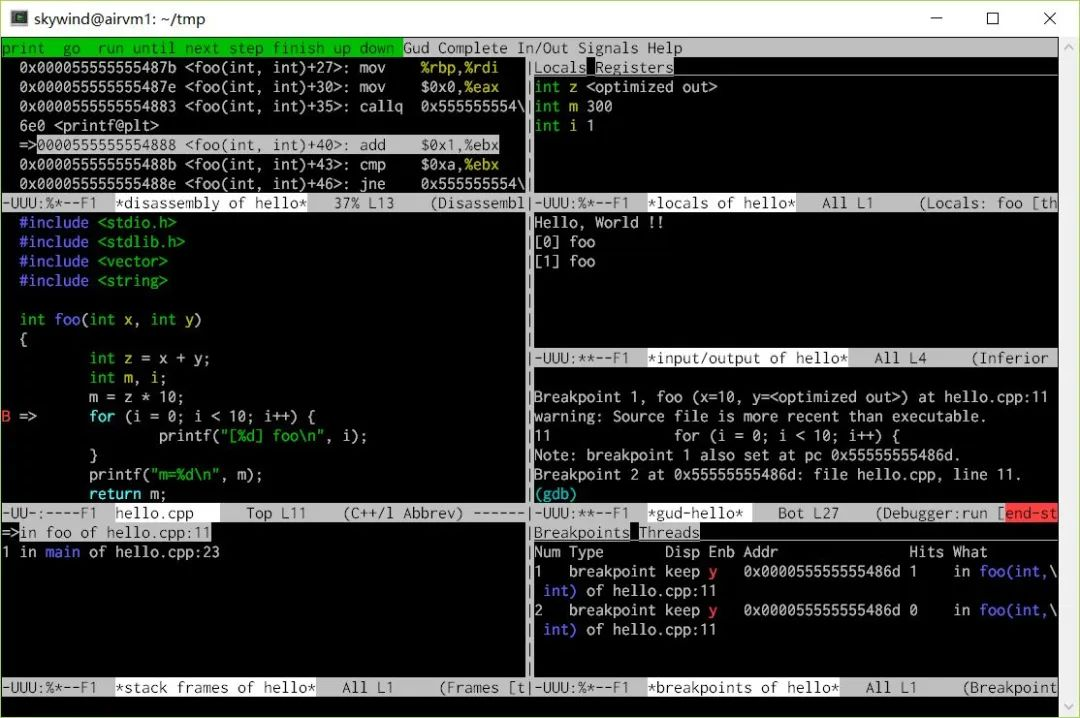
For example, I split it again, moving the GDB terminal to the right, placing the output window below, and displaying the disassembly in the area that originally showed the GDB terminal. Basically, all debugging methods you see in an IDE can be operated in Emacs, and Emacs can also debug Mingw programs under Windows using GDB.
You might complain that operating in Emacs is too cumbersome; no worries, just a little tuning will do.
Tuning Emacs GDB Mode
Open ~/.emacs (or ~/_emacs under Windows) and enter the following content:
(global-set-key [M-left] 'windmove-left)
(global-set-key [M-right] 'windmove-right)
(global-set-key [M-up] 'windmove-up)
(global-set-key [M-down] 'windmove-down)

(global-set-key [f5] 'gud-run)
(global-set-key [S-f5] 'gud-cont)
(global-set-key [f6] 'gud-jump)
(global-set-key [S-f6] 'gud-print)
(global-set-key [f7] 'gud-step)
(global-set-key [f8] 'gud-next)
(global-set-key [S-f7] 'gud-stepi)
(global-set-key [S-f8] 'gud-nexti)
(global-set-key [f9] 'gud-break)
(global-set-key [S-f9] 'gud-remove)
(global-set-key [f10] 'gud-until)
(global-set-key [S-f10] 'gud-finish)

(global-set-key [f4] 'gud-up)
(global-set-key [S-f4] 'gud-down)

(setq gdb-many-windows t)
This sets ALT + arrow keys to jump between windows. If your terminal’s alt + arrow keys don’t work, you can change it to C-left, C-right, etc., to move windows with ctrl + arrow keys. The rest sets shortcuts for commonly used commands.
Finally, set gdb-many-windows to open by default, and it’s best to add the following segment to allow mouse operations:
(require 'xt-mouse)
(xterm-mouse-mode)
(require 'mouse)
(xterm-mouse-mode t)
(defun track-mouse (e))

(setq mouse-wheel-follow-mouse 't)

(defvar alternating-scroll-down-next t)
(defvar alternating-scroll-up-next t)

(defun alternating-scroll-down-line ()
  (interactive "@")
    (when alternating-scroll-down-next
      (scroll-down-line))
    (setq alternating-scroll-down-next (not alternating-scroll-down-next)))

(defun alternating-scroll-up-line ()
  (interactive "@")
    (when alternating-scroll-up-next
      (scroll-up-line))
    (setq alternating-scroll-up-next (not alternating-scroll-up-next)))

(global-set-key (kbd "<mouse-4>") 'alternating-scroll-down-line)
(global-set-key (kbd "<mouse-5>") 'alternating-scroll-up-line)
Now in xterm, you can use the mouse to click to switch windows, click buttons, and use the scroll wheel to view the source code:

This gives you more freedom; with ALT + arrow or mouse clicks, you can directly jump between windows and operate with the commands below:
- F5 – Run, Shift + F5 – Continue
- F7/F8 for code-level stepping, and Shift-F7/F8 for instruction-level stepping
- F9 – Set breakpoint, Shift-F9 – Remove breakpoint
- F10 – Break out of loop, Shift-F10 – Break out of function
- F4 – Move to the previous call stack frame, Shift-F4 – Move to the next
The upper right local variable window has two buttons that can be clicked to switch between displaying local variables or registers. The lower right also has two buttons to switch between displaying breakpoints or threads. The buttons in the green area at the top can also be clicked directly with the mouse.
Finally, this is much better than our initial version. If you enjoy tinkering, you can also customize the initial layout of gdb-many-windows to be more complex:
This can thoroughly satisfy your various complex debugging needs; I won’t elaborate here, but if you’re interested, see this article.
Finally, is it cumbersome to open Emacs every time you debug, input m-x and then the file name? Let’s tune .bashrc:
gdbtool () { emacs --eval "(gdb \"gdb --annotate=3 -i=mi $*\")";}Now, in the terminal, to debug the program, you just need to input:
$ gdbtool helloAnd it will automatically open Emacs and switch to GDB mode, expanding our multi-window setup to start debugging. Isn’t that delightful?
I usually start with GDB TUI to take a look when I don’t have an environment, and if the environment is available or the problem is complex, I will open Emacs for debugging. Later, after being introduced to CGDB, GDB TUI has been retired. I first use CGDB to get a rough idea, and when encountering complex issues, I open Emacs. After some tuning, it becomes very handy.
Making GDB More Attractive
Actually, by the time we reach Emacs, we are almost there. But if you really can’t remember these limited shortcuts or GDB commands, you can also try GDB GUI:
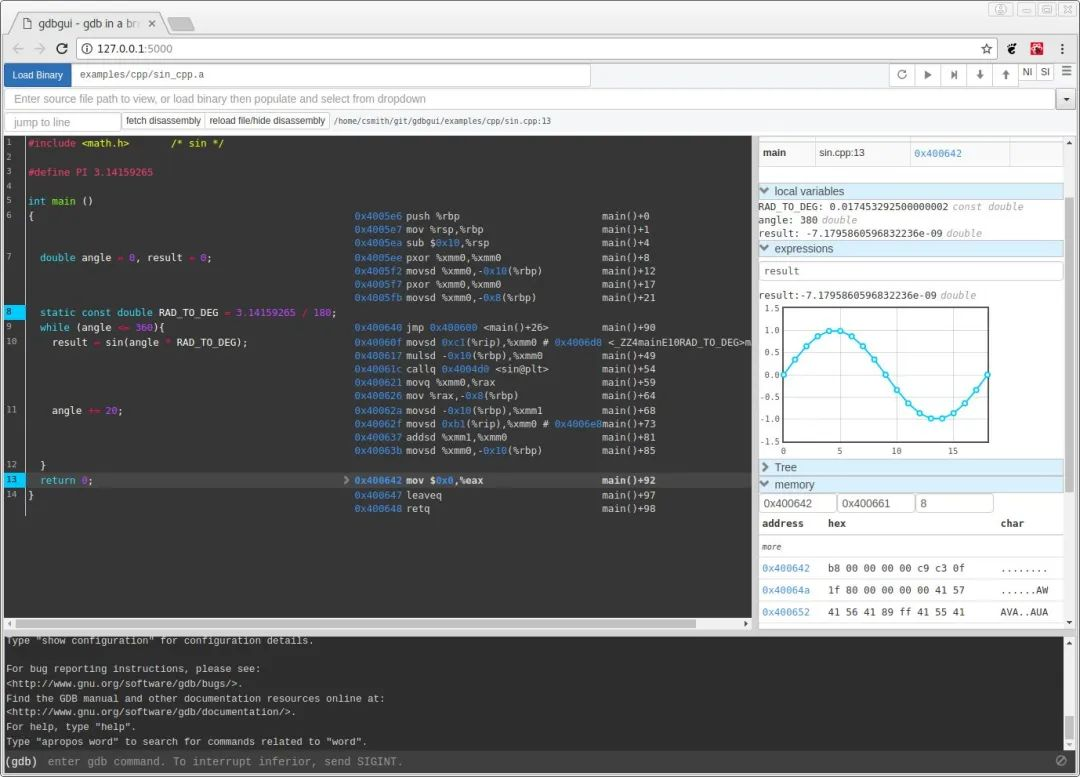 A browser-based GDB frontend developed in Python, just install it via pip, and when using:
gdbgui --host 0.0.0.0 helloIt will listen on local port 5000, and we can open the server address in a browser to debug entirely with the mouse.
The middle shows the program code, the bottom shows the GDB terminal, and the top can switch source code, control run/continue/step, etc. The right side can view local variables, call stack frames, memory addresses, breakpoints, threads, etc. in real-time.
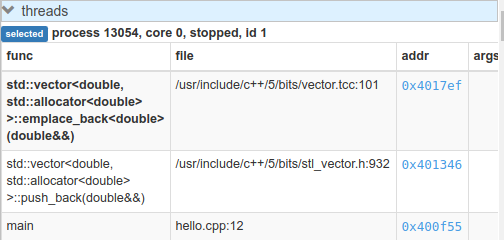
For example, the above shows the call stack and thread view, as well as the custom structure query below:
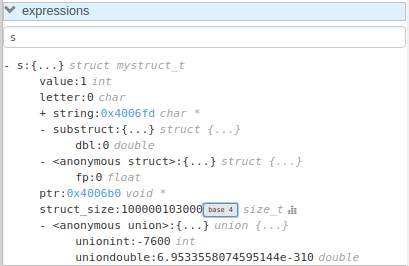
It can also visualize data structure queries:
Clicking on the left side of the code allows you to set/remove breakpoints, and clicking the buttons above can switch to display assembly code. Basically, it presents the main functions of GDB in a visual way, showcasing a modern web interface without needing to remember any shortcuts; just point and click.
Additionally, this GDB GUI also supports GDB debugging under Windows. Currently, GDB GUI is still under active development, and as the most attractive GDB frontend, it is expected to become more powerful.
Conclusion
We have experienced the journey from the initial bare command line state of GDB to the most complete debugging environment in the terminal, Emacs GDB mode, and finally to the attractive GDB GUI. The advantage of GDB lies in its ability to incorporate various plugins internally and provide various interfaces externally, allowing you to handle debugging tasks well while leaving the frontend interface to other programs, whether local or remote. This is why there are so many rich GDB frontends and various remote GDB tools.
It does not limit you to say that you can only debug this way or that you only have one UI to operate. Therefore, the combinations of GDB are countless. You don’t have to think that GDB only has the primitive command input method. With the many methods above, just pick a couple, and in less than half an hour, you can significantly speed up your debugging work in the terminal.
Original link: https://zhuanlan.zhihu.com/p/32843449 Copyright belongs to the original author. If there is any infringement, please contact the author for deletion.
Materials sourced from the internet, for academic research only. If there is any infringement, please contact for deletion. Thank you~
Finally
That’s all for today. If you found this helpful, be sure to give alike~
The only, permanent, free platform for sharing embedded technology knowledge~
Recommended Albums Click the blue text to jump
☞ MCU Advanced Album 
☞ Embedded C Language Advanced Album
☞ “Bug Talk” Album
☞ Album | Comprehensive Programming for Linux Applications
☞ Album | Learn Some Networking Knowledge
☞ Album | Handwritten C Language
☞ Album | Handwritten C++ Language
☞ Album | Experience Sharing
☞ Album | Power Control Technology
☞ Album | From Microcontrollers to Linux