Scan to follow Chip Dynamics , say goodbye to “chip” blockage!

 Search WeChat
 Chip Dynamics
Previously, we learned how to create an STM32F4 project under MDK. In this section, we will introduce readers to the code downloading and debugging for STM32F4. The debugging here includes software simulation and hardware debugging (online debugging). Through this chapter, you will learn about: 1. Downloading programs to STM32F4; 2. Using STLINK for downloading and online debugging of STM32F4.
STLINK Download Program
STLINK supports JTAG and SWD, and STM32 also supports JTAG and SWD. Therefore, we have two methods for debugging: JTAG debugging occupies more IO lines, while SWD debugging requires fewer IO lines, only two are needed.
First, to download and debug with STLINK, you need to connect STLINK to the computer’s USB and the board’s JTAG interface using a USB cable. After installing the STLINK driver, we connect STLINK and plug the JTAG port into the STM32 development board, then click , open the Options for Target tab, and select ST-LINK Debugger as the simulation tool in the Debug section, as shown:
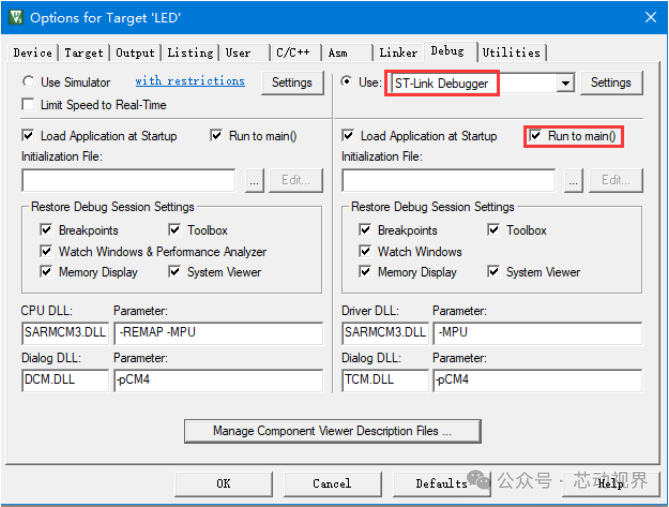
If the Run to main() option is checked, once you click simulate, it will directly run to the main function. If this option is not selected, it will first execute the startup_stm32f40_41xxx.s file’s Reset_Handler, then jump to the main function. Then we click Settings to set some parameters for STLINK, as shown:
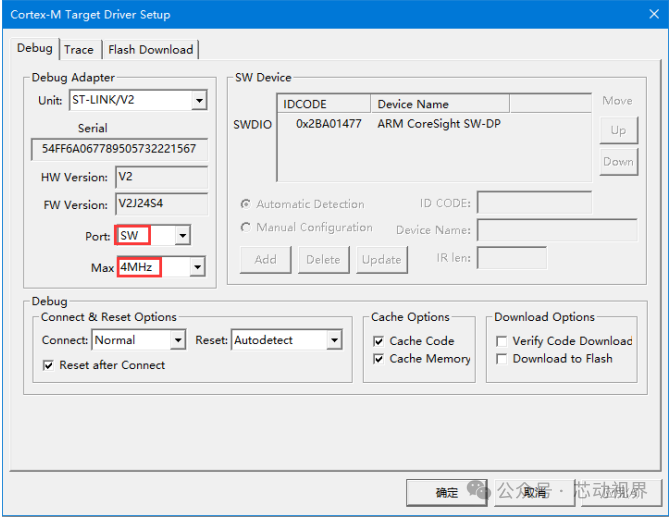
We use the SW mode of STLINK for debugging because JTAG requires many more IO ports than SW mode. It is recommended to choose SW mode during debugging. Max Clock can be set automatically by clicking Auto Clk; in the image, we set the SWD debugging speed to 4MHz. If your USB data cable is of poor quality, it may cause issues, in which case you can try lowering the speed here. Click OK to complete this part of the settings. Next, we also need to set the target programmer for downloading in the Utilities tab, as shown:
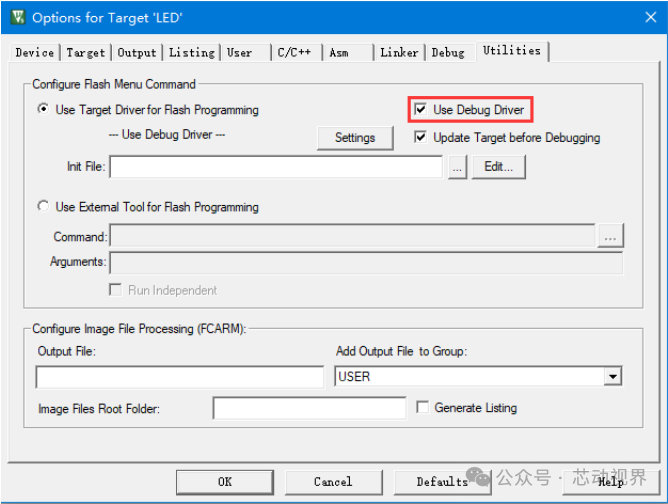
We directly check Use Debug Driver, which is the same as debugging, selecting STLINK to program the FLASH of the target device, and then click Settings to set as shown:
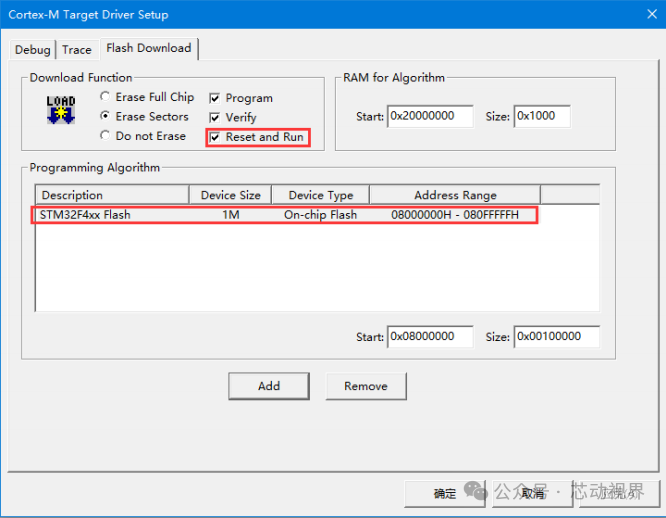
Here, MDK5 will automatically set the flash algorithm based on the target device selected when we created the project. We are using STM32F407ZGT6, which has a FLASH capacity of 1M bytes, so the Programming Algorithm will default to the 1M model of STM32F4xx FLASH algorithm. Special reminder: the 1M flash algorithm is not only for the 1M capacity STM32F4, but also applies to models with less than 1M FLASH. Finally, select the Reset and Run option to automatically run after programming, and the other default settings are fine.
After completing the settings, click OK, then click OK again to return to the IDE interface, and compile the project. Next, we can download and debug the code using STLINK. After configuring STLINK, using STLINK to download the code is very simple; you just need to click the LOAD button to download the program. After the download is complete, the program can be executed directly on the development board.
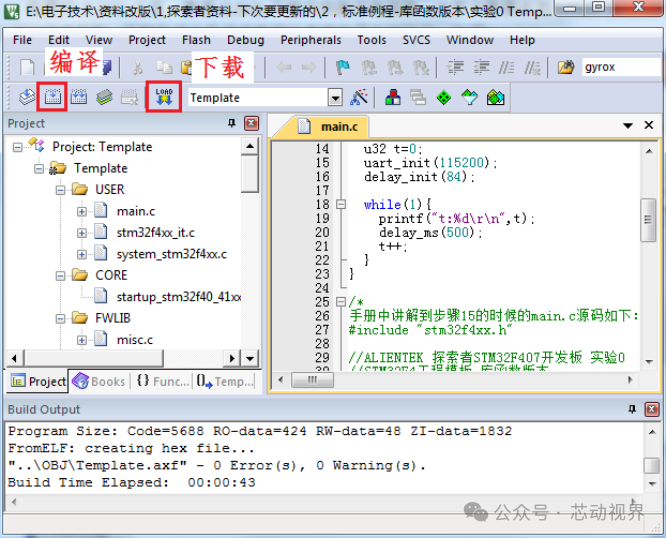 STLINK Program Simulation
Click  to start the simulation. If the code on the development board has not been updated, it will first update the code before simulating. You can also press
  to only download the code without entering the simulation.
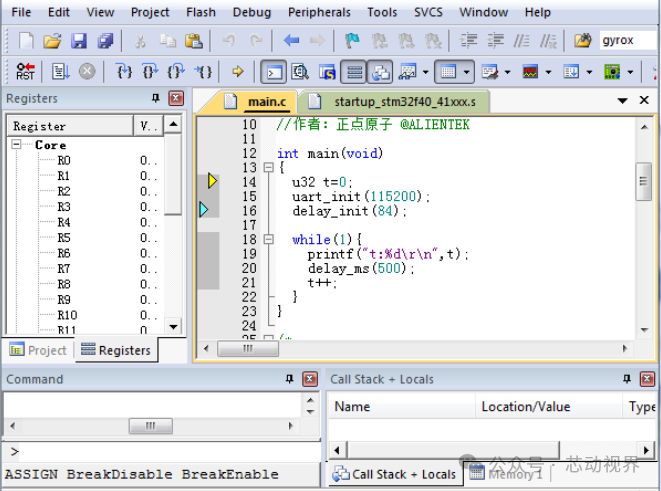
Since we previously checked the Run to main() option, the program directly runs to the entry point of the main function. We set a breakpoint at uart_init(115200), and by clicking  , the program will quickly execute to that point.
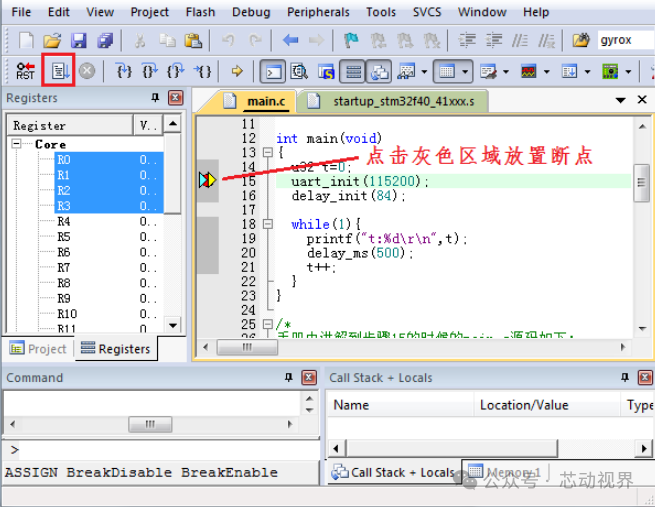
Since we previously checked the Run to main() option, the program directly runs to the entry point of the main function. Additionally, at this point, MDK has added a new toolbar, which is the Debug toolbar, and this toolbar is very useful during our simulation.
-
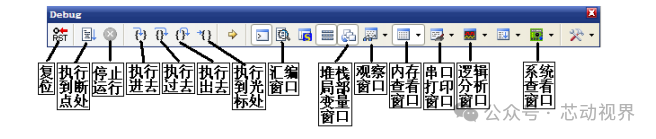
Reset: This function is equivalent to pressing the reset button on the hardware. It effectively performs a hard reset. After pressing this button, the code will start executing from the beginning.
-
Run to Breakpoint: This button is used to quickly execute to the breakpoint. Sometimes you do not need to watch how each step is executed, but want to quickly execute to a certain point in the program to see the result; this button can achieve that, provided you have set a breakpoint at the location you are checking.
-
Stop Running: This button becomes active when the program is continuously executing. By pressing this button, you can stop the program and enter single-step debugging mode.
-
Step Into: This button allows you to execute into a certain function. In the absence of a function, it is equivalent to the Step Over button.
-
Step Over: When encountering a function, this button allows you to step over the function without entering it for single-step execution.
-
Step Out: This button is used when you have entered a function in single-step debugging; sometimes you may not need to execute the remaining part of the function. This button allows you to execute the remaining part of the function and exit, returning to the point where the function was called.
-
Run to Cursor: This button can quickly run the program to the cursor position. It is quite similar to the Run to Breakpoint button, but there is a difference; you can have multiple breakpoints, but there is only one cursor position.
-
Assembly Window: By pressing this button, you can view the assembly code, which is very useful for analyzing the program.
-
Stack Local Variables Window: By pressing this button, the Call Stack + Locals window will be displayed, showing the local variables of the current function and their values for easy viewing.
-
Watch Window: MDK5 provides two watch windows (dropdown selection). Pressing this button will pop up a window displaying variables; you can input the variables/expressions you want to observe to see their values, which is a commonly used debugging window.
-
Memory View Window: MDK5 provides four memory view windows (dropdown selection). Pressing this button will pop up a memory view window where you can input the memory address you want to view and observe the changes in that memory area. This is a commonly used debugging window.
-
Serial Print Window: MDK5 provides four serial print windows (dropdown selection). Pressing this button will pop up a window similar to a serial debugging assistant interface, used to display the content printed from the serial port.
-
Logic Analyzer Window: This icon has three options (dropdown selection), and we generally use the first one, which is the Logic Analyzer window. Clicking it will bring up this window, and by using the SETUP button, you can create some IO ports to observe the level changes of these IO ports, displayed in various forms, which is quite intuitive.
-
System Viewer Window: This button provides various peripheral register viewing windows (through dropdown selection). By selecting the corresponding peripheral, you can bring up the relevant register table for that peripheral and display the values of these registers for easy verification of whether the settings are correct.
Special Note: The Serial Print Window and Logic Analyzer Window are only available during software simulation, and MDK5 does not basically support software simulation for STM32F4 (hence this tutorial does not introduce software simulation directly). Therefore, these two windows are generally not needed. However, for STM32F1 software simulation, MDK5 is supported, and you can use it during F1 development.
Viewing Peripheral Registers
Click on the menu bar Peripherals→System Viewer→USART→USART1. You can see many peripherals available for viewing; here we are checking the status of Serial Port 1.
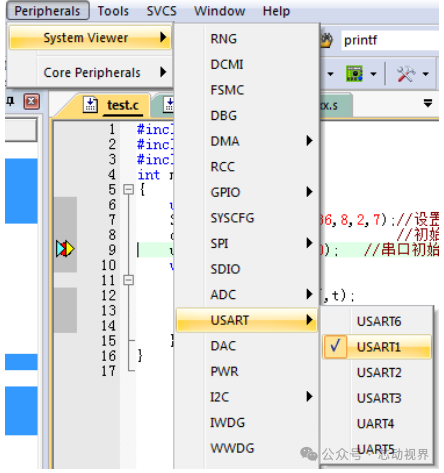
After clicking USART1, a screen like the one shown in (a) will appear on the right side of the IDE:
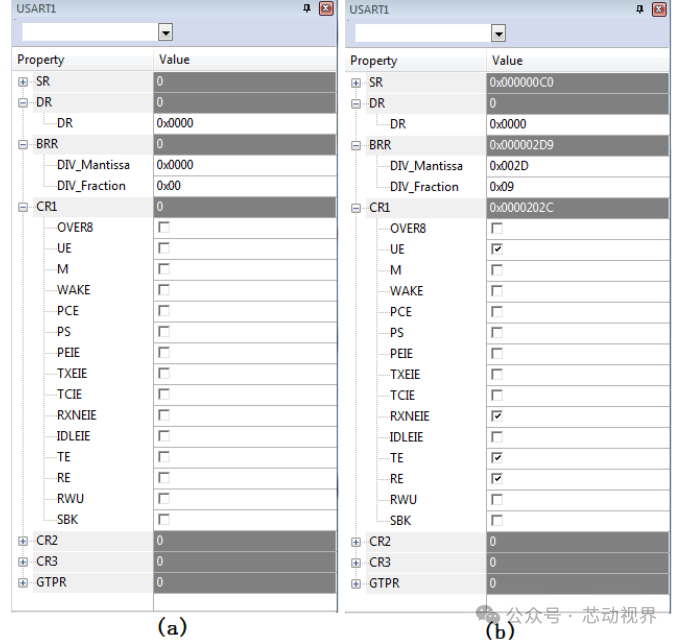
Image (a) shows the default setting status of STM32’s Serial Port 1, from which you can see all registers related to the serial port are displayed. Next, we click to execute the serial port initialization function, obtaining the serial port information shown in (b). You can compare the differences between these two images to understand what operations were performed in the uart_init(115200); function.
Through image (b), we can check the status of various registers of Serial Port 1, allowing us to determine if there are any issues with our code. Only when the settings here are correct can the hardware execute correctly. This method can also be applied to many other peripherals. This method is very useful both for troubleshooting and during code writing.


● A Complete Guide to C Language Unions: Memory Reuse, Bit Manipulation, Type Punning, All in One!
● Practical Tips for C Language: Detailed Explanation of Structure Alignment
● Master this Pointer Summary, and Your C Language Skills Will Improve by a Level!
● Practical Tips for C Language: Summary of const Usage
If you find the article useful, click “Like”, “Share”, “Recommend”!