

Zhao Shuixia (1992-), female, Han nationality, graduated from Inner Mongolia Agricultural University in 2019, majoring in Agricultural Water Resources Utilization and Protection (joint doctoral program with Clarkson University, USA), engineer at the China Institute of Water Resources and Hydropower Research, a second-tier talent in the New Century 321 Project of Inner Mongolia Autonomous Region, a key member of the “Grassland Ecological Hydrological Process Observation and Restoration Control Technology” innovation team. She has hosted/participated in more than 16 intergovernmental international scientific and technological cooperation projects, National Natural Science Foundation projects, and provincial and ministerial science and technology plan support projects, compiled over 30 drought planning, emergency plans for urban super-standard floods, and research and planning reports in the field of hydraulic engineering, published more than 20 academic papers (over 5 as the first author in SCI/EI), published one monograph, and edited/participated in more than 12 authorized inventions and utility model patents, and software copyrights, issued one local standard, and received one advanced practical technology promotion for the “Drought Monitoring and Prediction Evaluation System in Inner Mongolia Pastoral Areas”. She mainly engages in research and planning work related to ecological hydrology in pastoral areas, monitoring and assessment of water and drought disasters, prediction and early warning, drought resistance capacity evaluation, and disaster prevention and mitigation strategies, monitoring and simulation of ice jam flooding disasters in the Yellow River Inner Mongolia section, as well as river evolution and sedimentation.
Inner Mongolia is an important ecological security barrier in northern China and a major agricultural and pastoral production base, with various ecosystem types such as forest, grassland, and desert. However, most of its area belongs to arid and semi-arid regions, characterized by water resource shortages, fragile ecological environments, and high sensitivity to climate change. With the global warming trend, various water and drought disasters occur from time to time in Inner Mongolia, severely restricting local ecological environment restoration and sustainable development. Based on this, this article considers precipitation as the primary moisture limiting factor in arid and semi-arid regions and constructs a standardized precipitation index based on the normal distribution of precipitation to determine the dry and wet characteristics and temporal-spatial distribution patterns of climate in different ecological functional areas of Inner Mongolia. It explores the evolutionary cycles and trends of humid and arid climates in Inner Mongolia, providing scientific basis for regional water and drought disaster prevention and ecological construction.
Exploring the dry and wet patterns of climate and their evolutionary trends is of great significance for monitoring and defending against drought and flood disasters. Focusing on the important positioning of the ecological functional area in northern Inner Mongolia, based on monthly precipitation data from 45 meteorological monitoring stations from 1970 to 2020, using the Standardized Precipitation Index (SPI), linear trend, mutation test, and Morlet wavelet analysis methods, this study investigates the dry and wet characteristics of climate in Inner Mongolia and the periodic evolution laws at multiple time scales. The results show that from 1970 to 2020, the drought intensity in Inner Mongolia is mainly light to moderate drought, with frequent localized and regional droughts, significant summer drought trends, which are notably higher than the interannual drought level; different ecological functional areas exhibit a spatial pattern of dryness and wetness, with the northeast forest area and the western desert area experiencing alleviated drought, while the central grassland area faces aggravated drought, and the typical grassland area has a higher drought risk; wavelet analysis indicates that Inner Mongolia has experienced approximately two dry and wet alternating processes, where the short cycle of 11 years is related to solar activity, and the long cycle of 49 years reveals that Inner Mongolia will remain in a warm and humid period.
Standardized Precipitation Index; Dry and Wet Climate Characteristics; Inner Mongolia; Wavelet Analysis; Drought and Flood Disasters
1. Research Background
Under the background of global climate change, frequent drought and flood events have had many adverse effects on agricultural production, ecological environment, and socio-economic development. Inner Mongolia, as an important ecological security barrier in northern China and a significant production base for forestry and animal husbandry, is influenced by climate change and the unique climatic features of arid and semi-arid regions, fragile ecosystems, and scarce water resources. It has become a significant area affected by climate change and a highly sensitive area in northern China. To effectively mitigate regional drought and flood disaster losses and ensure the role of Inner Mongolia as an important ecological security line in the north, studying the distribution patterns and evolutionary laws of dry and wet conditions in Inner Mongolia under climate change is of great significance for scientific drought prevention and ecological environment protection.
Precipitation is the most direct indicator influencing drought and flood occurrences. To avoid level differences caused by spatial heterogeneity and uneven temporal and spatial distribution of precipitation, meteorological assessments of drought and flood often use the Standardized Precipitation Index (SPI), which is obtained by normalizing precipitation data. It has comparability across multiple time and geographical scales. The monthly SPI can reflect short-term dry and wet events and transition patterns in the region, while annual and seasonal SPI indices have advantages in reflecting dry and wet cyclical characteristics. Spinoni et al. used SPI-12 to study global drought frequency, duration, and severity from 1951 to 2010, finding that SPI, as one of the meteorological drought indices, has characteristics such as easy access to basic data and good stability, making it suitable for reflecting drought conditions and climatic dry and wet evolution characteristics in arid regions.
From 1960 to 2014, northern China showed a drying trend, with significant drought trends in summer and autumn, while spring and winter showed a certain wetting trend. Different time scales and drought indices reveal varying drought evolution trends and dry and wet distribution patterns in the same study area. Zhang Cunhou et al. found that from 1971 to 2000, the climate in the western desert area and eastern Greater Khingan Range of Inner Mongolia exhibited a dry-wet alternating pattern, while the semi-humid and semi-arid boundary area in the northeast showed a persistent drying trend. Dao Rina et al. indicated that from 1980 to 2015, based on ecological zoning, the drought characteristics in Inner Mongolia showed an increasing interannual drought trend in the eastern grassland and forest areas, while the desert area showed a slight decrease. Li Hongyu and Na Yintai revealed that the central region of Inner Mongolia experienced a faster drought trend rate from 1951 to 2014 compared to the west and east, with drought intensity increasing in the central and eastern areas while decreasing in the west, and the drought impact area displaying characteristics of regional drought in the east and widespread drought in the central and western areas. Guo Xiaomeng et al. found that between 1961 and 2016, the drought trend in Inner Mongolia was significant, with a wide range of drought impacts in spring, summer, and autumn. Qu Xuebin et al. used the MCI meteorological drought index, concluding that from 1962 to 2017, the drought and flood changes in Inner Mongolia were severe, with a weakening trend in spring drought intensity and an increasing trend in autumn. In summary, the drought characteristics revealed by multiple time scale meteorological drought indices and their responses to climate change are constantly changing over time. Research on the regional differences in drought in Inner Mongolia has accumulated a certain foundation, but reports on the dry and wet changes and periodic characteristics of climate in Inner Mongolia driven by climate change are still rare. Therefore, this article aims to explore the dry and wet patterns of climate in Inner Mongolia from 1970 to 2020 and the evolution laws of meteorological drought to provide technical support for flood and drought disaster prevention and ecological environment protection in northern regions.
2. Overview of the Research Area
Inner Mongolia is located in the northern border of China, in the mid-latitude inland of East Asia (37°24′ N~53°23′ N, 97°12′ E~126°04′ E), serving as an important ecological security barrier in northern China. The study area is situated in a temperate continental monsoon climate zone, transitioning from humid and semi-humid areas in the east to semi-arid and arid areas in the west, with annual precipitation ranging from 50 to 450 mm, decreasing from east to west, and 70% of annual precipitation occurring from June to August. The annual average evaporation shows a significant zonal trend, gradually increasing from east to west and from south to north, with the lowest value in the eastern part of the Greater Khingan Range, below 1200 mm, while most areas have evaporation exceeding 1200 mm. The terrain and landforms in Inner Mongolia are complex, primarily consisting of deserts, sandy areas, plateaus, and mountains, with an average altitude of around 1000 m. The northern part is the Inner Mongolia Plateau, the southeast is the Xiliao River Plain, the south is the Ordos Plateau, and the southwest features the Tengger Desert and Mu Us Desert. The forest ecosystem is mainly concentrated in the northeastern part of the Greater Khingan Range, covering 9 banners and counties in Hulunbuir City and Xingan League, with 5 national field meteorological monitoring stations established; the central part is dominated by grassland ecosystems, encompassing various grassland types such as Hulunbuir meadow grassland, Xilin Gol typical grassland, and western desert grassland; the western Alxa Plateau is mainly bare land, with poor biodiversity, radiating 7 meteorological monitoring stations, as shown in Figure 1. Due to the special geographical location, terrain and landform, and climatic conditions, the region suffers from severe drought, fragile ecological environments, and frequent issues such as grassland degradation and soil erosion.
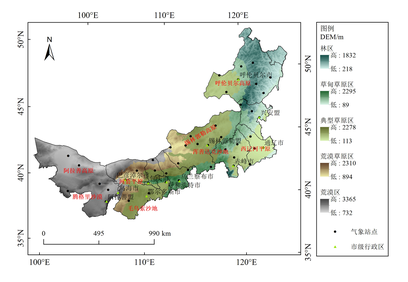
Figure 1: DEM Elevation and Distribution of Meteorological Stations in Ecological Functional Areas of Inner Mongolia Autonomous Region
3. Data Sources and Research Methods
3.1 Data Sources The monthly precipitation data from 1970 to 2020 for 45 meteorological stations in Inner Mongolia used in this study is sourced from the China Meteorological Data Sharing Service System (http://data.cma.cn/).
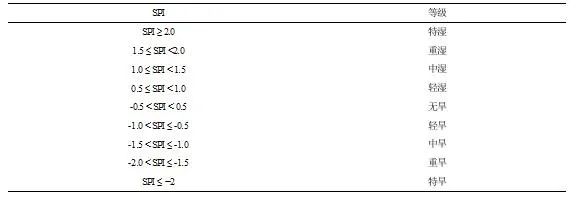
3.2 Research Methods ① Standardized Precipitation Index (SPI): The SPI index is obtained by establishing a normal distribution model for monthly precipitation data, calculating the precipitation Γ distribution probability, and then normalizing it to classify meteorological drought levels based on standardized precipitation cumulative frequency distribution, as shown in Table 1. According to the “Meteorological Drought Level GB/T 20481-2017”, the SPI calculation formula based on the Γ fitting function is as follows:
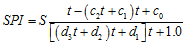 (1)
Where:
(1)
Where:  ; G(x) is the precipitation distribution probability related to the Γ function; x is the precipitation data sample; S is the probability density sign coefficient; when G(x) > 0.5, S=1; when G(x) ≤ 0.5, S=-1; c0, c1, c2, and d1, d2, d3 are the calculation parameters for the cumulative frequency approximation of the Γ distribution function: c0=2.515517, c1=0.802853, c2=0.010328, d1=1.432788, d2=0.189269, d3=0.001308.
G(x) is calculated using the precipitation Γ distribution function probability density integral formula:
; G(x) is the precipitation distribution probability related to the Γ function; x is the precipitation data sample; S is the probability density sign coefficient; when G(x) > 0.5, S=1; when G(x) ≤ 0.5, S=-1; c0, c1, c2, and d1, d2, d3 are the calculation parameters for the cumulative frequency approximation of the Γ distribution function: c0=2.515517, c1=0.802853, c2=0.010328, d1=1.432788, d2=0.189269, d3=0.001308.
G(x) is calculated using the precipitation Γ distribution function probability density integral formula:
 (2)
Where γ and β are the shape and scale parameters of the Γ distribution function, estimated using the maximum likelihood method.
The SPI values for 1 month, 3 months, 6 months, and 12 months for the 45 meteorological stations in the study area are calculated, denoted as SPI-1, SPI-3, SPI-6, and SPI-12, respectively.
Table 1: Classification Standards for Standardized Precipitation Index Drought Levels
(2)
Where γ and β are the shape and scale parameters of the Γ distribution function, estimated using the maximum likelihood method.
The SPI values for 1 month, 3 months, 6 months, and 12 months for the 45 meteorological stations in the study area are calculated, denoted as SPI-1, SPI-3, SPI-6, and SPI-12, respectively.
Table 1: Classification Standards for Standardized Precipitation Index Drought Levels
② Wavelet Analysis: Wavelet analysis can identify the magnitude of periodicities contained in a time series and their distribution in the time domain, while also providing amplitude and phase information about the time series changes, clearly revealing various periodic changes hidden in the time series. The basic idea is to use a cluster of wavelet functions to represent or approximate a signal. The Morlet wavelet has good local properties in both time and frequency domains, allowing for the exhibition of the fine structure of time series. The wavelet function φ(t) is key to wavelet analysis, referring to a class of functions that have oscillatory characteristics and can quickly decay to zero, defined as:
 (3)
Where φ(t) is the base wavelet function, which can be constructed by scaling and translating the time axis to form a cluster of wavelet function systems.
This article employs Morlet wavelet analysis to explore the multi-time scale changes and periodic characteristics of the SPI index in Inner Mongolia.
③ Drought Intensity and Impact Range: Drought intensity is used to evaluate the severity of drought. The drought intensity for a specific period at a single station can be reflected by the SPI index, while the drought impact range is determined by the proportion of drought stations in a certain area to the total number of stations, calculated as follows:
(3)
Where φ(t) is the base wavelet function, which can be constructed by scaling and translating the time axis to form a cluster of wavelet function systems.
This article employs Morlet wavelet analysis to explore the multi-time scale changes and periodic characteristics of the SPI index in Inner Mongolia.
③ Drought Intensity and Impact Range: Drought intensity is used to evaluate the severity of drought. The drought intensity for a specific period at a single station can be reflected by the SPI index, while the drought impact range is determined by the proportion of drought stations in a certain area to the total number of stations, calculated as follows:
 (4)
(4)
 (5)
Where i represents different station codes, j represents different years, m is the number of drought stations in year j, SPIi is the SPI index value of drought station i, M is the total number of meteorological stations in the study area, and mj is the number of drought stations in year j. According to the drought level: when drought intensity Sjjjj ≥ 1.5 is severe drought; when Pj ≥ 50%, more than half of the stations in the study area experience drought, indicating widespread drought; 33% ≤ Pj < 50% indicates regional drought; 25% ≤ Pj < 33% indicates partial regional drought; 10% ≤ Pj < 25% indicates localized drought; when Pj < 10%, there is no significant drought occurrence.
4. Temporal and Spatial Distribution Characteristics and Evolution Trends of Dry and Wet Climate in Inner Mongolia
4.1 Dry and Wet Characteristics in Inner Mongolia Based on SPI Index
(1) Interannual Climate Dry and Wet Variation Characteristics: The smaller the time scale of the SPI index, the more significant the regional dry and wet variation characteristics; the larger the scale, the more intuitive the seasonal and interannual drought and flood alternating processes. The interannual SPI-12 index for the entire Inner Mongolia region and its ecological functional areas from 1970 to 2020 was averaged, as shown in Figure 2. An interannual change slope greater than 0 indicates an upward trend in the SPI index, indicating alleviated drought; the greater the slope value, the more significant the trend towards climate wetting; conversely, the opposite is true. Figure 2 shows that the linear change slope of the SPI index for the entire region is -0.011·(10 a)-1, indicating a non-significant trend towards drought; except for slight alleviation in drought in the eastern forest area and western desert area, other functional areas show varying degrees of drought trends; the interannual change slope of the SPI index in different grassland types shows the characteristic: typical grassland area > meadow grassland area > desert grassland area.
(5)
Where i represents different station codes, j represents different years, m is the number of drought stations in year j, SPIi is the SPI index value of drought station i, M is the total number of meteorological stations in the study area, and mj is the number of drought stations in year j. According to the drought level: when drought intensity Sjjjj ≥ 1.5 is severe drought; when Pj ≥ 50%, more than half of the stations in the study area experience drought, indicating widespread drought; 33% ≤ Pj < 50% indicates regional drought; 25% ≤ Pj < 33% indicates partial regional drought; 10% ≤ Pj < 25% indicates localized drought; when Pj < 10%, there is no significant drought occurrence.
4. Temporal and Spatial Distribution Characteristics and Evolution Trends of Dry and Wet Climate in Inner Mongolia
4.1 Dry and Wet Characteristics in Inner Mongolia Based on SPI Index
(1) Interannual Climate Dry and Wet Variation Characteristics: The smaller the time scale of the SPI index, the more significant the regional dry and wet variation characteristics; the larger the scale, the more intuitive the seasonal and interannual drought and flood alternating processes. The interannual SPI-12 index for the entire Inner Mongolia region and its ecological functional areas from 1970 to 2020 was averaged, as shown in Figure 2. An interannual change slope greater than 0 indicates an upward trend in the SPI index, indicating alleviated drought; the greater the slope value, the more significant the trend towards climate wetting; conversely, the opposite is true. Figure 2 shows that the linear change slope of the SPI index for the entire region is -0.011·(10 a)-1, indicating a non-significant trend towards drought; except for slight alleviation in drought in the eastern forest area and western desert area, other functional areas show varying degrees of drought trends; the interannual change slope of the SPI index in different grassland types shows the characteristic: typical grassland area > meadow grassland area > desert grassland area.
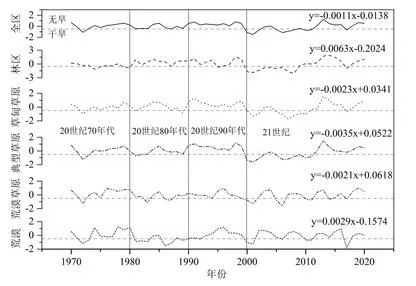
Figure 2: Interannual Variation of SPI Index in Different Ecological Functional Areas of Inner Mongolia from 1970 to 2020
Taking the decades as an example, the climate dry and wet changes in Inner Mongolia exhibit the following characteristics: in the 1970s, drought frequently occurred in the eastern forest area, but the overall region showed a certain trend towards wetness; in the 1980s, the dry and wet climate in Inner Mongolia alternated, with light drought prevailing in the central typical grassland area, western desert grassland area, and western desert area; in the 1990s, the overall climate was relatively humid, with varying degrees of drought alleviation in different ecological functional areas compared to the 1980s; entering the 21st century, the SPI index sharply declined, significantly falling below the drought critical value level of -0.5, with frequent drought climate, mainly concentrated between 2000 and 2011. Overall, from 1970 to 2020, drought in Inner Mongolia shows a gradual alleviation in the eastern forest area and western desert area, while the central grassland area worsens, consistent with historical drought statistics and natural disaster yearbooks of Inner Mongolia, effectively validating the feasibility of the SPI index in reflecting drought conditions in Inner Mongolia.
(2) Interannual Drought Frequency, Intensity, and Impact Range: The analysis of the climate dry and wet characteristics in Inner Mongolia is conducted from three aspects: drought frequency, drought impact range, and drought intensity. Figure 3 illustrates the spatial distribution of drought occurrence frequency in Inner Mongolia from 1970 to 2020, showing that the drought frequency in the entire region ranges from 21.15% to 44.23%. The drought frequency in the eastern forest area and western desert area ranges from 30.77% to 34.62% and 21.15% to 40.38%, respectively; the drought frequency in the central grassland area, meadow grassland, typical grassland, and desert grassland is 26.92% to 40.38%, 26.92% to 44.23%, and 28.85% to 36.54%, respectively. The northeast of the typical grassland area, such as Xinjabarhu Left Banner, central Xilinhot, southeast Balinzuoqi, and Baoguotu, is a frequent drought area with a drought frequency greater than 40%.
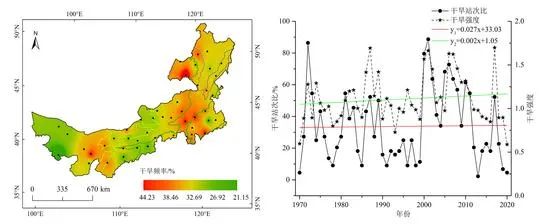
Figure 3: Spatial Distribution of Drought Frequency in Inner Mongolia from 1970 to 2020 Figure 4: Drought Station Ratio and Drought Intensity in Inner Mongolia from 1970 to 2020
Figure 4 shows the drought station ratio and drought intensity curve in Inner Mongolia from 1970 to 2020, with both linear change slopes showing a certain upward trend. Over the past 51 years, Inner Mongolia has mainly experienced widespread and localized drought, with widespread drought occurring in 15 years, mostly in the first 10 years of the 21st century, regional drought occurring in 7 years, concentrated in the 1980s, partial regional drought occurring in 7 years, and localized drought occurring in 13 years, with no significant drought years in 9 years, specifically in 1970, 1978, 1985, 1991, 1996, 1998, 2013, 2019, and 2020. The drought intensity is mainly light to moderate, with frequencies of light drought, moderate drought, severe drought, and extreme drought being 14.68%, 9.27%, 5.16%, and 4.06%, respectively. Severe drought occurred in 6 years, specifically in 1987, 2000, 2001, 2006, 2007, and 2017.
Using the above methods, the drought frequency, drought station ratio, and drought intensity in different ecological functional areas are explored, revealing that the typical grassland area has significantly higher drought frequency, drought station ratio, and drought intensity compared to other ecological functional areas, while the desert grassland area has the lowest drought occurrence frequency, but its drought station ratio and drought intensity are significantly higher than those of the desert area. In contrast, the drought intensity in the forest area is the weakest.
(3) Seasonal Climate Dry and Wet Variation Characteristics: The vegetation greening period in Inner Mongolia generally occurs between April 26 and May 23, hence drought in spring directly affects the timing of vegetation greening, while summer and autumn droughts significantly influence vegetation growth season coverage, height, and productivity. Figure 5 illustrates the seasonal variation characteristics of the SPI index, indicating that the overall climate in summer tends towards dryness, with its linear change slope significantly higher than the interannual SPI index decline level, reaching -0.047·(10 a)-1; the trend towards wetness in winter is significant, while spring and autumn are relatively secondary. The seasonal variation trends of the SPI index in different ecological functional areas show that the eastern forest area, western desert grassland area, and desert area exhibit significant alleviation trends in spring drought, while the meadow grassland area and typical grassland area primarily show alleviation in autumn and winter drought, respectively. Based on seasonal scales, the main drought types in Inner Mongolia during the 20th century were summer and winter drought in the 1970s, significant spring drought in the 1980s and 1990s, and frequent spring, summer, and autumn droughts in the first decade of the 21st century, with summer drought frequency significantly higher than other seasons, while after 2011, drought conditions alleviated, with summer drought occurring in individual years.
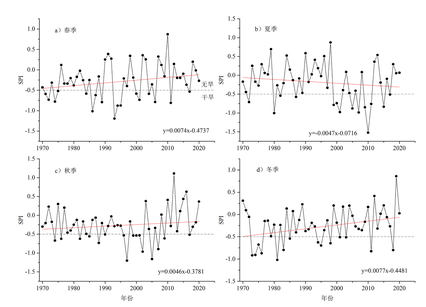
Figure 5: SPI Index Variation Trends in Different Seasons in Inner Mongolia from 1970 to 2020
4.2 Multi-Scale SPI Index Dry and Wet Spatial Patterns
Figure 6 shows the spatial distribution of the slope changes of the SPI index in Inner Mongolia from 1970 to 2020 at different time scales, using the inverse distance weighting spatial interpolation method. Negative values (orange) indicate a decline in the SPI index, suggesting a trend towards drought; positive values (blue) indicate an increase in the SPI index, suggesting a trend towards normal or wet conditions. Figure 6 shows significant differences in the spatial change trends of the SPI index at different time scales; the larger the scale, the broader the regional drought impact range and the more significant the change trend. In most areas of Inner Mongolia, the SPI-1 and SPI-3 index change trends are negative, reaching a maximum of -0.003·(10 a)-1, revealing a certain drought risk in the region over short time periods, with significant drought trends in the central Xilin Gol typical grassland area and western Alxa desert area; at the 6-month and 12-month time scales, the drought range in Inner Mongolia expands, with the drought trend mainly concentrated in the central typical grassland area; except for a few stations, the overall drought conditions in Inner Mongolia show characteristics of alleviation in the western desert area and exacerbation in the central and southeastern areas.
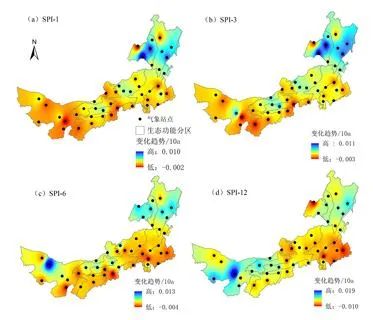
Figure 6: Spatial Distribution of Linear Change Trends of SPI Index in Inner Mongolia from 1970 to 2020
4.3 Evolutionary Cycles of Dry and Wet Climate in Inner Mongolia
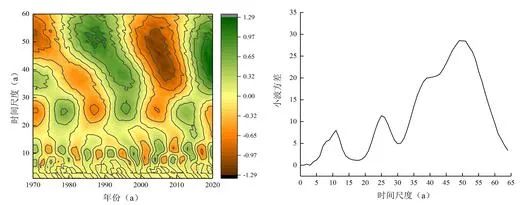
Using Morlet continuous wavelet transform, the interannual dry and wet evolution cycles of climate in Inner Mongolia from 1970 to 2020 are analyzed. The wavelet coefficients reveal the strength of signal oscillation and the periodic changes of dry and wet conditions, with the contour map of the real part of the coefficients reflecting the distribution of the SPI index across the entire time domain; a positive center indicates a humid climate (high drought index), while a negative center indicates a dry climate (drought period); the wavelet variance reflects the distribution of the energy of SPI time series fluctuations with scale a, used to determine the main cycles present during the dry and wet evolution process and the future change trends of the SPI index at different time scales.
Figure 7 depicts the wavelet coefficient contour and wavelet variance diagram of the annual SPI index in Inner Mongolia, indicating three periodic changes at the annual scale: short cycles of 5-15 years, 21-30 years, and a long cycle of 35-60 years, with two short cycles showing clear drought-wet alternating processes; the long cycle scale reveals two evident drought-wet alternating processes. Throughout the time scale, the drought characteristics in the 1970s and the first ten years of the 21st century are significant, with stable dry and wet climate characteristics during the analysis period, showing a widespread trend, and the wet period has not yet closed as of 2020. The wavelet variance diagram of the SPI index in Inner Mongolia shows three distinct peaks, corresponding to the first, second, and third main cycles of 49 years, 25 years, and 11 years, respectively, indicating that the fluctuations of these three cycles control the change characteristics of Inner Mongolia across the entire time domain. Based on the wavelet analysis contour map in Figure 7(a), the first main cycle indicates that Inner Mongolia will remain in a normal or slightly humid climate for a certain period in the present and future, while the 25-year cycle will experience alternating dry and wet conditions.
(a) Wavelet Coefficient Contour Map (b) Wavelet Variance Map
Figure 7: Wavelet Change Analysis of Annual SPI Index in Inner Mongolia from 1970 to 2020
Based on the results of the wavelet variance test, the wavelet coefficient map of the first main cycle of interannual dry and wet changes in Inner Mongolia from 1970 to 2020 is drawn (Figure 8), revealing that at the characteristic time scale of 49 years, the average change period of the SPI index is about 33 years, experiencing approximately two dry-wet transition periods; in wavelet transformation, the zero-crossing points of wavelet coefficient process lines at different time scales correspond to mutation points, where low-frequency scales better reflect actual changes in the series.
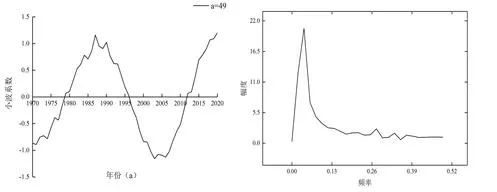
(a) First Main Cycle Wavelet Coefficient (b) First Main Cycle Frequency Amplitude
Figure 8: Wavelet Real Part Process Line of Annual SPI Index in Inner Mongolia from 1970 to 2020
(1) From 1970 to 2020, the interannual SPI index in Inner Mongolia showed a decline of -0.011·(10 a)-1, indicating a non-significant increase in drought; the trend towards summer drought is significant, with a decline in the SPI index reaching -0.047·(10 a)-1, significantly higher than the interannual average level, while drought conditions in other seasons show a trend of alleviation; the average drought frequency in the study area over the years ranges from 21.15% to 44.23%, with drought intensity mainly consisting of light to moderate drought, and the impact range is mostly characterized by widespread and localized drought.
The dry and wet characteristics of climate in Inner Mongolia exhibit significant temporal and spatial regionality and complexity. In terms of time scales, the significant reduction in precipitation is the primary cause of drought occurrences. From 1960 to 2016, the years with the least and most precipitation in Inner Mongolia were 2000-2009 and 1990-1999, respectively, with widespread reductions in precipitation being the main cause of frequent drought events in the first decade of the 21st century; from 1970 to 2020, summer drought in Inner Mongolia is prominent and shows a continuous worsening trend, with critical drought years concentrated in 1998-1999, consistent with the year of transition from wet to dry conditions in Inner Mongolia identified by Ma Zice and others; Zhang Xuting et al. found that summer drought in Inner Mongolia significantly intensified from 1960 to 2015 based on the SPEI index, with autumn as the next significant season, while spring and winter mainly showed alleviation, which is generally consistent with this study’s findings, although there is some deviation in the autumn drought change trend, mainly due to differences in time series length and the consideration of evapotranspiration in the SPEI index.
(2) The spatial distribution of the SPI index at different time scales reveals that from 1970 to 2020, drought in the northeastern forest area and western desert area of Inner Mongolia has alleviated, while the central grassland area shows a significant trend towards drought; among different grassland types, the typical grassland area exhibits significantly higher drought frequency, impact range, and intensity compared to the meadow grassland area and desert grassland area.
The northeastern part of Inner Mongolia belongs to the forest coverage area of the Greater Khingan Range, where temperature and humidity conditions can meet the greening period requirements of vegetation earlier. Compared to grassland and desert areas, the forest ecosystem has a high coverage rate and good development, making it relatively slow and delayed in terms of drought impact on its greening. After 1998, the northeastern forest area of Inner Mongolia experienced an average delay of 0.47 days per year in the greening period due to temperature and precipitation changes, making it more susceptible to secondary disasters such as forest fires and pests caused by drought. However, the climate in the forest area is relatively cold and water-rich, so apart from precipitation impacts, temperature changes also significantly affect vegetation growth and drought conditions. The different underlying surfaces in the eastern, central, and western Inner Mongolia respond differently to regional drought due to the influence of westerly circulation and plateau monsoon, with the slope of annual precipitation from 1960 to 2016 showing an increasing-decreasing-increasing trend from west to east, impacting the spatial distribution of drought; the western underlying surface is primarily composed of desert and sandy areas, where the influence of surface soil properties on precipitation and evaporation changes is minimal, while the central and eastern agricultural-pastoral interlaced areas are affected by increased temperatures and decreased rainfall, leading to an increased trend towards drought. Additionally, the alleviation of drought in the western region of Inner Mongolia may be related to the trend towards humidity and increased environmental protection efforts, as well as factors such as El Niño and solar activity.
(3) The alternating dry and wet climate in Inner Mongolia shows that over the first main cycle time scale of 49 years, Inner Mongolia has experienced approximately two dry and wet alternating climates, and as of 2020, the warm and humid process has not yet concluded, with the short cycle of 11 years coinciding with solar activity cycles.
From 1970 to 2020, the alternating patterns of drought and humidity in Inner Mongolia are evident, with the annual SPI index showing short cycles of 11 years and long cycles of 49 years. The short cycle variations align with the approximately 11-year solar activity cycle, while the long cycle exceeds the 22-year magnetic reversal cycle of sunspots, indicating that the SPI index’s changes are influenced by precipitation variations, solar activity, and other factors, with a trend towards increased humidity in Inner Mongolia at the long cycle scale.
The standardized precipitation SPI index mainly reflects meteorological drought caused by changes in precipitation in the region. While it can reveal climatic dry and wet characteristics to some extent, meteorological drought may not necessarily lead to disaster occurrences. Due to the uneven temporal and spatial distribution of climatic conditions in Inner Mongolia, using a single meteorological drought index often fails to provide a complete understanding of drought evolution characteristics. In the future, to achieve precise monitoring and prevention of drought and flood disasters, it is necessary to combine indicators such as agricultural drought, hydrological drought, and socio-economic drought for targeted analysis of drought characteristics under different underlying surface conditions in Inner Mongolia.
Zhao Shuixia, Zhou Quancheng, Wang Wenjun, Wu Yingjie. Climate Characteristics of Inner Mongolia Based on SPI Index [J]. Journal of China Institute of Water Resources and Hydropower Research (Chinese and English), 2022, 20(1): 10-19.