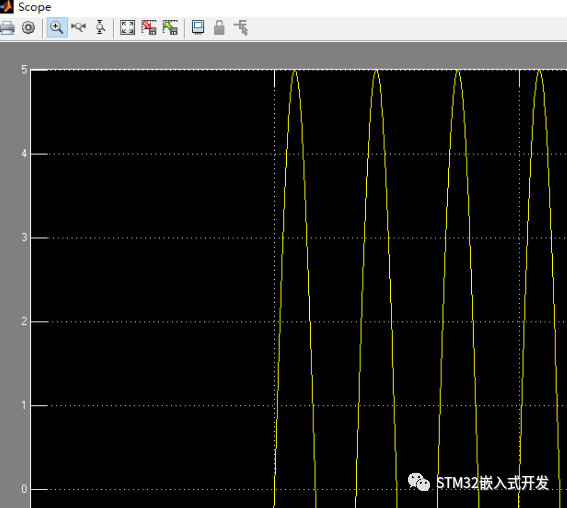
This article demonstrates how to perform circuit simulation using MATLAB to measure the voltage of an RLC circuit. I am using R2014a, and the interface may vary slightly in different versions of the software.
Open the MATLAB software and create a new Simulink Model, as shown in the figure below.
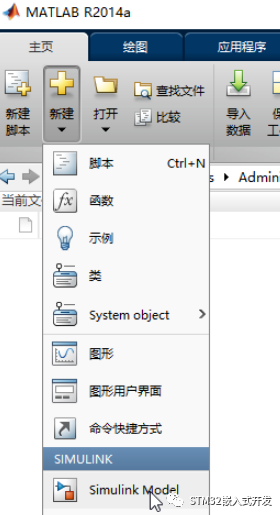
After the untitled window pops up, enter the following command in the command line window and press Enter:
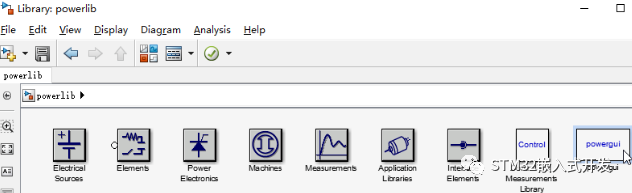
>> powerlibThis will invoke the powerlib library.
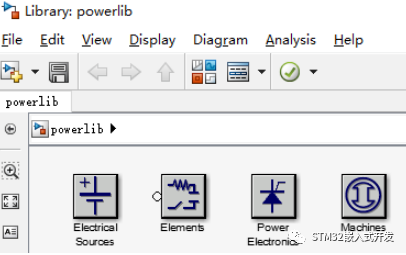
Double-click on Electrical Sources to open the power module.
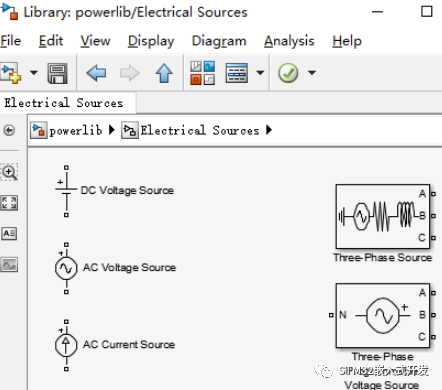
Drag the AC Voltage Source into the untitled window.
Then double-click on Elements in the powerlib library.
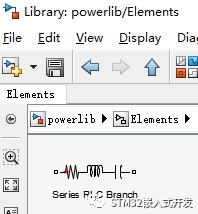
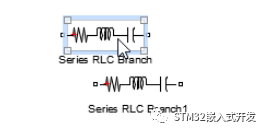
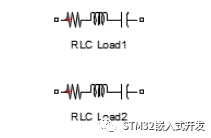
Drag the Series RLC Branch into the window, select it, and press Ctrl+C, Ctrl+V to copy another Series RLC Branch1.
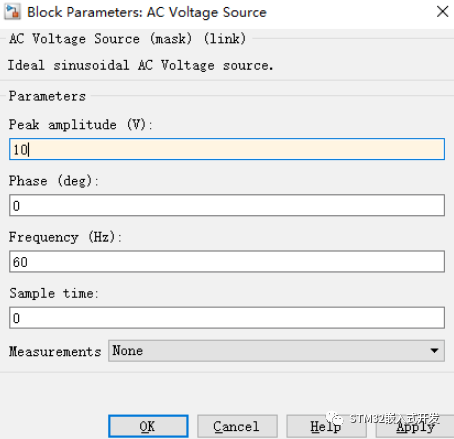
Double-click on the AC Voltage Source in the window to bring up the parameter settings dialog, as shown in the figure, setting the voltage to 10V and the frequency to 60Hz.
Click on the label, press Ctrl+A to select it, turning it blue.

Rename the two Series RLC Branches to RLC Load1 and RLC Load2, respectively.
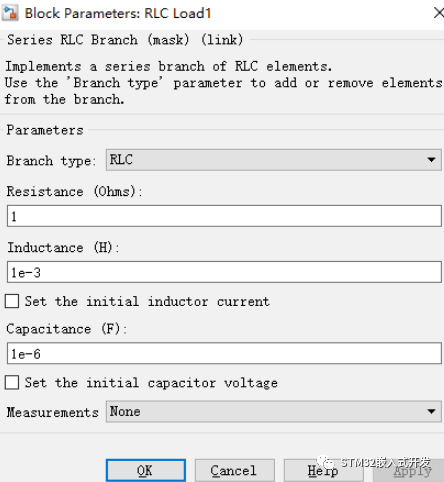
Double-click on RLC Load1 and RLC Load2 to set the resistance, inductance, and capacitance parameters.
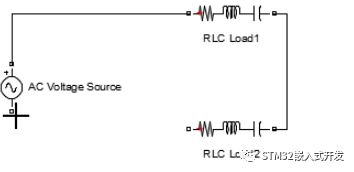
Click and drag the terminal connections to connect the circuit.
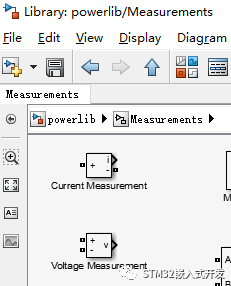
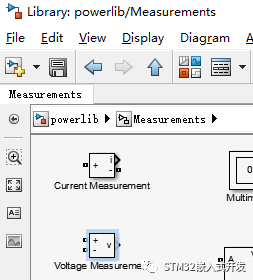
You need to call the Voltage Measurement from the Measurements module to measure the voltage, dragging it into the window.
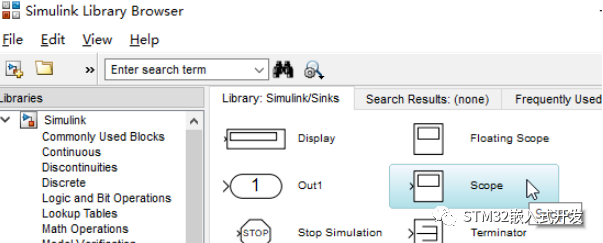
Use the virtual oscilloscope Scope from the Sinks in the Simulink module to display the waveform, dragging it into the window.
Drag the interactive interface tool powergui into the window.
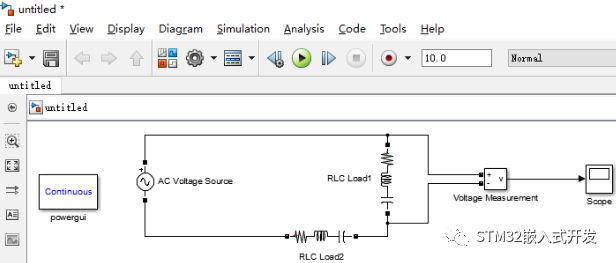
Finally, the connected circuit simulation model is as shown below.
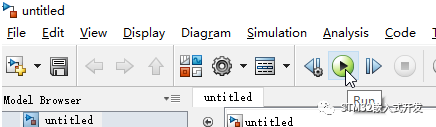
Click the Run button to start the simulation.
After the simulation is complete, double-click on Scope to view the simulation waveform.