More content can be added to the Linux system knowledge base package (tutorials + videos + Q&A).

Table of Contents
- 1. Specifying the ftrace Tracer
- 2. Setting the Functions to Trace
- 3. ftrace Switches
- 4. Viewing the Trace
- 5. Using trace-cmd
- 6. Common Options for trace-cmd
- 6.1. Viewing Available Trace Events
- 6.2. Tracing Function Calls of a Specific Process
- 6.3. Function Filtering
- 6.4. Limiting Trace Depth
- 6.5. Tracing Specific Events
Consolidate, share, and grow, so that both you and others can gain something! 😄
Ftrace is a kernel debugging tool supported since Linux kernel version 2.6. Initially, Ftrace was mainly used for function-level tracing, but it has evolved into a general debugging framework capable of serving various tracing purposes.
Ftrace provides an access interface to user space through the debugfs virtual file system. Typically, debugfs is mounted at the /sys/kernel/debug directory, and the control and output files for Ftrace are located in the tracing subdirectory, with the full path being /sys/kernel/debug/tracing.
For example, to observe the call stack of do_sys_open, the usage of ftrace is as follows:
# Set the tracer type to function_graph
sudo sh -c "echo function_graph > /sys/kernel/debug/tracing/current_tracer"

# Set the function to observe the call stack
sudo sh -c "echo do_sys_open > /sys/kernel/debug/tracing/set_graph_function"

# Set observation options: enable process TASK/PID printing
sudo sh -c "echo funcgraph-proc > /sys/kernel/debug/tracing/trace_options"

# Start tracing
sudo sh -c "echo 1 > /sys/kernel/debug/tracing/tracing_on"

# Wait for a while

# Stop tracing
sudo sh -c "echo 0 > /sys/kernel/debug/tracing/tracing_on"

# View the trace
sudo cat /sys/kernel/debug/tracing/trace
The content of the trace is as follows: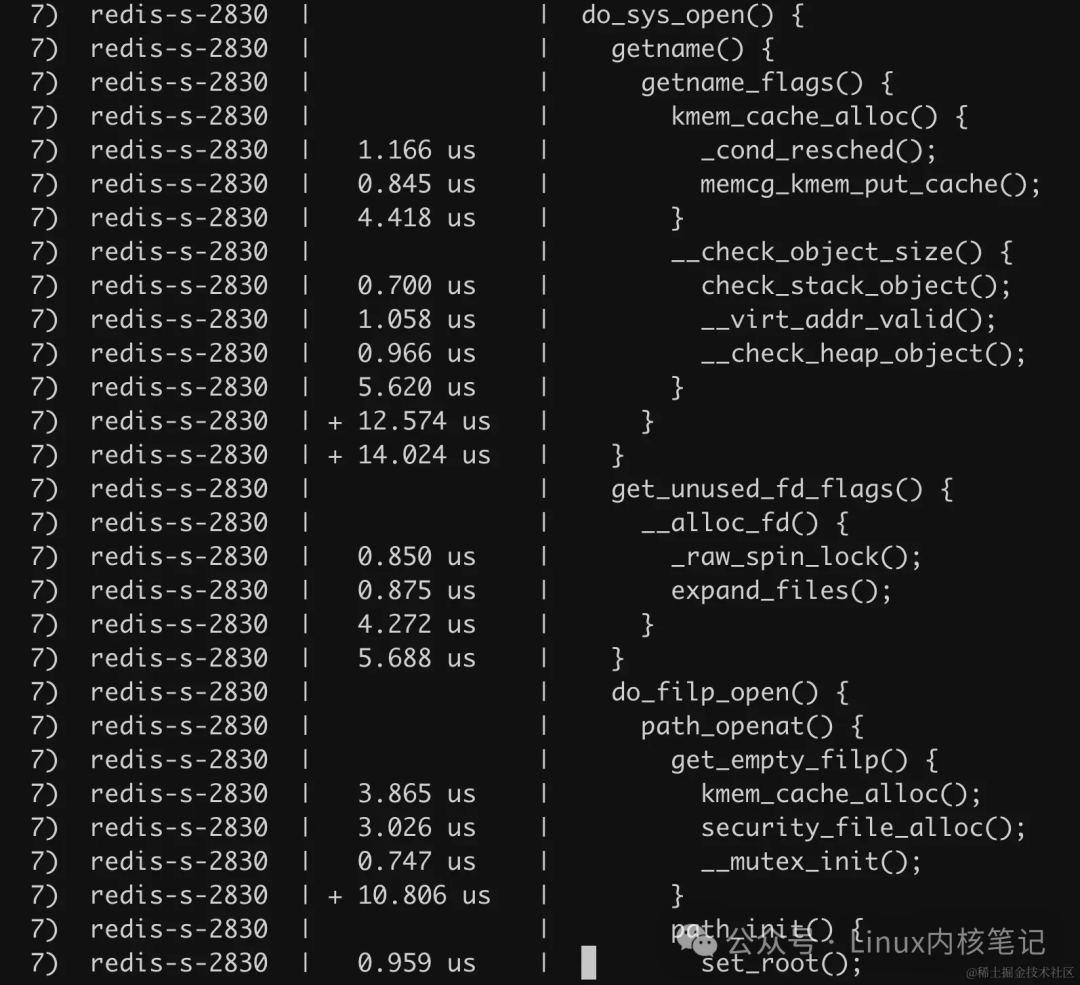
1. Specifying the ftrace Tracer
Ftrace supports various tracing types, including function calls, function graphs, hardware latency, interrupt disabling, preemption disabling, etc. We can check the supported tracing types of ftrace through the relevant files in /sys/kernel/debug/.
sudo cat /sys/kernel/debug/tracing/available_tracers

hwlat blk mmiotrace function_graph wakeup_dl wakeup_rt wakeup function nop
The commonly used types are function and function_graph. To set the tracer type, you need to write the type into the current_tracer file. For example, to set the type to function_graph, you can do it like this:
sudo sh -c "echo function_graph > /sys/kernel/debug/tracing/current_tracer"
2. Setting the Functions to Trace
set_ftrace_filter indicates the function to be traced. For example, to trace epoll_wait, you can do it like this:
sudo sh -c "echo SyS_epoll_wait > /sys/kernel/debug/tracing/set_ftrace_filter"
set_graph_function is used to set the trigger function for the function_graph tracer. It not only traces the specified function but also traces all the sub-functions called by that function.
3. ftrace Switches
The ftrace switch is controlled through the tracing_on file.
# Stop tracing
sudo sh -c "echo 0 > /sys/kernel/debug/tracing/tracing_on"
# Start tracing
sudo sh -c "echo 1 > /sys/kernel/debug/tracing/tracing_on"
4. Viewing the Trace
sudo cat /sys/kernel/debug/tracing/trace

#tracer: function
#
#entries-in-buffer/entries-written:2972/2972   #P:12
#
#                              _-----=> irqs-off
#                             / _----=> need-resched
#                            |/ _---=> hardirq/softirq
#                            ||/ _--=> preempt-depth
#                            |||/     delay
#TASK-PID   CPU#  ||||    TIMESTAMP  FUNCTION
#              |||||||||
    redis-server-2831[007]....8269637.719334: SyS_epoll_wait <-do_syscall_64
    redis-server-2830[010]....8269637.720688: SyS_epoll_wait <-do_syscall_64
From this trace, I can see the process name, process ID, the CPU the process is running on, the timestamp of the executed function, and other information.
As seen from the above example, using ftrace can be quite cumbersome; in practice, trace-cmd is used more often. trace-cmd is a user-space command-line tool for interacting with ftrace. It provides a more convenient interface to configure and use ftrace, avoiding the hassle of directly manipulating the debugfs file system.
5. Using trace-cmd
The common commands for trace-cmd are as follows:
- trace-cmd record: Records real-time tracing data and writes it to the trace.dat file.
- trace-cmd report: Reads the trace.dat file and converts the binary data into a readable ASCII text format.
- trace-cmd start: Starts tracing but does not record to the trace.dat file.
- trace-cmd stop: Stops tracing.
- trace-cmd extract: Extracts data from the kernel buffer and creates a trace.dat file.
- trace-cmd reset: Disables all tracing and restores system performance.Next, we will use trace-cmd to achieve the effect of observing the do_sys_open function call graph as done previously with ftrace.
First, use record to log trace data:
trace-cmd record -p function_graph -g do_sys_open
Note that trace-cmd enables the funcgraph-proc trace option by default, so there is no need to specify it manually.When you exit this trace-cmd using ctrl-c, a trace.dat file will be generated in the current directory. Next, use report to read trace.dat and generate readable text: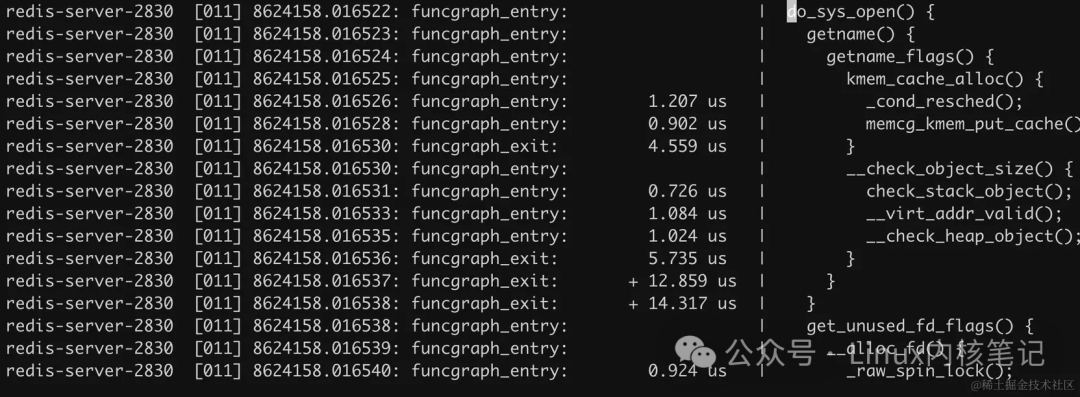
6. Common Options for trace-cmd
6.1. Viewing Available Trace Events
When we are unsure of which events can be traced, we can use trace-cmd list to enumerate all available events on the current system:
trace-cmd list -e
It can also take an optional parameter to filter using regular expressions:
trace-cmd list -e '^sched.*' # List all events starting with sched
6.2. Tracing Function Calls of a Specific Process
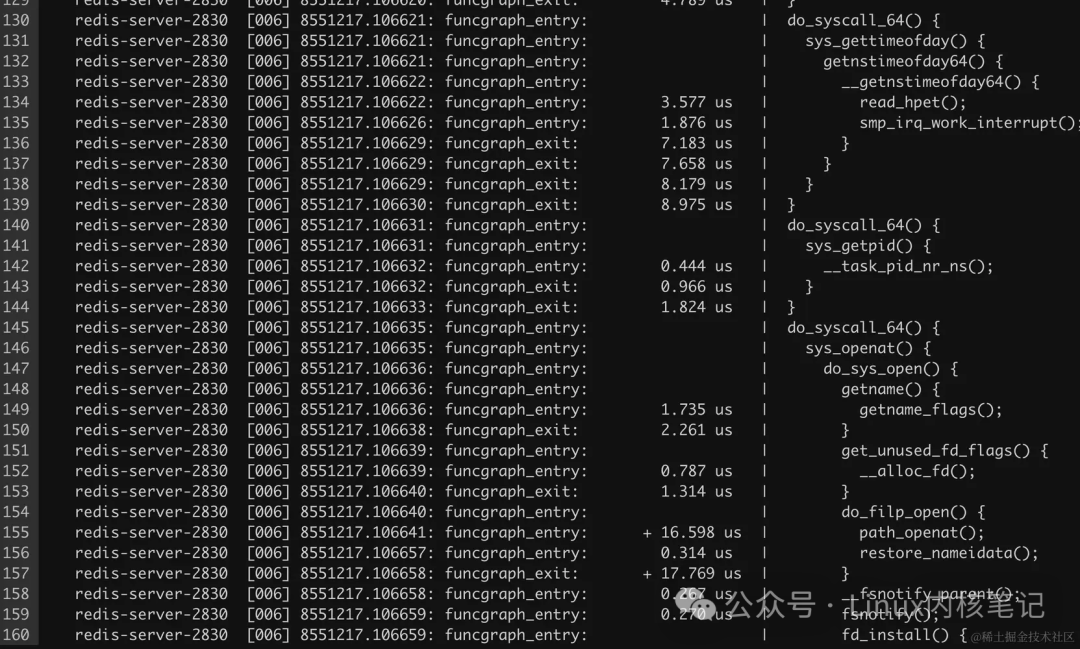
If you only want to trace function calls of a specific process, you can use the -P option to specify the process’s PID. For example, to trace the process with PID 10885, you can use the following command:
trace-cmd record -p function_graph -P 2830
6.3. Function Filtering
The -g option is used for the function_graph plugin, where -g do_sys_open indicates that only the do_sys_open function and all its sub-functions will be traced.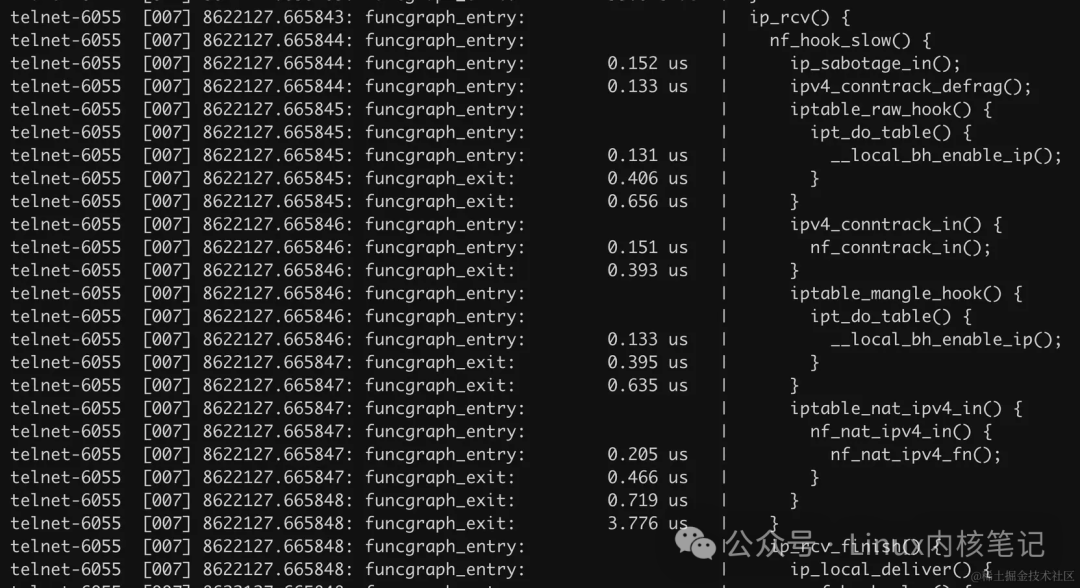 The -l option specifies the functions to trace. For example, to trace all functions starting with ext4_, you can use the following command:
trace-cmd record -p function_graph -l "ext4_*"
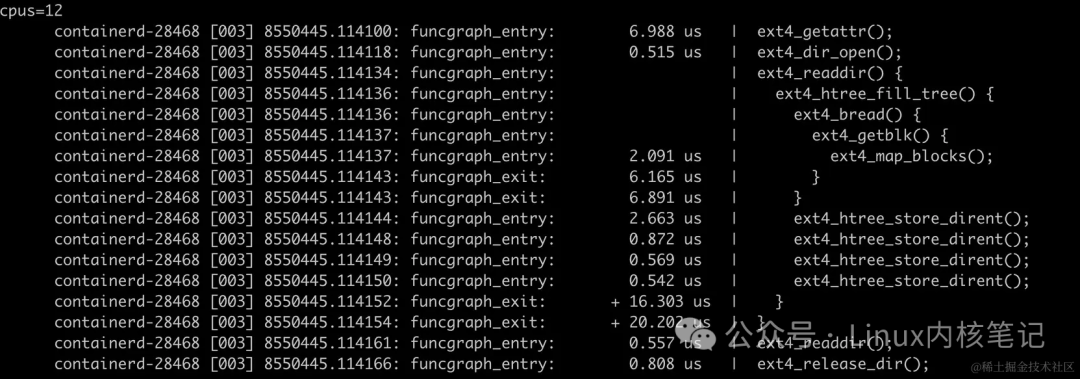
The differences between -l and -g are also quite evident:
- -l does not trace internal sub-function calls;
- -g traces sub-functions called within the function.
6.4. Limiting Trace Depth
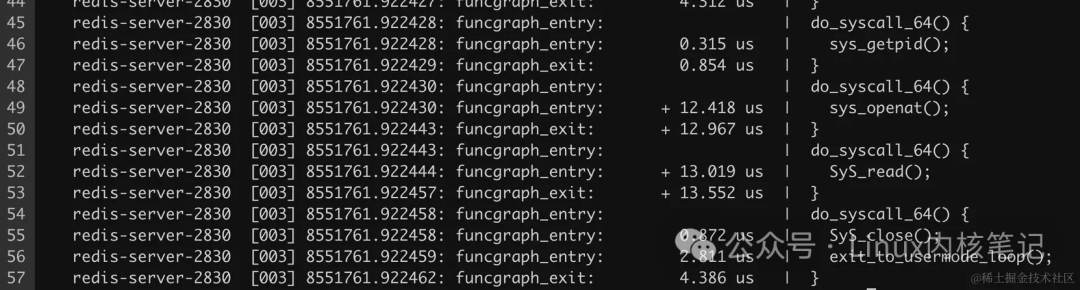
By default, trace-cmd’s function_graph records all nested function calls. You can limit the trace depth by setting –max-graph-depth. For example, to set the depth to 2, you can use the following command:
trace-cmd record -p function_graph --max-graph-depth 2 -P 2830
6.5. Tracing Specific Events
You can combine event tracing -e to obtain more detailed information, such as -e sched:sched_switch to specify tracing scheduling switch events. You can also use regular expressions to filter, such as tracing nfs-related events:
trace-cmd record -e "nfs:*"