Keywords: LLVM, performance, Roofline model, RISC-V, PMU, T-Head, SpacemiT, SiFive
- Dissecting RISC-V Performance: Practical PMU Profiling and Hardware-Agnostic Roofline Analysis on Emerging Platforms
- https://arxiv.org/abs/2507.22451
- https://github.com/alexbatashev/miniperf
- This article contains 9271 words and takes 31 minutes to read, the podcast is 8 minutes long as follows
Recommended Articles
- A Brief Discussion on the Methodology Behind C/C++ Performance Optimization: Top-down Micro-architecture Analysis
- KPerfIR: An Extended Open-source Compiler Center Performance Tool for GPUs with 8.2% Overhead for 24.1% FA3 Kernel Performance Improvement
- This article compares works similar to Triton KPerfIR
- OSDI25: A Systematic Framework for Sequential Performance Optimization: Three Principles, Eight Methods, SysGPT Recommendation Model (Recommendation Accuracy Exceeds GPT-4 by 64.6%)
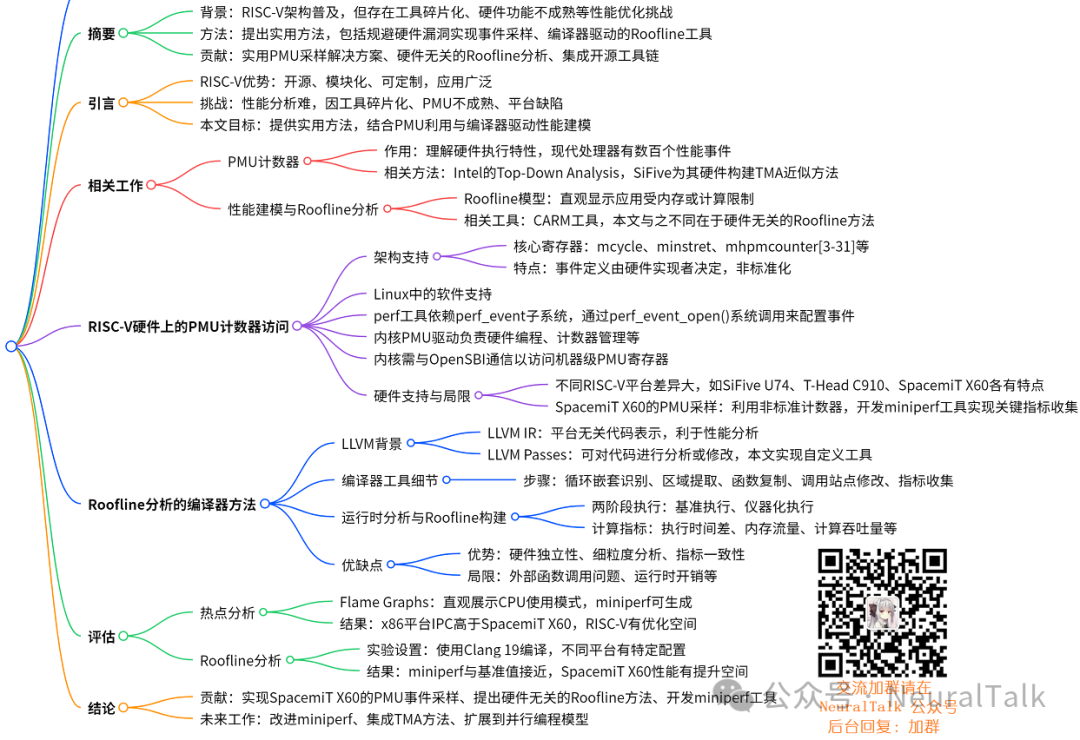
As the RISC-V architecture (an open-source instruction set architecture) gains popularity in embedded and high-performance domains, developers face ongoing challenges in performance optimization, which arise from tool fragmentation, immature hardware capabilities, and platform-specific defects.
This article provides a practical approach for extracting actionable performance insights on RISC-V systems, even under constrained or unreliable hardware conditions.
We propose amethod to bypass hardware vulnerabilities in RISC-V implementations to achieve reliable event sampling. For memory-computation bottleneck analysis, we introduce a compiler-driven Roofline tool (a performance modeling tool for analyzing program computation and memory bottlenecks), which does not rely on hardware PMUs (performance monitoring units, hardware components for monitoring processor performance events), but instead utilizes LLVM-based instrumentation techniques (a technique for collecting information by inserting additional code into the code) to derive operational intensity and throughput metrics directly from the application’s IR (intermediate representation, a form of code processed by the compiler).
Our open-source toolchain automates these solutions, integrating PMU data calibration and compiler-guided Roofline construction into a single workflow.
Key Issues
Question 1: The PMU sampling workaround proposed in the paper primarily targets SpacemiT X60, while the RISC-V ecosystem includes various significantly different hardware implementations such as SiFive U74 and T-Head C910. How adaptable are these methods to other hardware? Is it necessary to develop specific workarounds for each hardware, and does this undermine their practical value in a fragmented ecosystem?
Regarding the adaptability of the PMU sampling scheme to other RISC-V hardware, the authors point out that there is significant heterogeneity in RISC-V hardware PMU capabilities (e.g., SiFive U74 lacks overflow interrupt support, T-Head C910 relies on vendor kernel modifications).
The current workaround primarily targets the non-standard counter characteristics of SpacemiT X60, but miniperf provides a foundation for adapting to other hardware by directly reading CPU identification registers rather than relying on standard perf event discovery mechanisms.
However, the authors also acknowledge that specific adaptations need to be developed for the specific limitations of different hardware (e.g., handling non-standard counters or permission mechanisms from different vendors), but the modular design of the toolchain makes it extensible and does not negate its practical value in a fragmented ecosystem; rather, it emphasizes its early analytical capabilities for emerging platforms.
Question 2: The compiler-driven Roofline analysis relies on LLVM IR to obtain metrics, and the results in the paper differ from Intel Advisor, with instrumentation overhead. In real applications that involve numerous external library calls, dynamic code generation, or complex memory dependencies, how significant is the deviation of core metrics such as operational intensity and throughput from actual hardware performance? Could this lead to incorrect performance bottleneck judgments?
Compiler-driven Roofline analysis does exhibit some deviation in real applications, but it remains practically valuable.
For external library calls, the paper explicitly states this as a limitation: it cannot instrument internal operations of external functions, leading to underestimation of memory/computation metrics. The overhead introduced by instrumentation may affect absolute performance measurements, but can be partially offset by executing baseline and instrumented phases.
Compiler optimizations may alter the relationship between IR-level metrics and hardware behavior, but this impact is mitigated by applying our pass in the later stages of the optimization pipeline. Despite the deviations, the paper demonstrates through comparisons with baseline values (e.g., matmul kernel measurement of 34.06 GFLOP/s close to the reported 33.0 GFLOP/s) that when PMUs are unreliable, this method can still provide sufficiently accurate bottleneck judgment criteria.
Question 3: The integrated toolchain miniperf currently focuses on single-core analysis, while RISC-V is advancing towards multi-core and heterogeneous computing (e.g., integrated accelerators). How can existing tools effectively correlate PMU data with compiler metrics when dealing with multi-core cooperation and heterogeneous component interactions? Can its design architecture support future expansion needs for parallel programming models (e.g., OpenMP)?
Regarding the expansion for multi-core and heterogeneous computing, the paper currently focuses on single-core analysis but has planned related directions.miniperf’s existing architecture separates PMU sampling from compiler analysis, providing a modular foundation for integrating multi-core data.
Future plans include integrating interfaces such as OMPT and XPTI to correlate low-level PMU/compiler metrics with high-level parallel structures to support multi-core cooperative analysis. Although not currently implemented, the design path is clear, aiming to adapt to RISC-V’s development towards multi-core and heterogeneous computing.
Article Directory
- Key Issues
- Article Directory
- 1. Introduction
- 2. Related Work
- 2.1 Performance Monitoring Unit Counters
- 2.2 Performance Modeling and Roofline Analysis
- 3. Accessing PMU Counters on RISC-V Hardware
- 3.1 Architectural Support
- 3.2 Software Support in Linux
- 3.3 Hardware Support and Current Limitations
- 4. Compiler-based Roofline Analysis Method
- 4.1 Background Knowledge of LLVM
- 4.2 Compiler Instrumentation Details
- 4.3 Runtime Analysis and Roofline Model Construction
- 4.4 Advantages and Limitations
- 5. Evaluation
- 5.1 Hotspot Analysis
- 5.2 Roofline Analysis
- 5.3 Performance Analysis on x86 Platforms
- 5.4 Performance Analysis on RISC-V Platforms
- 6. Conclusion
- References
 For group discussions, please reply in the NeuralTalk public account background: Make Friends
1. Introduction
The RISC-V instruction set architecture (ISA, a specification defining the instructions that a processor can execute) is rapidly gaining attention in the computing field, appearing in everything from deeply embedded systems to high-performance computing clusters. Its open-source nature, modularity, and customization potential offer significant advantages. However, like any emerging hardware ecosystem, achieving optimal performance across diverse RISC-V implementations poses considerable challenges for software developers and system architects.
While performance analysis is crucial for optimization, the current RISC-V ecosystem is often affected by tool fragmentation, immature hardware capabilities, and platform-specific defects, particularly in terms of performance monitoring units (PMUs). Unlike mature architectures with established analysis tools and relatively consistent PMU behavior, developers targeting RISC-V frequently encounter unreliable hardware counters, inadequate kernel support, or hardware vulnerabilities that directly render standard analysis techniques (such as event sampling) unusable. This lack of robust, reliable performance observability complicates effective bottleneck analysis and optimization efforts, potentially limiting the adoption and performance potential of RISC-V platforms.
This article addresses these challenges by proposing a practical method for extracting actionable performance insights on RISC-V systems, even under constrained or unreliable hardware conditions. We focus on practical solutions and hardware-agnostic techniques to lower the barrier for effective performance analysis. Our approach combines robust techniques that leverage available PMU capabilities with a novel, compiler-driven performance modeling method that does not directly rely on hardware counters.
Our main contributions are threefold:
- A practical PMU sampling solution: We identify and demonstrate a technique for achieving reliable event sampling of key metrics (such as cycles and instructions required for computing IPC) on specific RISC-V hardware (SpacemiT X60)—where standard mechanisms fail due to hardware limitations. This technique leverages observed interactions in the Linux
<span>perf_event</span>subsystem (the kernel subsystem in Linux for accessing performance monitoring units). - Hardware-agnostic Roofline analysis: We introduce a compiler-driven Roofline modeling method using LLVM-based instrumentation techniques. This method derives operational intensity and throughput metrics directly from the application’s intermediate representation (IR), eliminating the dependency on hardware PMU counters typically required by traditional Roofline tools, ensuring applicability across diverse or constrained RISC-V hardware.
- An integrated open-source toolchain: We provide an open-source toolkit to automate these techniques, integrating the PMU sampling solution (miniperf) and compiler-guided Roofline construction into a practical workflow for RISC-V performance analysis.
2. Related Work
As microarchitecture complexity increases, workloads diversify, and differences between hardware implementations grow, optimizing application performance on modern processors presents significant challenges. This complexity makes identifying performance bottlenecks a daunting task. Researchers and industry have developed various methods and tools to assist developers in this process.
2.1 Performance Monitoring Unit Counters
Performance monitoring units (PMUs, hardware components for monitoring various events during hardware execution) are fundamental to understanding hardware execution characteristics. Modern high-end processors typically expose hundreds of performance events, but interpreting this vast amount of data to accurately pinpoint actual bottlenecks remains challenging.
To address this issue, researchers at Intel Labs pioneered a top-down analysis approach (a hierarchical method for identifying bottlenecks in complex out-of-order processors), aimed at hierarchically identifying bottlenecks in complex out-of-order processors using minimal specific performance events [7]. This approach simplifies the analysis process, reducing the steep learning curve associated with microarchitectural details, and has been adopted in practical production tools like Intel VTune.
Researchers at SiFive have attempted to build an approximate implementation of the TMA (Top-Down Microarchitecture Analysis) method for their hardware [6]. While some of their results apply to many existing RISC-V implementations, this work primarily targets SiFive-specific hardware.
In our work, we will demonstrate some techniques we use to fill a more accessible implementation gap in the RISC-V architecture. While not fully matching TMA’s capabilities, it provides a solid foundation for future research.
2.2 Performance Modeling and Roofline Analysis
In addition to direct PMU counter analysis, performance models can provide intuitive insights into application limitations. In particular, the Roofline model (a model that determines whether an application is memory-bound or compute-bound based on arithmetic intensity and hardware performance limits) has gained attention for its ability to intuitively guide applications on whether they are memory-bound or compute-bound on specific systems [4].
Building these models typically requires benchmarking system capabilities (peak performance, memory bandwidth) and measuring application performance characteristics (throughput, operational intensity), which often heavily relies on hardware PMU counters. There is a general recognition of the need for tools that can automatically build models and analyze applications across different architectures.
The Cache-Aware Roofline Model (CARM) tool provides this automation capability. CARM includes micro-benchmarks for assessing key performance characteristics of target hardware, as well as support for extracting application arithmetic intensity and memory usage through dynamic binary instrumentation [5].
While we find this method works well on mature platforms, the initial enablement on emerging platforms requires significant tool development investment. Our work differs in proposing a hardware-agnostic Roofline method. By leveraging compiler instrumentation (particularly LLVM IR), we can derive operational intensity and performance metrics without directly relying on PMU counters, providing a viable analysis path even on hardware with limited monitoring capabilities or faults.
3. Accessing PMU Counters on RISC-V Hardware
Utilizing hardware performance monitoring units (PMUs) is crucial for in-depth performance analysis. On Linux systems, the standard interface for accessing PMUs is the perf tool and its underlying kernel subsystem
<span>perf_event</span>(the subsystem in the Linux kernel for handling performance event monitoring).
The RISC-V instruction set architecture provides a standardized performance monitoring framework through the Sscofpmf extension (Supervisor and Counter Overflow/Filtering for Performance Monitoring Facility), supporting cycle/instruction counters and hardware event sampling. However, actual access to these features requires collaboration between the Linux kernel, OpenSBI (Open-source Supervisor Binary Interface, a firmware interface for managing hierarchical interactions in RISC-V architecture), and user-space tools like perf [1].
3.1 Architectural Support
The RISC-V privilege specification defines a set of standard control and status registers (CSRs) for performance monitoring. Core registers include:
- mcycle: Machine cycle counter (counts processor clock cycles)
- minstret: Machine instruction completion counter (counts completed instructions)
- mhpmcounter[3-31]: Machine hardware performance monitoring counters. These are general-purpose counters used to track various microarchitectural events. The number of available mhpmcounter registers is defined by the specific implementation.
- mhpmevent[3-31]: Machine hardware performance monitoring event selectors. Each selector corresponds to a mhpmcounter register and selects the events that the counter should track by programming specific event codes (defined by the hardware vendor).
- mcountinhibit: A control register used to globally or individually enable or disable mcycle, minstret, and mhpmcounter registers.
While a large number of general-purpose registers are provided, the specific events that can be measured by configuring these counters through mhpmevent registers are not standardized; they are explicitly defined as platform-specific or implementation-specific. While future versions of the specification may introduce standardization for common ISA-level or microarchitectural events (such as cache misses or specific instruction types), the currently approved versions leave the definition of events other than cycles and completed instructions to hardware implementers.
3.2 Software Support in Linux
The perf user-space tool relies on the kernel’s <span>perf_event</span> subsystem. When perf starts monitoring (e.g., perf stat, perf record), it uses the <span>perf_event_open()</span> system call. This system call requests the kernel to configure specific performance events (hardware or software) for counting or sampling. The kernel’s architecture-specific PMU drivers are responsible for:
- Hardware programming: Configuring PMU control registers to count requested events.
- Counter management: Enabling, disabling, reading, and resetting hardware counters.
- Overflow handling: If sampling is requested, configuring the PMU to generate interrupts on counter overflow. The interrupt handler collects context information (program counter, registers, call stack) and records samples.
- Data transfer: Making counter values or collected samples accessible to user-space perf tools, typically achieved through efficient ring buffers mapped to the application’s address space.
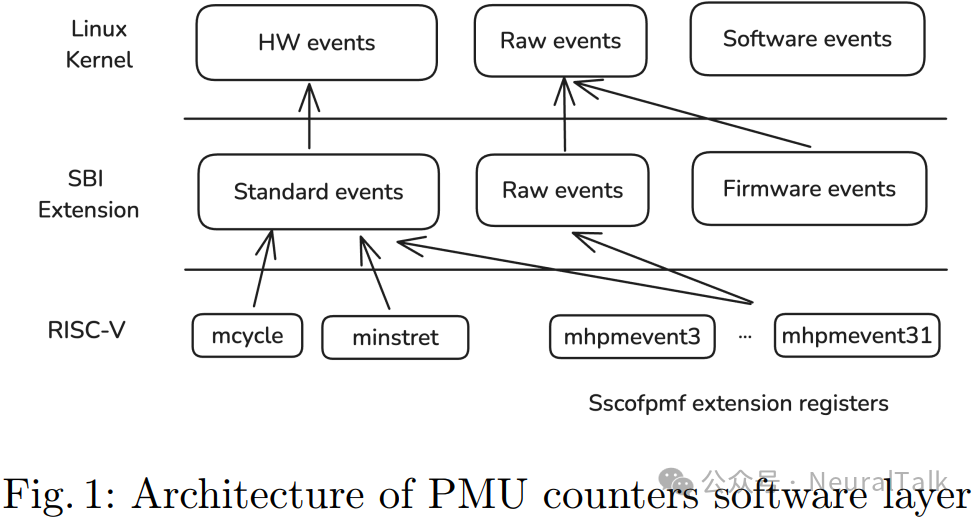
The Linux kernel running in supervisor mode typically lacks the necessary permissions to directly configure or access machine-level PMU registers, such as event configuration registers (mhpmevent#) or counter inhibit registers (mcountinhibit).
To bridge this permission gap, communication with machine-mode entities like OpenSBI is required. This approach utilizes a dedicated OpenSBI hardware performance monitoring (HPM) extension, which defines specific functions callable through the standard RISC-V environment call (ecall) mechanism. Through this SBI extension, kernel drivers can request OpenSBI to perform privileged read/write operations on machine-level PMU registers on their behalf.
Additionally, to optimize performance monitoring and reduce overhead, the kernel can leverage SBI calls to configure the mcounteren register, allowing direct reads of HPM counters from supervisor mode, avoiding repeated SBI calls for counter reads.
Figure 1 illustrates the relationship between the RISC-V architecture and the system software layer.
3.3 Hardware Support and Current Limitations
While the previous sections outline the theoretical framework for accessing PMU counters through Linux’s perf subsystem and SBI interface, the actual implementations of these mechanisms vary significantly across different RISC-V hardware. The aforementioned compliant interfaces represent an ideal case, but the actual situation of current RISC-V implementations often deviates from this ideal. As the RISC-V ecosystem continues to evolve, hardware vendors exhibit differences in the completeness and compliance of PMU functionality with the specifications. These inconsistencies directly impact the effectiveness of performance analysis tools and methods.
To comprehensively understand the performance analysis challenges within the RISC-V ecosystem, we conducted a systematic evaluation of commercially available RISC-V platforms accessible to researchers and the broader development community.
Our research focuses on three representative cores that cover different microarchitectural approaches and feature sets: SiFive U74, T-Head C910, and SpacemiT X60. These cores were selected based on their availability in consumer-grade development boards (VisionFive II, Lychee Pi 4A, Banana Pi F3, and Milk-V Jupyter, respectively), making our findings relevant to a broad potential user base.
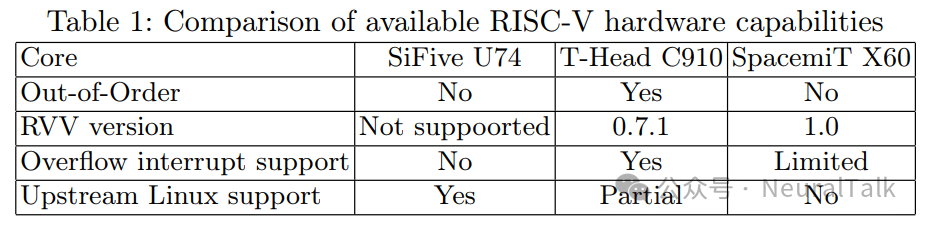
Our comparative analysis is summarized in Table 1, examining several key dimensions that affect performance analysis capabilities:
- Microarchitectural organization: We assessed whether each core implements a scalar or out-of-order execution model, which significantly impacts performance characteristics and the complexity of performance analysis.
- Vector extension support: We evaluated the presence and version of the RISC-V vector (RVV) extension, as this capability is crucial for high-performance computing workloads and introduces additional performance monitoring considerations.
- PMU counter capabilities: We specifically examined support for counter overflow interrupts, which are critical for sampling-based profiling techniques. The extent of this feature’s support varies significantly across implementations, from complete lack of support to full support.
- Upstream kernel support: We assessed the level of integration in mainstream Linux repositories, as this affects the accessibility and stability of performance monitoring tools.
Our analysis reveals significant heterogeneity among these platforms.
- T-Head C910 offers state-of-the-art microarchitecture, featuring out-of-order execution and comprehensive PMU support, but heavily relies on vendor-specific kernel modifications.
- SpacemiT X60, while supporting the latest RVV 1.0 specification, provides limited PMU sampling capabilities only through non-standard counters.
- SiFive U74, despite better performance in upstream Linux integration, lacks vector extension and overflow interrupt support, severely limiting traditional performance analysis methods.
PMU sampling on X60: Although the SpacemiT X60 core lacks hardware support for overflow interrupts on standard mcycle and minstret counters, an examination of the vendor-provided kernel source code reveals three non-standard counters that support sampling: <span>u_mode_cycle</span><span>, </span><span>m_mode_cycle</span><span>, and </span><span>s_mode_cycle</span>. These counters track cycles spent in user mode, machine mode, and supervisor mode, respectively, but unfortunately lack corresponding instruction counters.
In experiments on the SpacemiT X60 system with the <span>perf_event_open()</span> system call, we observed that configuring one of these supported sampling counters as a leader group would cause mcycles and minstret to be sampled simultaneously within that group, triggered by the leader’s overflow frequency.
To leverage this observed behavior, we developed miniperf¹, a tool that wraps the standard
<span>perf_event_open()</span>API. Unlike the standard perf tool, it automatically groups counters and selects an appropriate supported sampling leader.
This technique enables the collection of key performance metrics, such as instructions per cycle (IPC), despite documentation indicating a lack of direct sampling support for the necessary underlying counters ². Additionally, miniperf adopts a different approach to hardware compatibility; it does not use the standard perf event discovery mechanism but relies solely on CPU identification registers. This direct hardware identification allows for more robust management of supported features and platform-specific solutions.
4. Compiler-based Roofline Analysis Method
4.1 Background Knowledge of LLVM
Before delving into the specifics of our implementation, it is helpful to understand some key LLVM concepts that form the basis of our method. LLVM is a compiler infrastructure that provides a range of modular compiler and toolchain technologies. Two concepts particularly relevant to our work are:
-
LLVM Intermediate Representation (IR) is a platform-independent code representation that sits between source code and machine code in the compilation process [3]. LLVM IR serves as a universal format throughout the compilation process, allowing optimizations to be applied independently of the source language or target architecture. This IR adopts a RISC-like instruction set but includes higher-level information such as types, explicit control flow graphs, and memory operations. For performance analysis, LLVM IR provides an ideal observation point because it retains sufficient high-level structure to identify loops and functions, explicitly exposes memory operations and arithmetic instructions, and is independent of target architecture-specific instruction sets.
-
LLVM Pass is a transformation or analysis applied to code as it passes through the compilation process [3]. Passes can analyze or modify code. The pass infrastructure allows for modular compiler extensions without modifying the compiler core. Common passes include loop analysis, dead code elimination, and instruction combining. Our method implements a custom instrumentation pass that leverages existing analysis passes to identify and instrument performance-critical regions.
4.2 Compiler Instrumentation Details
Our method implements a Clang compiler plugin that adds instrumentation (inserting additional code into the code to collect information) to gather the metrics required for Roofline analysis without relying on PMU counters.
The instrumentation process includes several key steps:
- Loop Nest Identification: Our pass first traverses each function in the program, utilizing LLVM’s loop analysis infrastructure to identify loop nests. Loop nests are particularly important for performance analysis as they often contain the computational core that dominates execution time.
- Region Extraction: For each identified loop nest, we use LLVM’s RegionInfoAnalysis to ensure that the region has a single entry and exit point (SESE). This property is crucial for clean extraction and instrumentation. The CodeExtractor tool then extracts this region as a separate function.
- Function Cloning: The extracted function is cloned to create two versions: the original (unmodified) function and the instrumented version that collects performance metrics.
- Call Point Modification: The original call points are modified to include logic that selects between the two function versions based on environment variables. This allows runtime control over which regions are instrumented. The call points are also wrapped with special notification functions that mark the start and end of the monitored regions:
LoopHandle *LH = mperf_roofline_internal_notify_loop_begin(LI); LoopInfo LI{line=42, filename="foo.c", func_name="bar"}; if (mperf_roofline_internal_is_instrumented_profiling()) bar_loop0_instrumented(args..., LH); else bar_loop0_outlined(args...); mperf_roofline_internal_notify_loop_end(LH); - Metric Collection: In the instrumented version of the function, we insert code at the basic block level to count the number of bytes loaded/stored to memory, integer arithmetic operations, and floating-point arithmetic operations.
These statistics accumulate during execution and are reported to our miniperf tool via callback functions at program termination.
4.3 Runtime Analysis and Roofline Model Construction
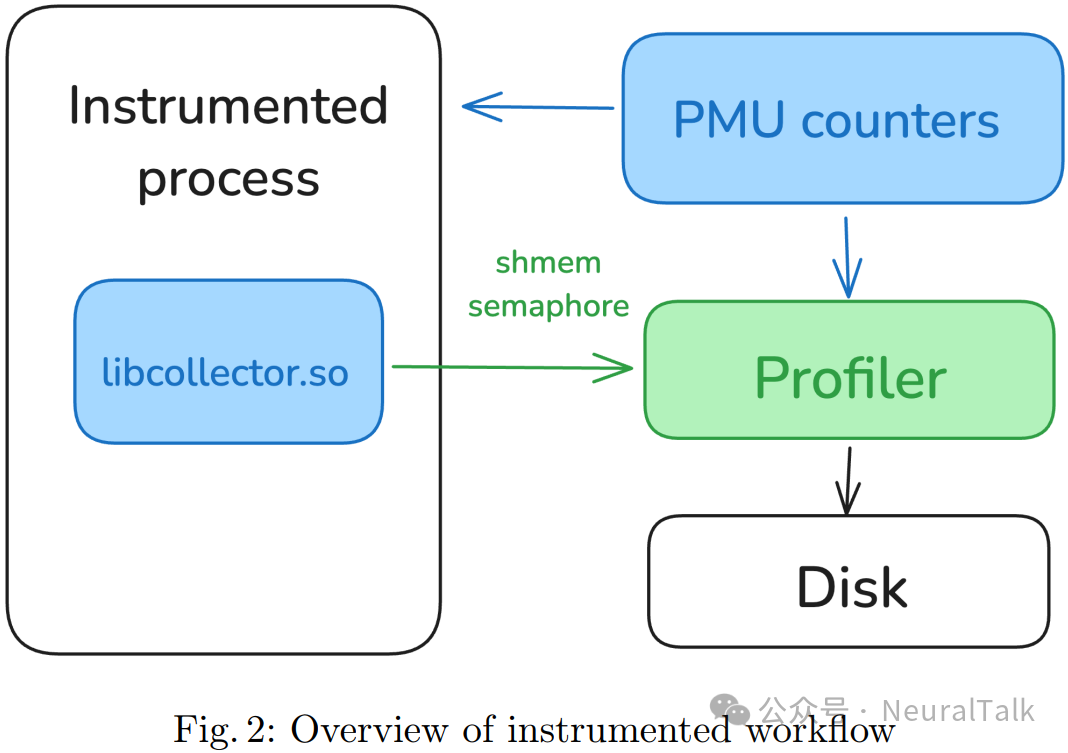
The actual Roofline model construction is accomplished through a two-phase execution method (as shown in Figure 2):
- Baseline Execution: The program runs with instrumentation disabled to establish baseline performance.
- Instrumented Execution: The program runs again with instrumentation enabled for the target regions.
Our tool coordinates these executions and correlates the results, calculating:
- The execution time difference between instrumented and non-instrumented runs
- Memory traffic derived from load/store counts (bytes/second)
- Computational throughput (operations/second)
- Arithmetic intensity (operations/byte)
These metrics can then be compared against hardware capabilities (peak computational performance and memory bandwidth) to construct the Roofline model. Since our method derives these metrics from LLVM IR rather than hardware events, this analysis remains consistent across different RISC-V implementations.
4.4 Advantages and Limitations
This compiler-based approach offers several advantages:
- Hardware Independence: By operating at the IR level, our method can work across different hardware implementations, regardless of PMU support or specific extensions. Adding a new platform only requires writing a good LLVM backend for the new target, which is part of the regular compiler development cycle.
- Fine-grained Analysis: We can analyze specific code regions rather than the entire program.
- Metric Consistency: Metrics are derived from program behavior rather than hardware-specific events, providing a consistent view across platforms.
However, there are also some notable limitations:
- External Function Calls: Loops containing calls to external functions (such as library calls) cannot be fully instrumented, as we cannot track operations within these functions. This particularly affects code that relies on external libraries.
- Runtime Overhead: Instrumentation introduces significant overhead, making absolute performance measurements less accurate. We mitigate this issue through the two-phase execution method.
- Compiler Optimizations: Post-instrumentation optimizations may alter the relationship between IR-level metrics and actual hardware behavior. We address this by applying our pass in the later stages of the optimization process.
- Deterministic Execution: This method assumes that the program exhibits deterministic behavior across multiple runs, which may not hold for all applications.
Despite these limitations, our method can provide valuable insights into application performance characteristics on RISC-V platforms, especially in cases where traditional PMU-based analysis is unavailable or unreliable. The hardware independence of this method makes it particularly valuable in the rapidly evolving RISC-V ecosystem.
5. Evaluation
5.1 Hotspot Analysis
Identifying CPU hotspots—the code segments where the processor spends most of its time—is a critical step in performance optimization. While various analysis techniques exist, the flame graph invented by Brendan Gregg provides an intuitive and powerful visualization for understanding CPU usage patterns.
Flame Graphs
Flame graphs visualize the analyzed software by creating a profile over a period through stack tracing samples. The x-axis of the flame graph represents the number of stack profiles, with stack frames sorted alphabetically to maximize merging, rather than representing the passage of time. The y-axis represents stack depth, increasing from bottom to top. Each rectangle in the graph corresponds to a function (a stack frame). The width of the rectangle is directly proportional to the frequency of that function’s occurrence in the sampled stack—wider frames indicate that the function ran longer on the CPU or is part of the call stack running on the CPU. The top edge of the frame indicates the function currently executing on the CPU, while the frames below represent its parent callers (ancestors). This hierarchical visualization allows developers to quickly locate the most time-consuming code paths [2].
The primary value of flame graphs lies in their ability to provide a quick, comprehensive, and in-depth view of CPU usage. They condense what could be an overwhelming amount of analysis data into a single readable image, making it easier to identify the call paths that consume the most CPU resources. This is invaluable for directing optimization efforts toward the most impactful code areas.
miniperf
Our tool miniperf assists in generating flame graphs using CPU cycles or retired instructions as sampling metrics.
While cycle-based flame graphs directly represent CPU time, retired instruction-based flame graphs provide a valuable proxy metric, particularly useful across different platforms for identifying code segments that are under-optimized and warrant attention from programmers or compiler developers.
For example, consider a function expected to be vectorized; if the retired instruction flame graph shows that the frame for that function is significantly wider (e.g., the scalar instructions processed are 8 times that of the equivalent vectorized version), it strongly indicates poor vectorization or a complete lack of vectorization.
Flame graphs make such comparative analysis visually intuitive—often as simple as comparing two images. Importantly, miniperf can sample cycles and retired instructions even on platforms with limited or non-standard hardware support (as demonstrated by the solutions on SpacemiT X60), enabling developers to perform these critical optimizations and analyses before the release of mature hardware platforms, accelerating software readiness.
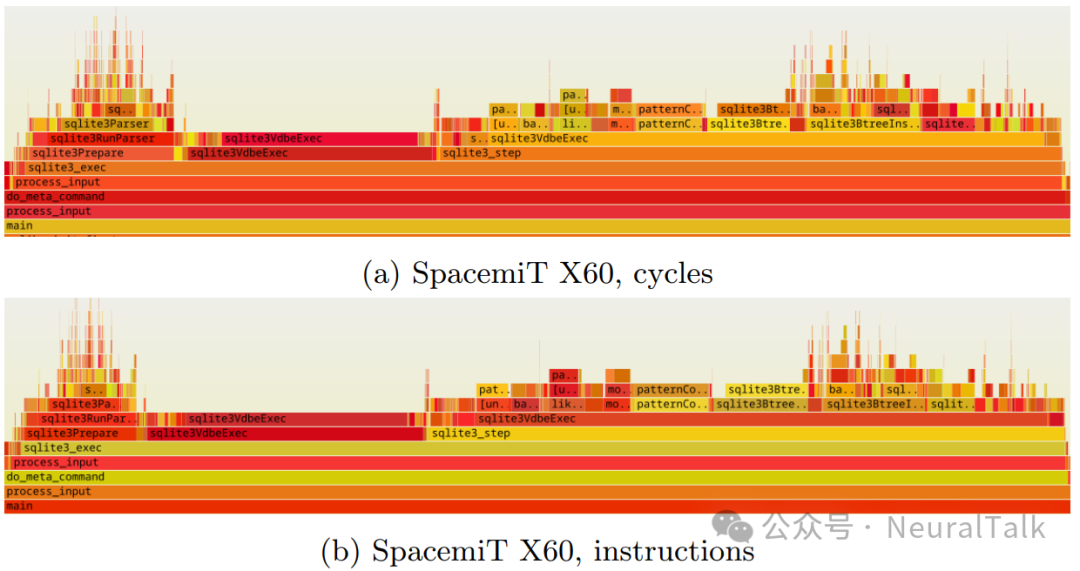
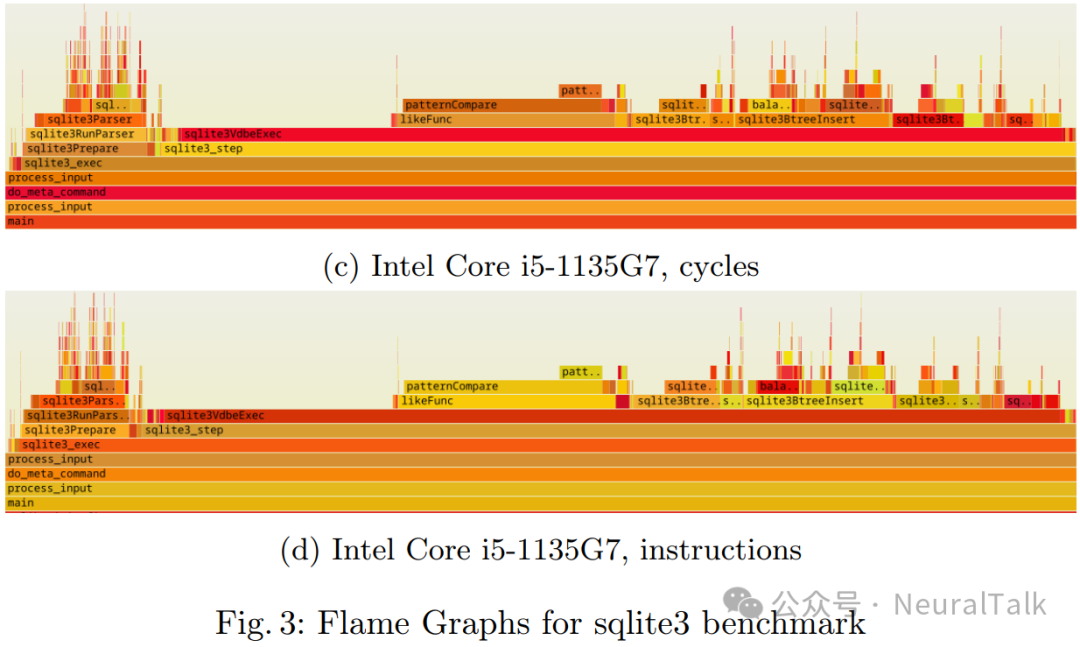
Our tool clearly demonstrates the current performance status through the results of the sqlite3 benchmark (taken from the LLVM test suite), as shown in the flame graph (Figure 3) and hotspot summary (Table 2).
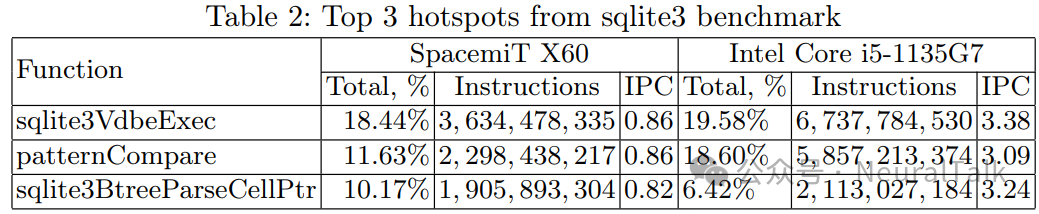
While the x86 platform may execute more instructions for a given task, its microarchitectural efficiency (IPC reaching 3.38) significantly surpasses that of the SpacemiT X60 core (IPC of 0.86). This highlights a considerable performance gap and optimization opportunity on RISC-V systems.
5.2 Roofline Analysis
In addition to directly identifying hotspots, understanding the interaction between the processor’s computational capabilities and the performance of its memory subsystem is crucial for comprehensive optimization.
- The Roofline model provides an insightful visualization framework, offering a straightforward method to characterize application performance and identify primary bottlenecks.
- The main advantage of the Roofline model is its ability to intuitively describe whether an application is limited by memory bandwidth or by the processor’s peak computational throughput, effectively guiding optimization efforts. It correlates achieved performance (e.g., GFLOP/s) with arithmetic intensity (the number of operations performed per byte of memory accessed), providing a clear upper limit defined by hardware capabilities.
To demonstrate the practical application of our compiler-based Roofline analysis, we will conduct a detailed examination using the following code kernel:
for (int ii = 0; ii < n; ii += TILE_SIZE) {
  for (int jj = 0; jj < n; jj += TILE_SIZE)
    for (int kk = 0; kk < n; kk += TILE_SIZE)
      for (int i = ii; i < ii + TILE_SIZE && i < n; i++)
        for (int j = jj; j < jj + TILE_SIZE && j < n; j++) {
          float sum = C[i * n + j];
          for (int k = kk; k < kk + TILE_SIZE && k < n; k++)
            C[i * n + j] = sum;
            sum += A[i * n + k] * B[k * n + j];
        }
}
For our Roofline model experimental evaluation, all benchmarks were compiled using Clang 19 with the -O3 optimization flag.
5.3 Performance Analysis on x86 Platforms
For the x86 platform, we specifically enabled AVX2 instructions with the -mavx2 flag, while for RISC-V, we used the <span>-march=rv64gcv</span> target RV64GCV configuration.
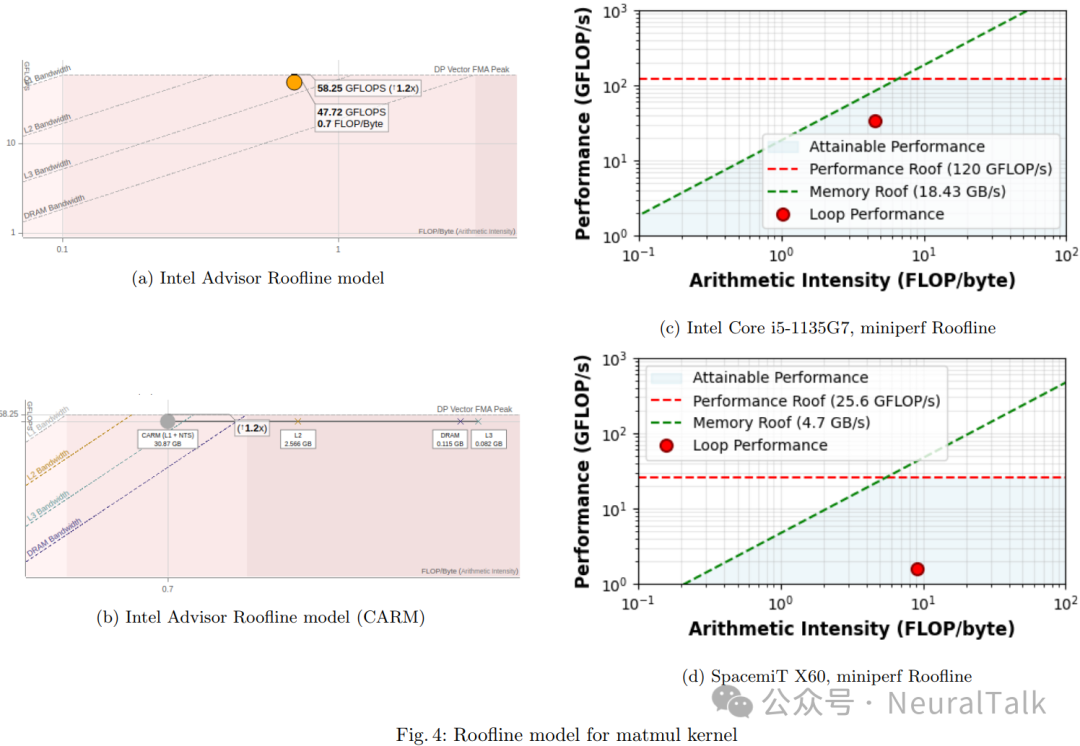
Figure 4 presents a comparative Roofline analysis of a representative core on the x86 platform, contrasting the results obtained from our miniperf tool with those from Intel Advisor.
Our compiler-based instrumentation method implemented in miniperf reports the performance of this core as 34.06 GFLOP/s. This value is very close to the benchmark’s self-reported performance of 33.0 GFLOP/s, indicating good consistency with the application’s own measurements. In contrast, Intel Advisor reports a higher performance of 47.72 GFLOP/s.
This discrepancy primarily arises from the different methodologies:
- miniperf directly instruments the generated code at the LLVM IR level to count operations,
- while Intel Advisor typically relies on dynamic analysis of hardware performance counters.
The slight difference between miniperf’s measurements and the benchmark’s self-reported values can be attributed to the inherent overhead of our low-level loop instrumentation; any user code measurements surrounding the instrumented loop will inevitably include this instrumentation overhead, although, as observed, this impact is not significant.
For the arithmetic intensity calculations presented, we currently focus on operations exposed to the L1 cache. A more comprehensive analysis of the memory hierarchy requires in-depth, platform-specific knowledge, which poses challenges in the context of the diverse and evolving RISC-V hardware landscape. It is also worth noting that for the x86 Roofline graph (Figure 4), the performance upper limit (roof) is directly taken from Intel Advisor, while our miniperf-derived data points are mapped to this established model.
5.4 Performance Analysis on RISC-V Platforms
Turning to the SpacemiT X60 RISC-V platform, due to the current difficulty in obtaining precise, detailed hardware specifications at all memory levels, we construct its Roofline model by combining established benchmarks and theoretical peaks.
For the memory bandwidth upper limit, we used the memset benchmark results from Olaf Bernstein [3], which indicate that the core’s peak performance is approximately 3.16 bytes/cycle. At a nominal frequency of 1.6 GHz, this translates to about 4.7 GB/s of theoretical DRAM memory bandwidth (3.16 bytes/cycle × 1.6 GHz).
For the computational upper limit, we consider the theoretically achievable peak: assuming two instructions retired per cycle (a common design goal for scalar cores), along with 8-element single-precision floating-point vector capabilities (based on RVV 1.0 with a 256-bit VLEN), this yields a peak of (assuming one vector FMA or equivalent instruction per cycle).
Under these theoretical limits, our core achieves 1.58 GFLOP/s performance. This result is significantly below the theoretical computational and memory bandwidth capabilities, indicating considerable room for improvement. This highlights opportunities for compiler developers to enhance code generation and vectorization for this specific core, performance engineers to further tune applications, and hardware vendors to improve microarchitectural efficiency or provide clearer performance characterizations.
Even when detailed hardware counter analysis faces challenges, miniperf can provide these hardware-agnostic operational metrics, offering unique insights into such performance characteristics and optimization potential on emerging platforms.
6. Conclusion
Our evaluation successfully demonstrates the practical application of the proposed method, showcasing effective PMU analysis on limited RISC-V hardware, as well as the practicality of our compiler-based, hardware-agnostic Roofline analysis.
By utilizing flame graphs for hotspot analysis and comparative Roofline modeling, our miniperf tool effectively highlights key performance characteristics and numerous optimization opportunities.
Ultimately, these evaluations confirm that even in the absence of mature hardware support, our method can provide developers with valuable, actionable insights in the complex and evolving RISC-V performance landscape.
References
- Domingos, J.M., Tomas, P., Sousa, L.: Supporting RISC-V performance counters through performance analysis tools for linux (perf). arXiv preprint arXiv:2112.11767 (2021)
- Gregg, B.: Flame Graphs. https://www.brendangregg.com/flamegraphs.html, accessed: 2025-04-16
- Lattner, C., Adve, V.: LLVM: A compilation framework for lifelong program analysis & transformation. In: International symposium on code generation and optimization, 2004. CGO 2004. pp. 75–86. IEEE (2004)
- Lo, Y.J., Williams, S., Van Straalen, B., Ligocki, T.J., Cordery, M.J., Wright, N.J., Hall, M.W., Oliker, L.: Roofline model toolkit: A practical tool for architectural and program analysis. In: High Performance Computing Systems. Performance Modeling, Benchmarking, and Simulation: 5th International Workshop, PMBS 2014, New Orleans, LA, USA, November 16, 2014. Revised Selected Papers 5. pp. 129–148. Springer (2015)
- Morgado, J., Sousa, L., Ilic, A.: CARM Tool: Cache-Aware Roofline Model Automatic Benchmarking and Application Analysis. In: 2024 IEEE International Symposium on Workload Characterization (IISWC). pp. 68–81. IEEE (2024)
- Mou, C.Y., Hsiao, C.C., Chou, J.: Top-Down Microarchitecture Analysis Approximation Based on Performance Counter Architecture for SiFive RISC-V Processors. In: SC24-W: Workshops of the International Conference for High Performance Computing, Networking, Storage and Analysis. pp. 1666–1675. IEEE (2024)
- Yasin, A.: A top-down method for performance analysis and counters architecture. In: 2014 IEEE International Symposium on Performance Analysis of Systems and Software (ISPASS). pp. 35–44. IEEE (2014)
For group discussions, please reply in the NeuralTalk public account background: Make Friends