By 2021, the number of Internet of Things (IoT) and Internet of Medical Things (IoMT) devices is expected to reach 25 billion, generating and collecting personal GPS data. This article demonstrates GPS data use cases using the open-source tool Kepler. In some cases, GPS data can not only track a person’s actual location but also determine whether the person is in a car or airplane and how long they stay.
GPS can indicate location, altitude, speed, time, and direction. IoMT devices can monitor users’ health, such as temperature, heart rate, exercise, and other medical information. In emergencies, IoMT devices use GPS data to alert emergency responders and relay critical location data. Similarly, law enforcement and investigators can use interrelated data to delve into criminal behavior and personal safety issues.
GPS coordinate values have also attracted the attention of attackers. Security researchers have found malware like Exodus collecting GPS data from infected mobile devices. The privacy and data security issues of GPS data cannot be ignored as the applications of IoT continue to accelerate, with more devices generating GPS data.
Before IoT, there were mobile phones
The GPS project was initiated in the United States in 1973. The goal was to track the geographic location data and time information of objects on Earth using four or more satellites.
COVID-19 has led many countries to use or discuss using mobile phone GPS and other location data to help track patients and potential new patients, etc. First, what is in the data? Basic GPS information includes latitude, longitude, and timestamps. GPS can also provide altitude measurements and horizontal and vertical accuracy measurements. GPS data can also measure the speed at a single point in time by measuring the Doppler shift of the device relative to GPS satellites.
Data Preparation
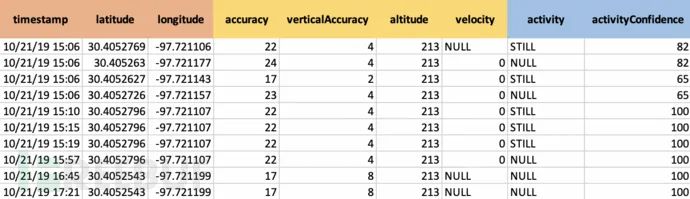
Typically, analysts convert their data into tabular format, enabling them to upload and use their data in most tools. Example tables will have the following contents: the red fields are the ‘core’ fields of GPS data. Accuracy, altitude, and speed are usually included as well. The blue fields come from Google’s activity classification engine, which uses multiple sensors in the device to predict user behavior and assign a confidence interval to that prediction.
Individual Device Data Analysis
The following figure shows the approximate time and speed of a person arriving at and leaving a location:
Red indicates lower speed, while green indicates higher speed (in meters/second). All times are UTC, and the person spent about 10 hours on the pure red dot in the middle of the animation. Low opacity means that individual points will be bright, but points that take longer to move will be darker. The route they took to leave the location was different from the route they took to arrive, and they left at a higher speed. There are gaps between the GPS points based on various factors such as the device, application, weather, surrounding buildings, etc.
Zooming in on the individual’s stopping location, we can see more details. In the animation below, only the outlines of the points are shown to make it easier to determine when new data points appear on the graph. The color of the points corresponds to speed, red for slow and green for fast. In the office building, all points are red. The radius of these points matches the horizontal accuracy of the GPS points (in meters), inferring that the person spent a lot of time at the north end of the building.
Multiple Device Data Analysis
Can we determine if two mobile devices are at the same location simultaneously? We generated two sets of data for two separate mobile devices, named Sally and Bob.
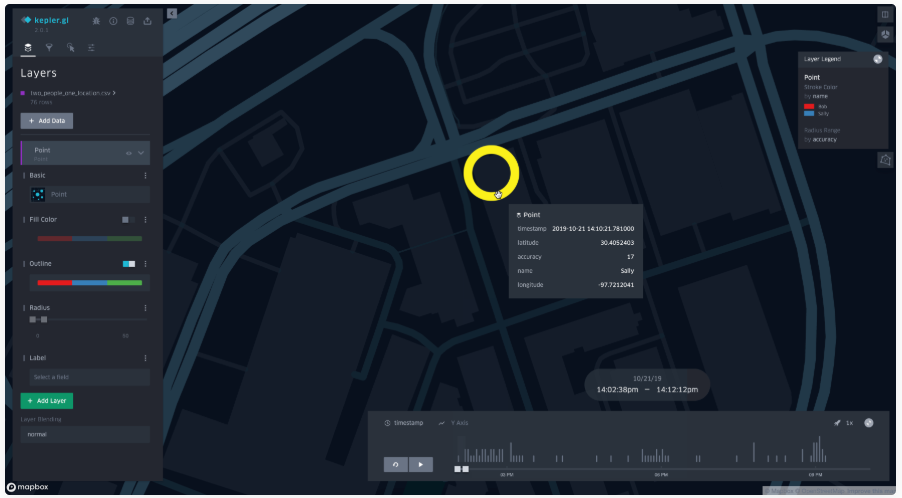
Sally’s points start displaying in blue, and at 15:06, Bob’s (in red) point appears at that location and continues to show until 21:00. From 21:02 to 21:06, Bob moves away from that location while Sally remains. This leads us to conclude that Sally and Bob were roughly at the same location from 15:06 to 21:00.
Speed and Altitude
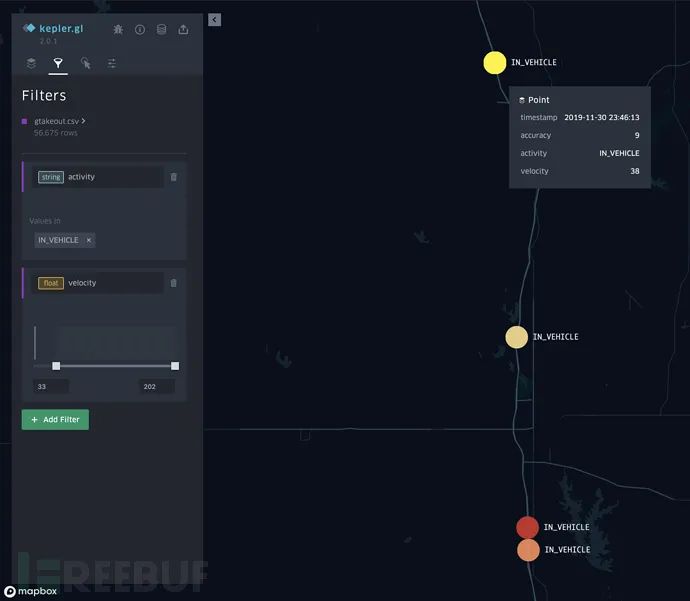
If you want to filter data points on mobile devices in high-speed vehicles, you can use Google’s activity classification and speed as filters. Combining both can identify speeding cars. The following figure shows four points at speeds of up to 85 mph (the graph is in m/s):
The following figure shows points flying at 35,000 feet at 450 mph:
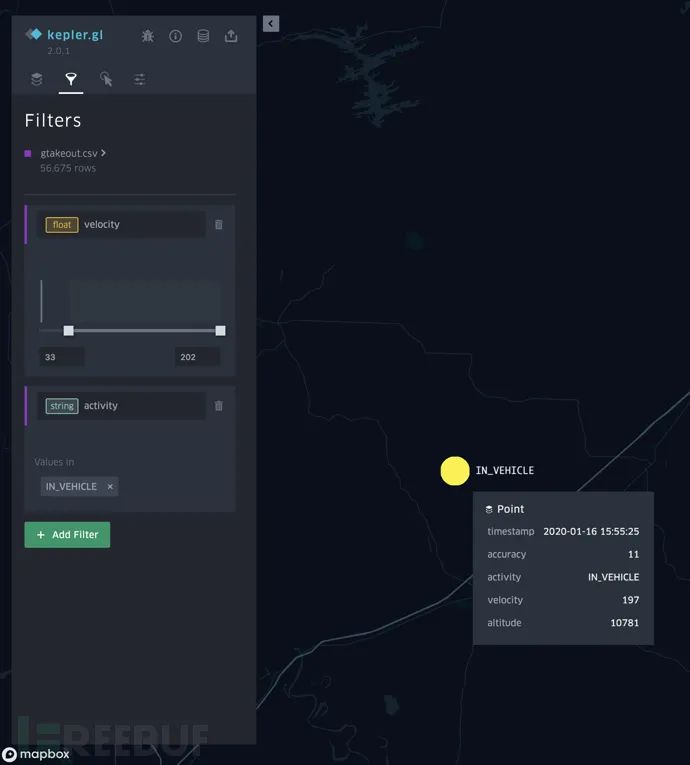
If you remove the ‘IN_VEHICLE’ filter, you can see mobile devices are in flight:
Conclusion
While GPS data can facilitate emergency response and criminal investigations, GPS signals are also easily spoofed.
Location spoofing software can deceive a mobile device’s built-in GPS by sending false coordinates, allowing device owners to travel virtually. As the number of IoT devices continues to grow, current open-source tools and investigative techniques will form a solid foundation.
For individual users wishing to protect their GPS data, it is recommended to limit location tracking on mobile applications, download applications only from trusted sources (such as the App Store and Google Play), and prevent users from installing spyware that can secretly collect location data.
Reference Links
https://unit42.paloaltonetworks.com/gps-tracking-and-future-application-for-iot/

Recommended