

In the workplace, what is the most direct and efficient way to report work to leaders? Of course, it’s through a graphical interface! A graphical interface can better express the logical thinking of a program design, making it clear at a glance. Today, I would like to share a professional and comprehensive embedded debugging toolset: Micro-Lab.
1. What is Micro-Lab?
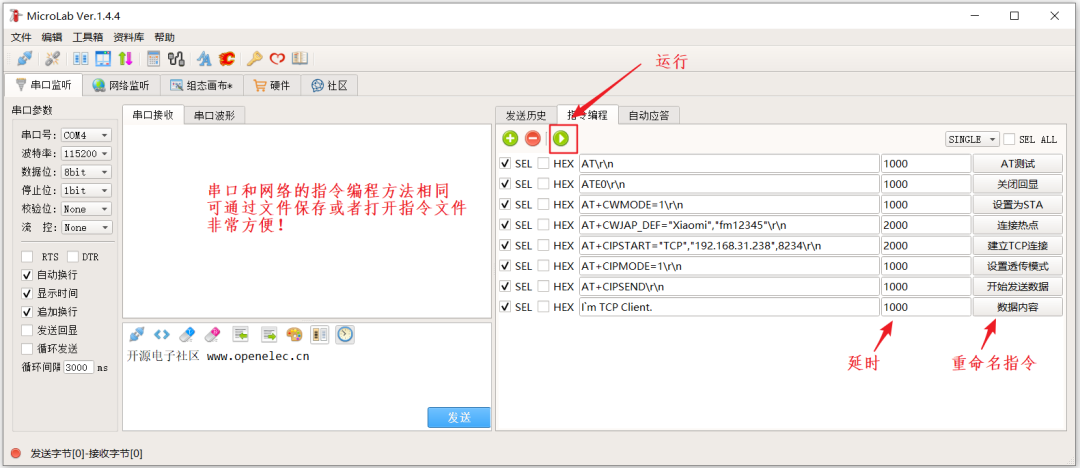
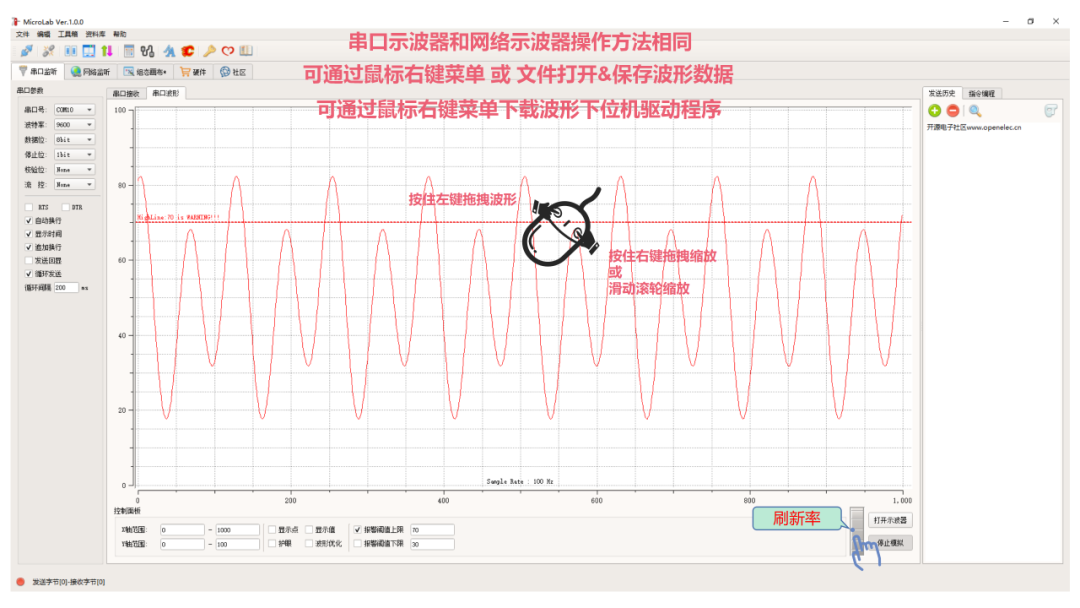
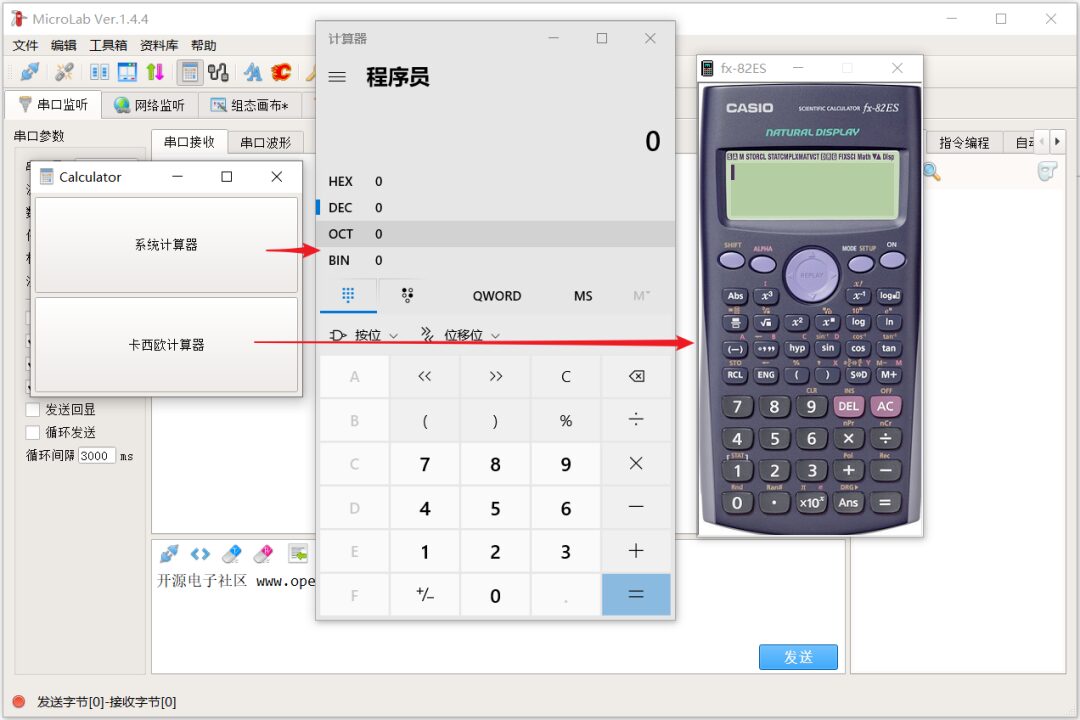
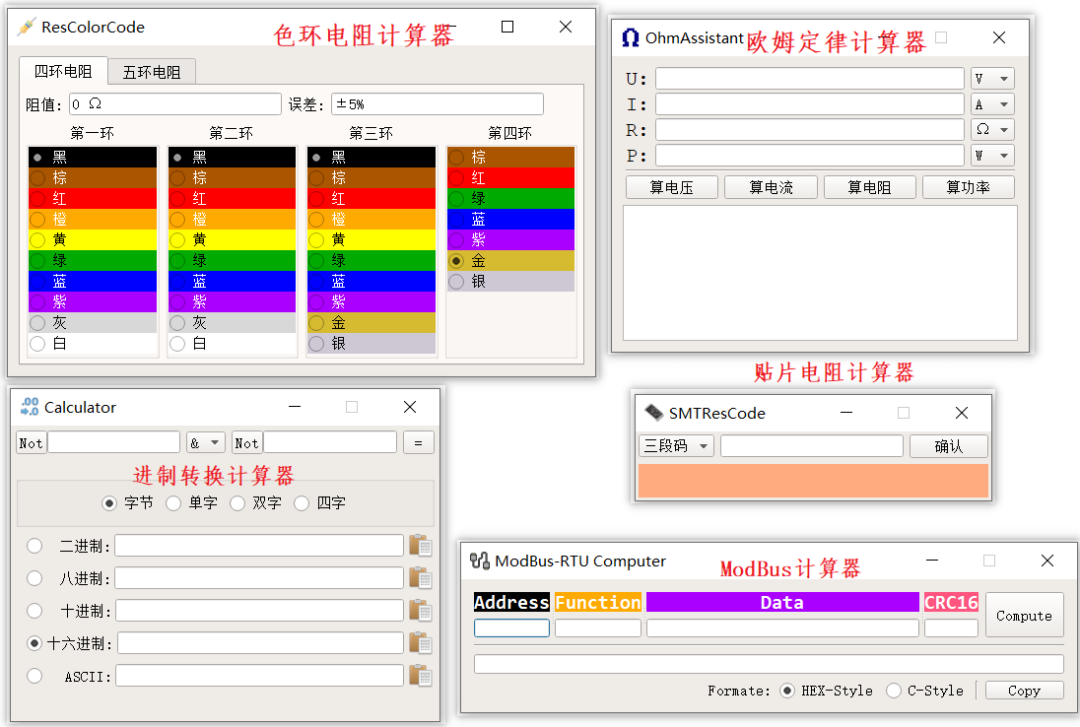
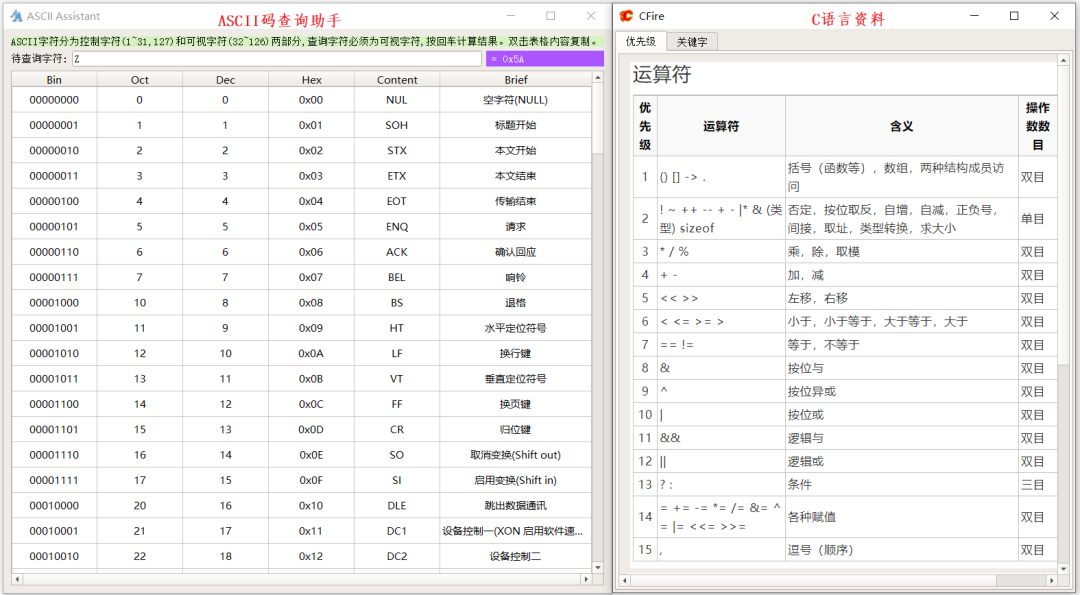
Micro-Lab can be regarded as the best embedded debugging tool to date. All the pain points encountered during debugging are addressed here, and many new features have been introduced, such as a brand new serial/network debugging service and associated modules, permanent storage of sending history with support for aliases, dynamic instruction programming for serial/network, virtual oscilloscope for serial/network, super calculator, ModBus RTU calculator, DTU, serial-network splitter, application shadowing, numerous development auxiliary tools and materials, and the revolutionary event-driven upper computer programming tool—VanGogh configuration canvas, among dozens of other functions.
Users do not need to master any PC programming language; they can easily get started by simply dragging and dropping components with the mouse. From requirement to prototype takes only a few minutes! Whether in terms of user experience or functional practicality, it is absolutely top-notch. Micro-Lab can be said to have redefined embedded debugging tools and has become a benchmark in the industry.
Let’s take a look at what it looks like in detail!
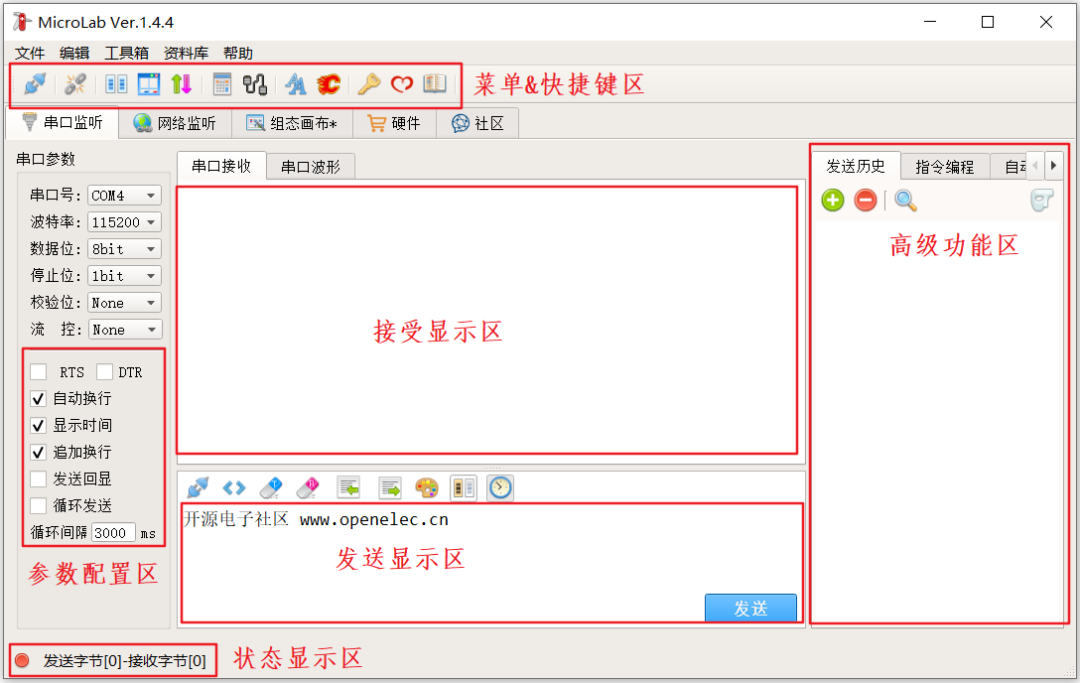
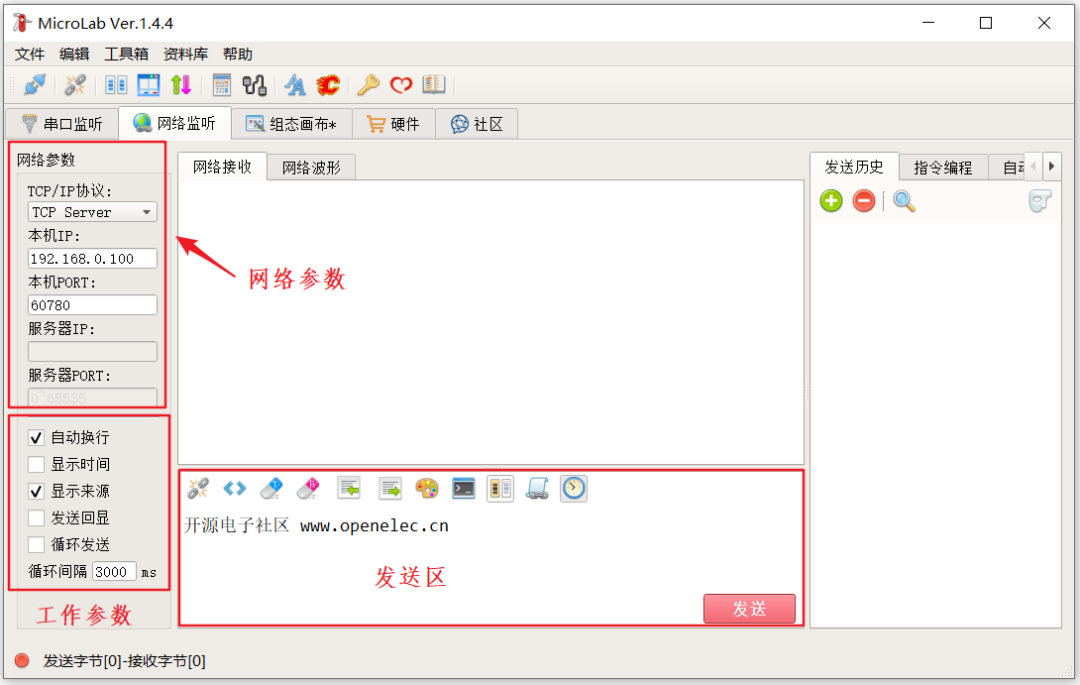
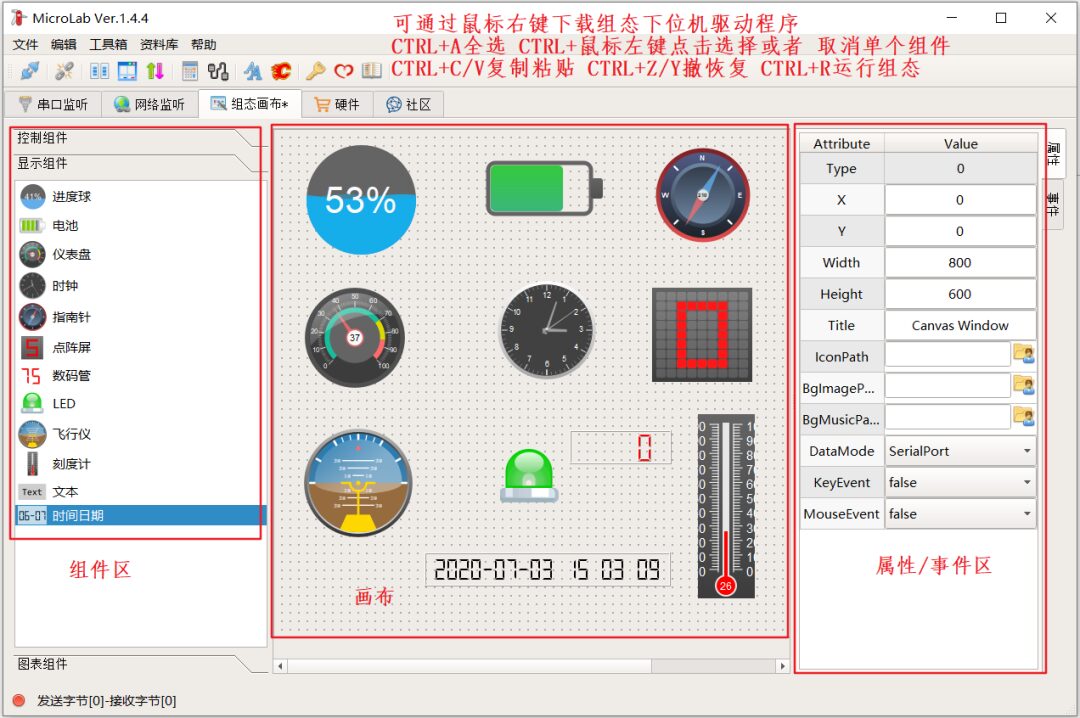
2. Micro-Lab Graphical Interface Design and Usage
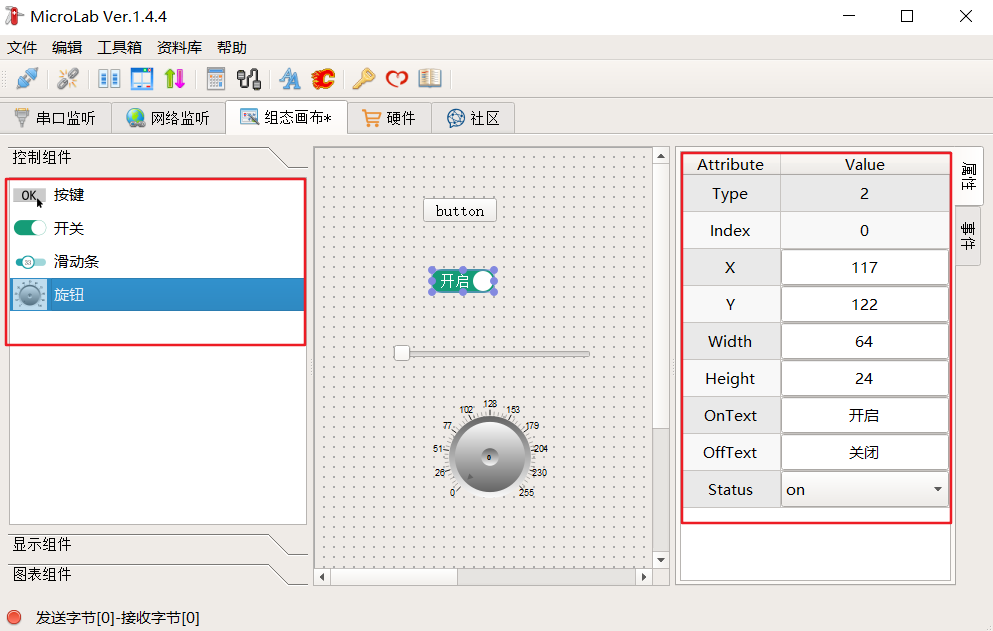
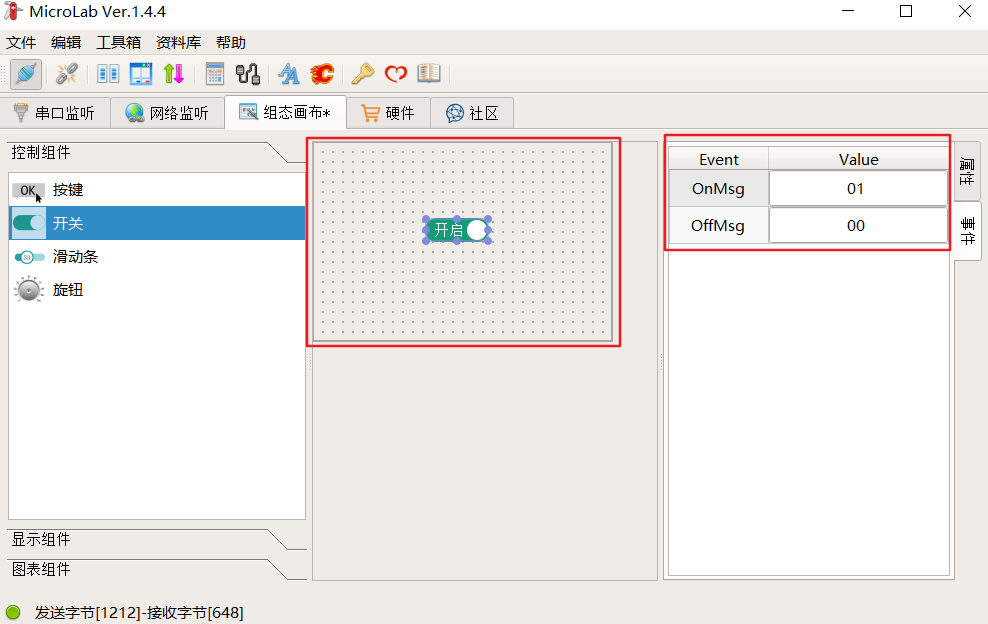
Switch to the configuration canvas page, then manually drag the relevant controls from the left to the control placement area in the middle. When one of the controls is selected, its properties can be changed on the right, similar to operating a serial screen. Even if you have never used it before, you can quickly get started without reading the documentation.
In this way, when we are debugging the board, we can operate the interface very conveniently and visually, sending the corresponding commands. Isn’t that very convenient? Doesn’t it feel a bit like GUI?
3. Porting the SDK to STM32
Here I am using the core board STM32F103C8T6.
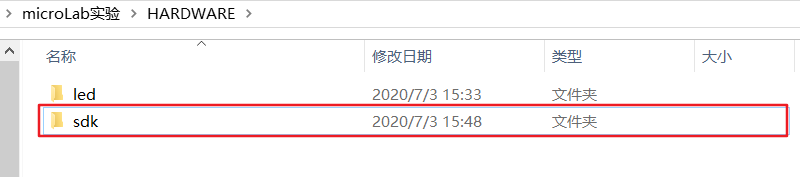
1. Copy the SDK package to our project.
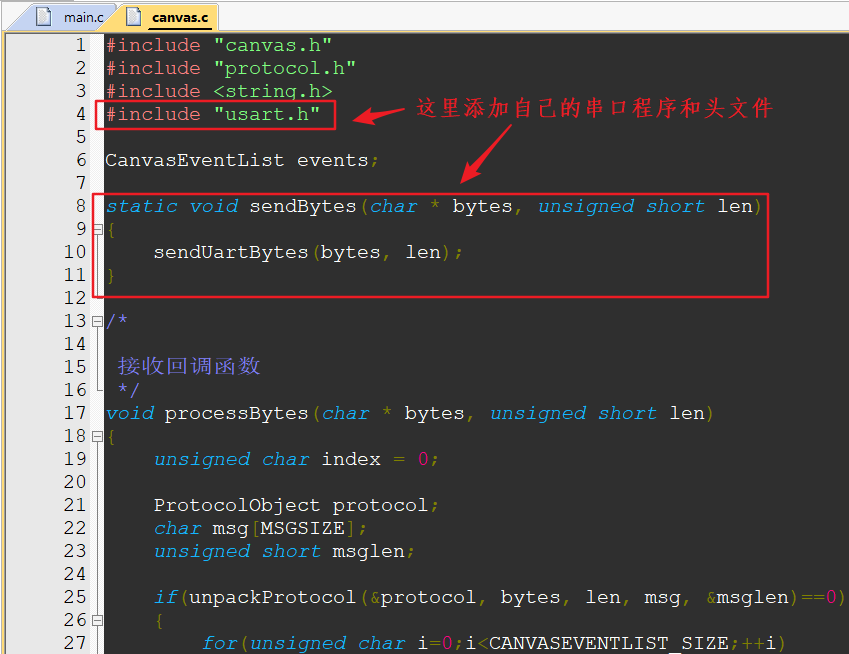
2. Add the SDK source files in MDK and include the SDK header files in MDK.
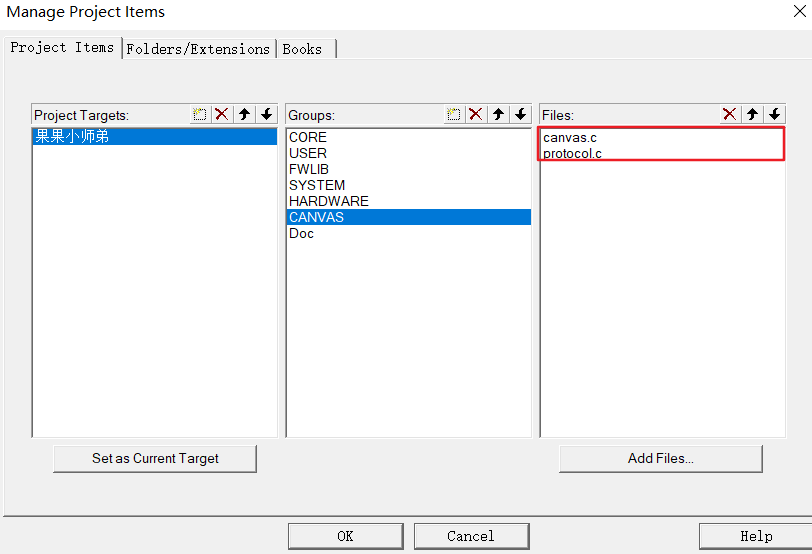
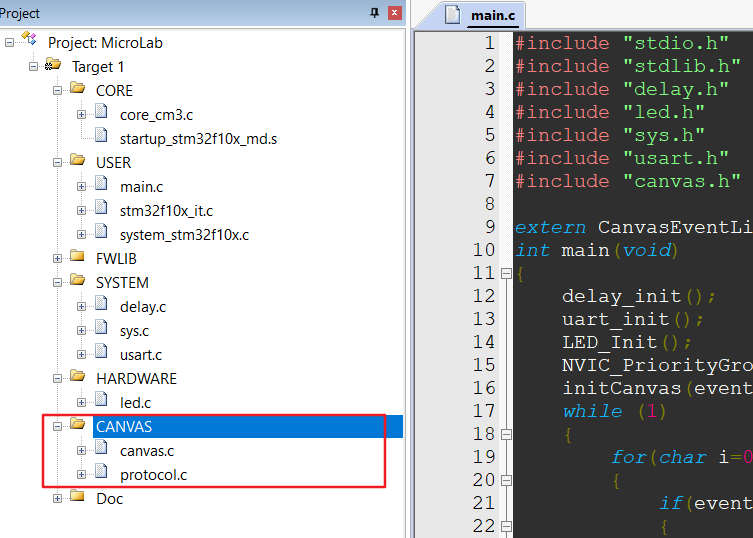
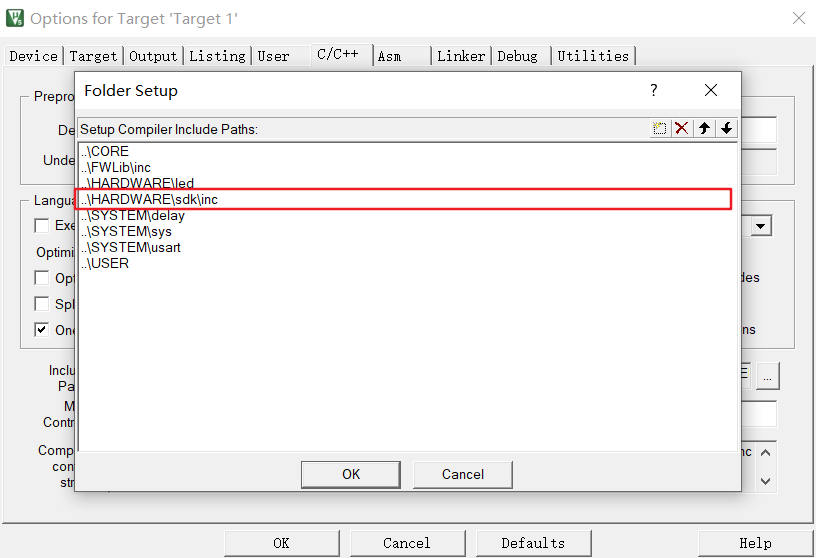
3. Modify the project.
4. Use Micro-Lab.
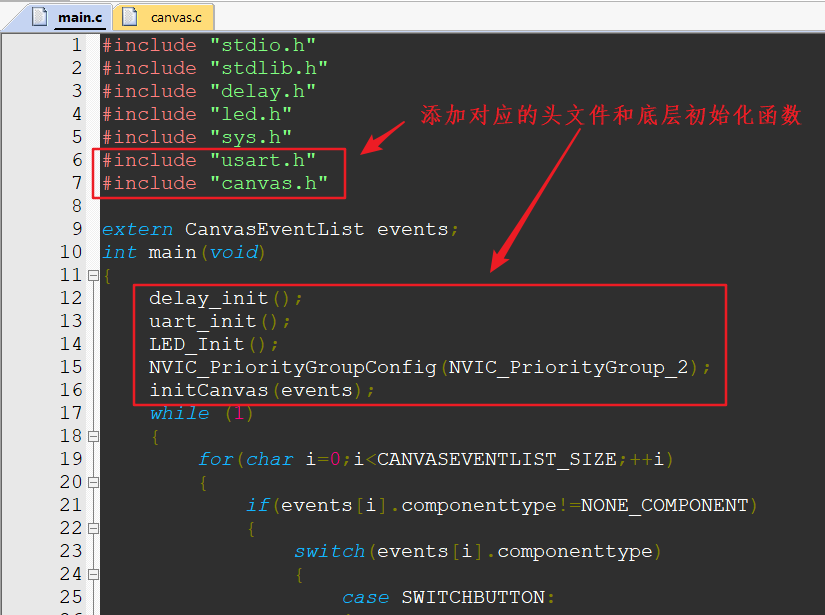
5. Here we use Micro-Lab’s dynamic canvas to control an LED light on the minimum system board.
int main(void)
{
 delay_init();
 uart_init();
 LED_Init();
 NVIC_PriorityGroupConfig(NVIC_PriorityGroup_2);
 initCanvas(events);
 while (1)
 {
 for(char i=0;i<CANVASEVENTLIST_SIZE;++i)
 {
 if(events[i].componenttype!=NONE_COMPONENT)
 {
 switch(events[i].componenttype)
 {
 case SWITCHBUTTON:
 {
 if(events[i].componentnumer==0)
 {
 if(events[i].componentmsgtype==SWITCH_ON)
 {
 LED=0;
 printf("SWITCHBUTTON  ON, ");
 printf("MSG : ");
 for(unsigned short j=0;j<events[i].msglen;++j)
 {
 printf("%2X ", events[i].msg[j]);
 }
 printf("\r\n");
 }else if(events[i].componentmsgtype==SWITCH_OFF)
 {
 LED=1;
 printf("SWITCHBUTTON  OFF, ");
 printf("MSG : ");
 for(unsigned short j=0;j<events[i].msglen;++j)
 {
 printf("%2X ", events[i].msg[j]);
 }
 printf("\r\n");
 }else
 {
 }
 }
 }
 break;
 default: break;
 }
 events[i].componenttype = NONE_COMPONENT;
 events[i].componentnumer = 0;
 events[i].componentmsgtype = NONE_MSG;
 events[i].msglen = 0;
 }else
 {
 }
 }
 }
}
Here, I used the example from Zhen Dian Yuan Zi. Considering that most of my followers are students, they may be more familiar with the programs from Zhen Dian Yuan Zi and Ye Huo, making it easier for them to port or understand. Haha, isn’t the editor very thoughtful?
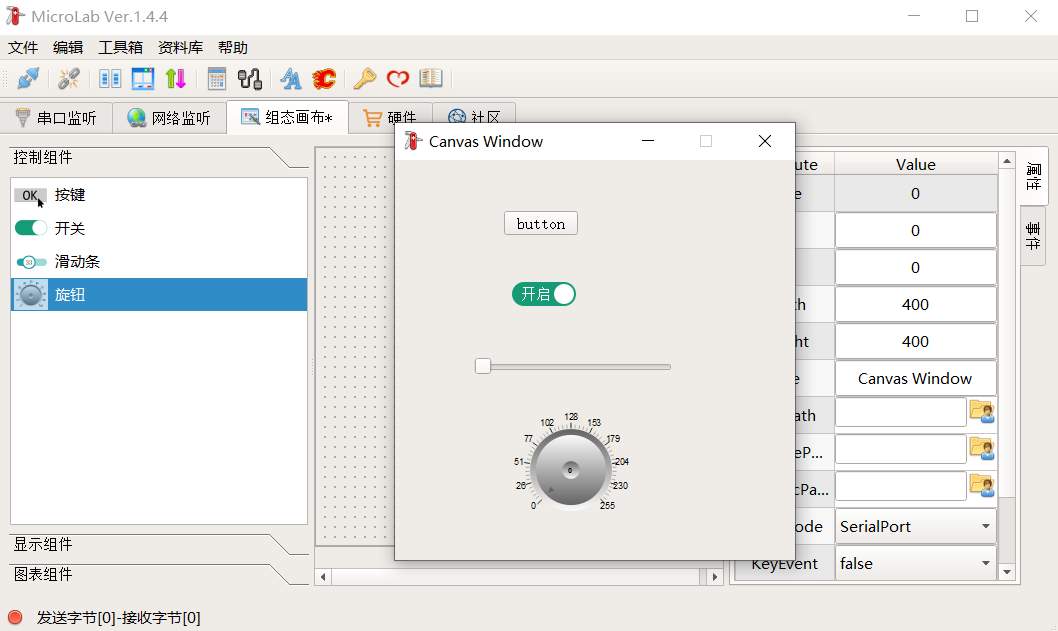
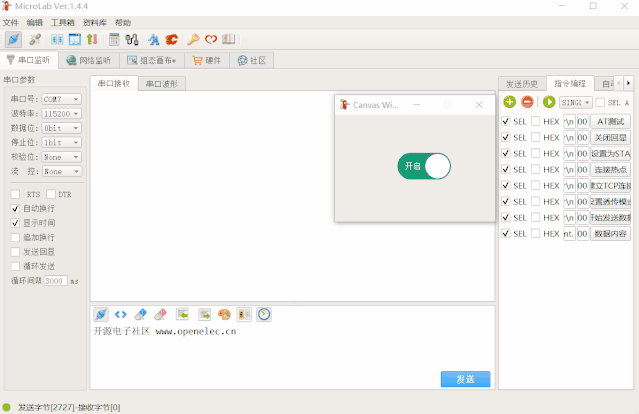
6. Open MicroLab and create a new canvas.
7. After downloading the program to the board, right-click on the dynamic canvas -> Run, click the button, and the LED light on the board will turn on and off together.
The following video is from Guo Guo Xiao Shidi.

END
→Follow to Stay Updated←