A Comprehensive Embedded Development Debugging Tool

Follow+Star Public Account, never miss exciting content
A Comprehensive Embedded Development Debugging Tool
Author | ZhiGuoXin
WeChat Official Account | GuoGuoLittleBrother
Have you ever used debugging tools for embedded development? Today I am excited to share a professional and comprehensive embedded debugging toolset: Micro-Lab
Before sharing the main content, let me recommend some embedded-related positions:

A Comprehensive Embedded Development Debugging Tool

What is Micro-Lab?

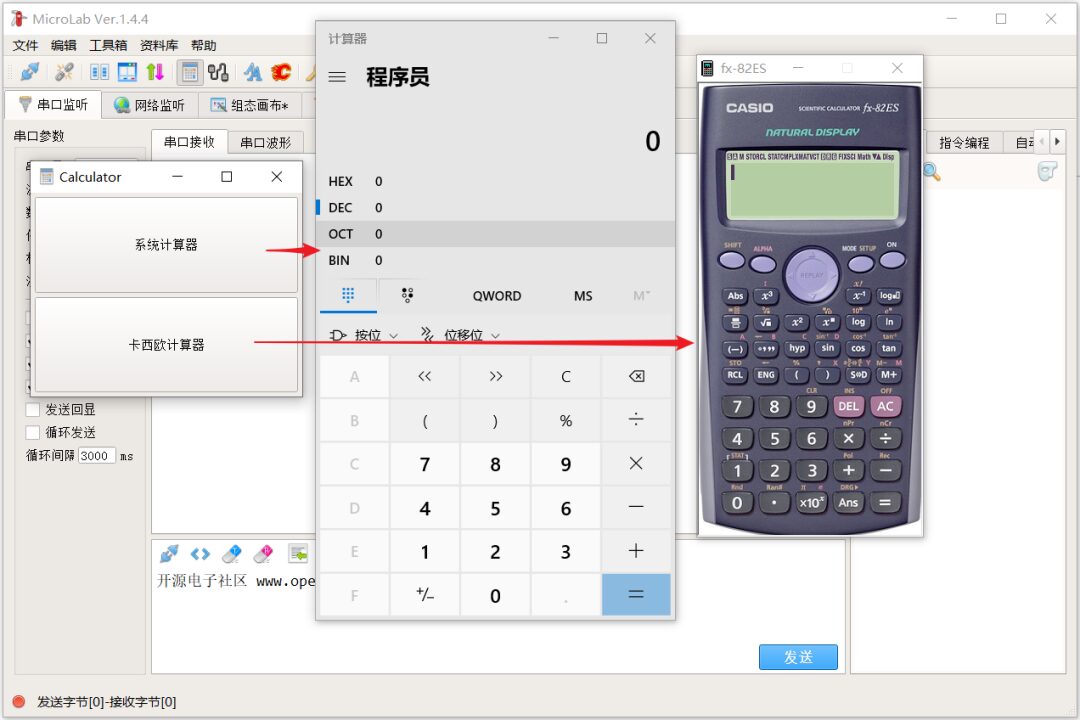
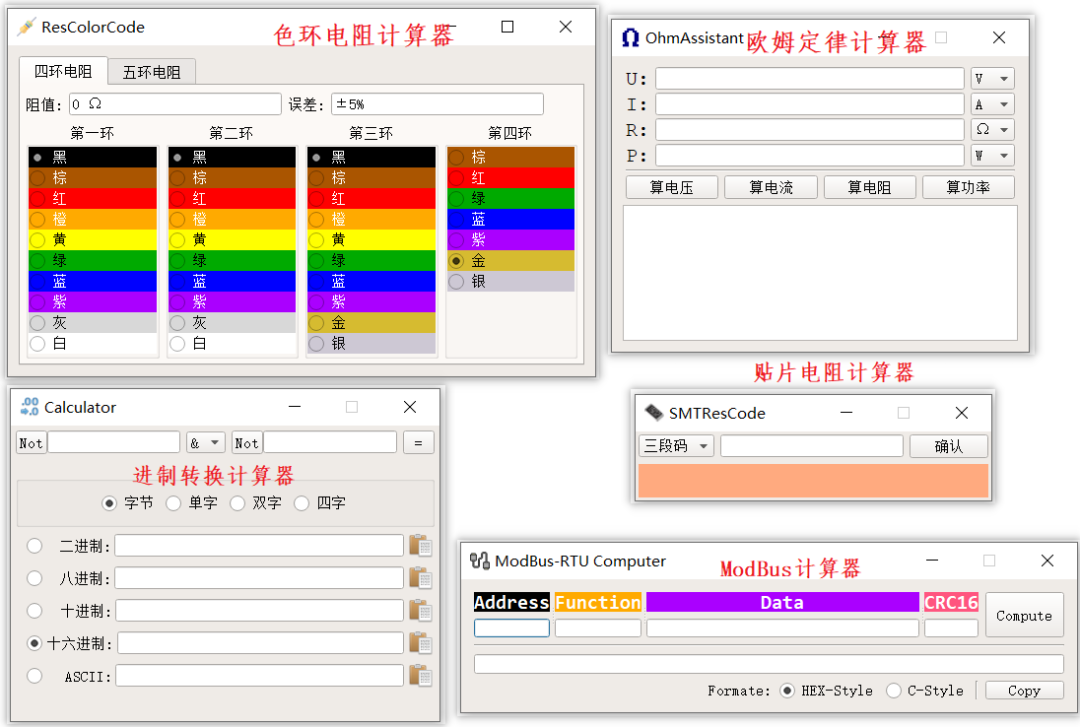
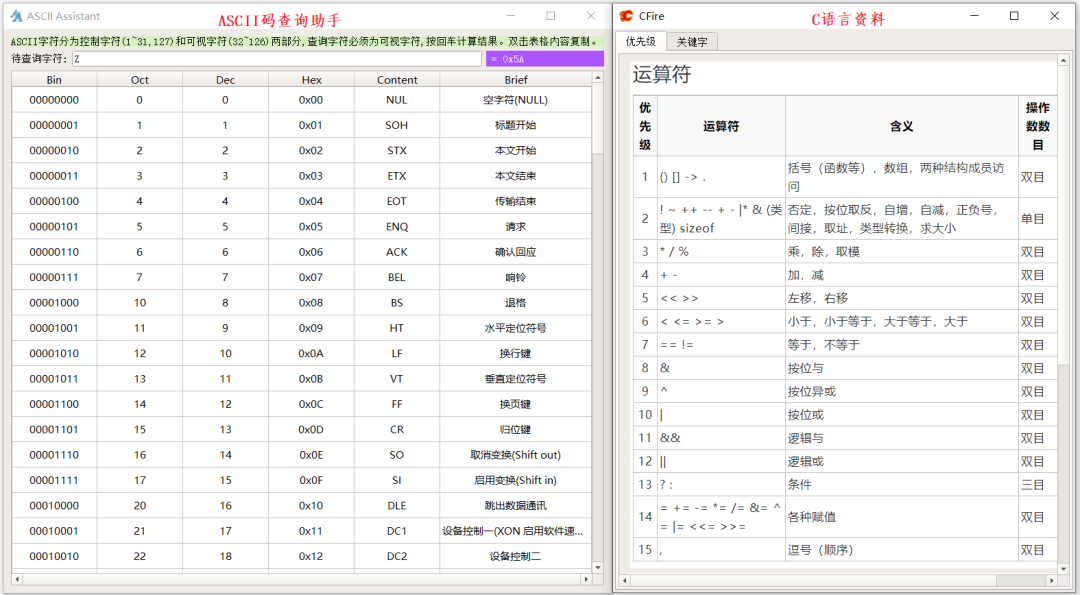
Micro-Lab is arguably the best embedded debugging tool to date. It addresses all the pain points encountered during debugging and introduces many new features, such as a brand new serial/network debugging service and associated modules, permanent storage of sending history with alias support, dynamic instruction programming for serial/network, virtual oscilloscopes for serial/network, super calculators, ModBus RTU calculators, DTUs, serial-network splitters, application shadowing, numerous development assistive tools and materials, and the revolutionary event-driven upper computer programming tool – VanGogh configuration canvas, among dozens of features.

A Comprehensive Embedded Development Debugging Tool

Users do not need to master any PC programming language; they can easily get started by dragging and dropping components with the mouse. It takes only a few minutes from requirement to prototype! In terms of usability and functional practicality, Micro-Lab is absolutely top-notch. It can be said that Micro-Lab redefines embedded debugging tools and has become a benchmark in the industry.
Let’s take a look at what it looks like:
A Comprehensive Embedded Development Debugging Tool

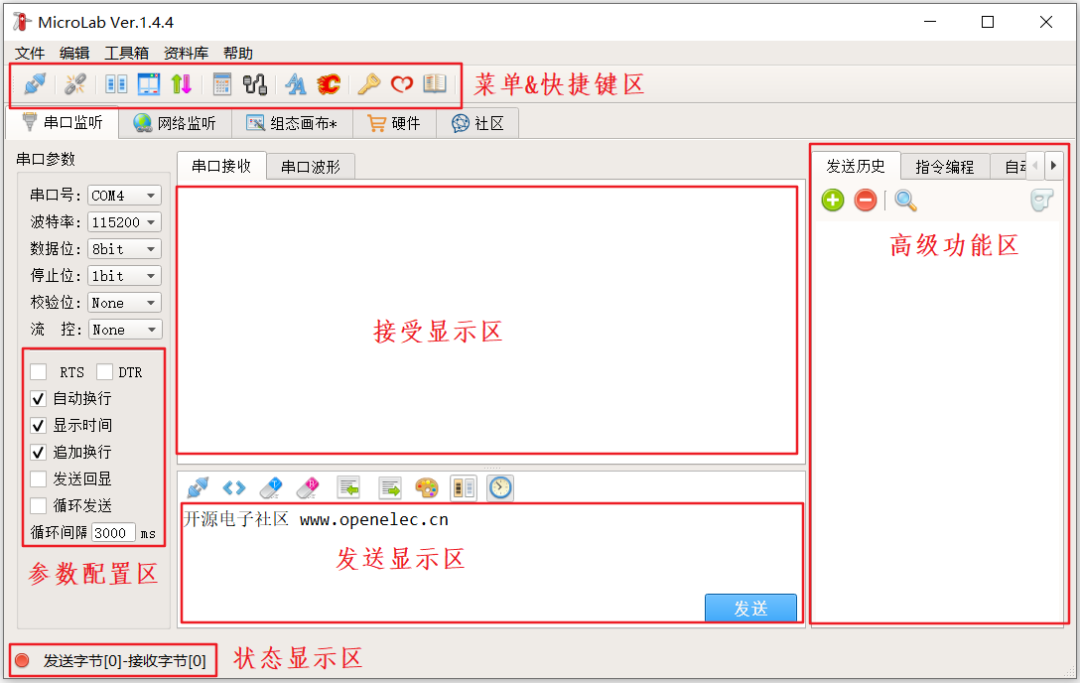
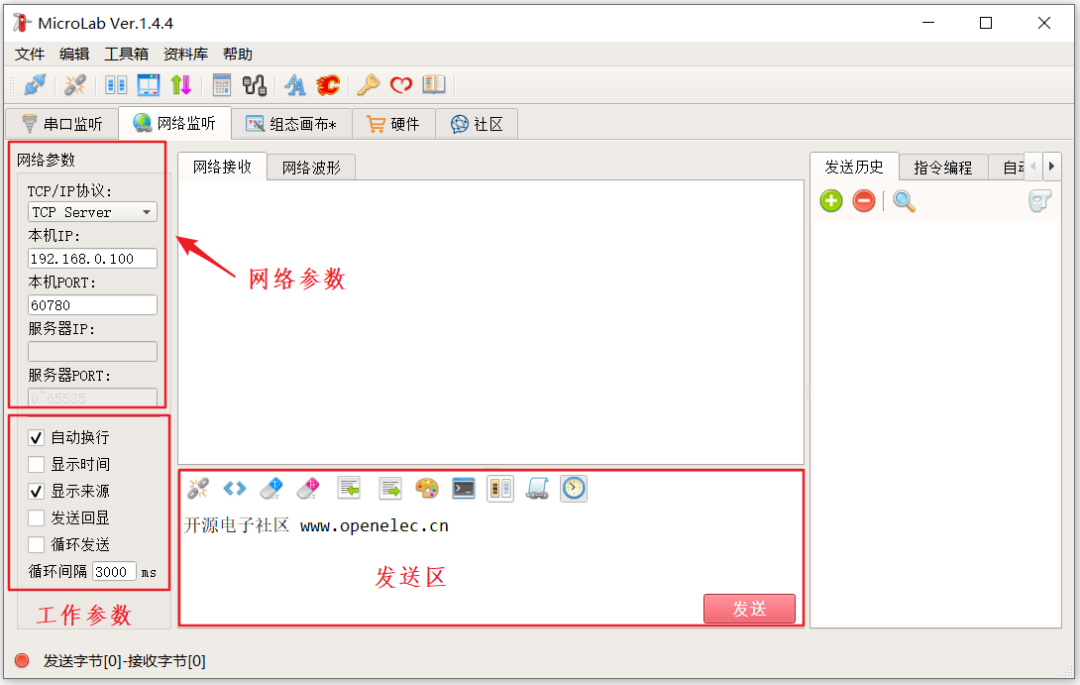
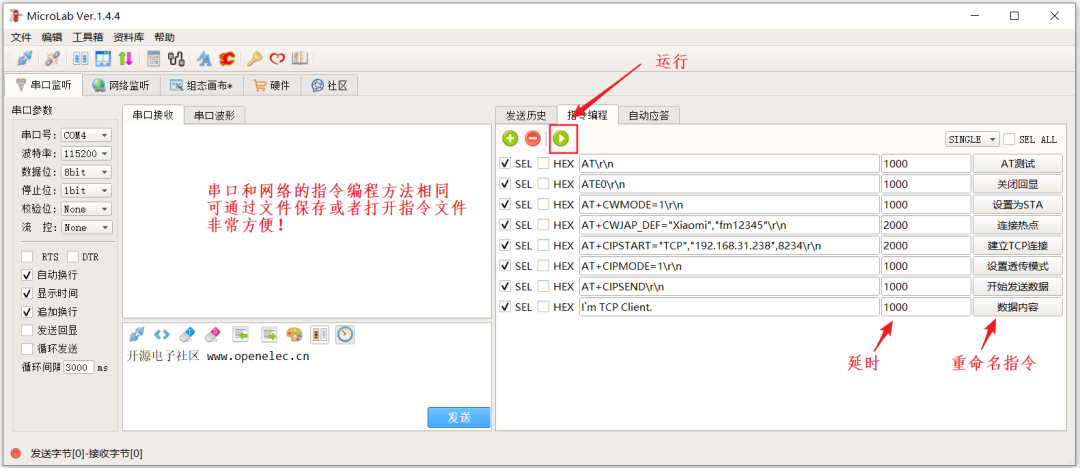
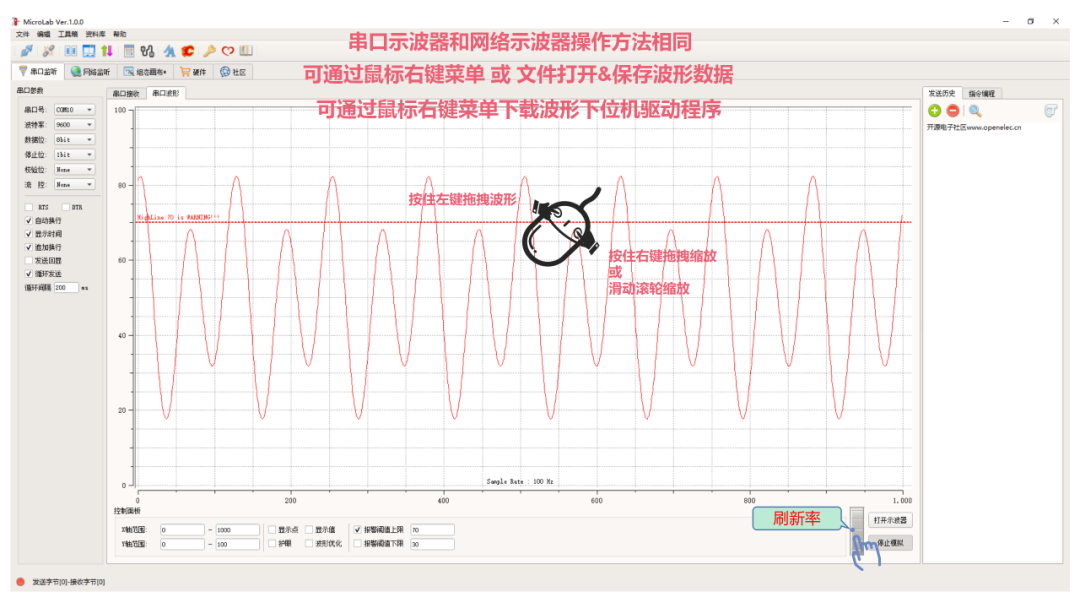
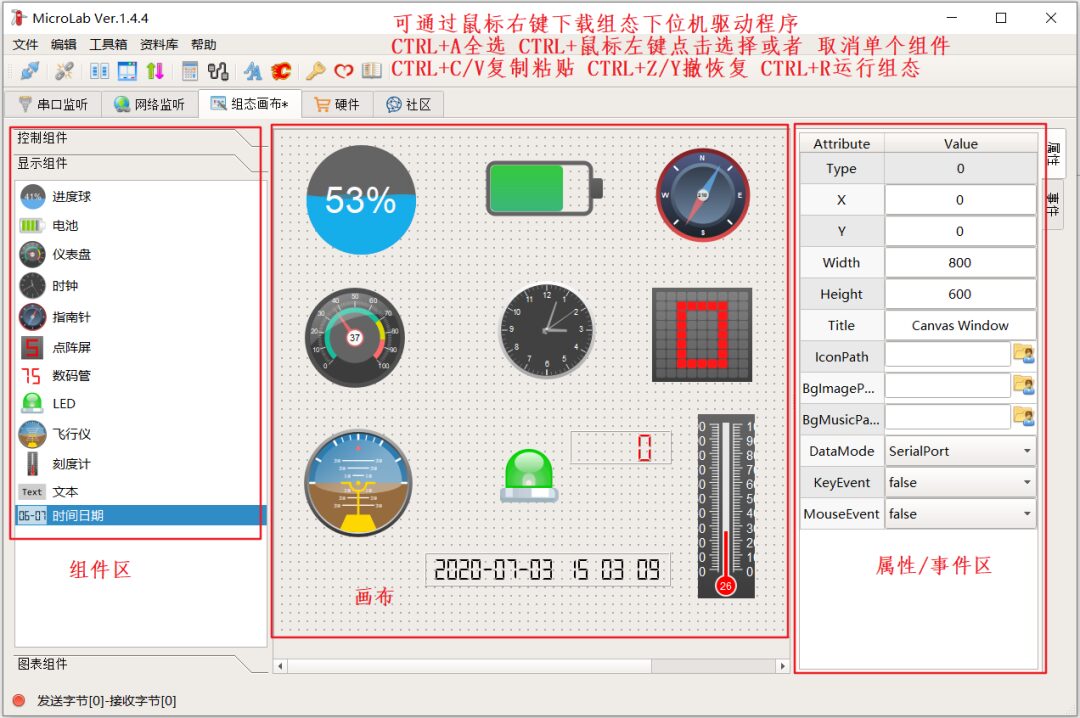
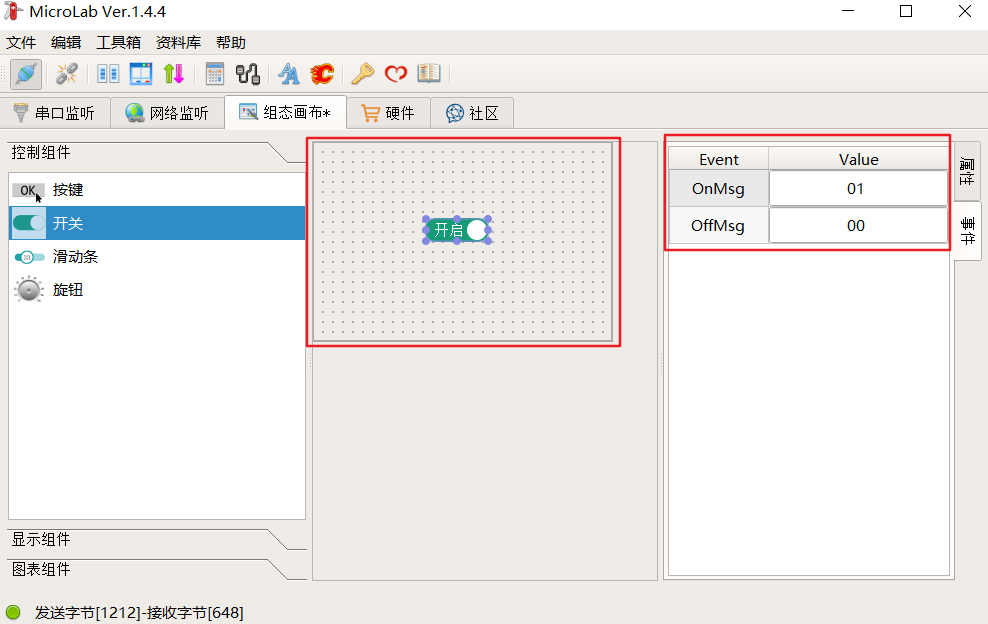
Micro-Lab Graphical Interface Design and Usage

A Comprehensive Embedded Development Debugging Tool

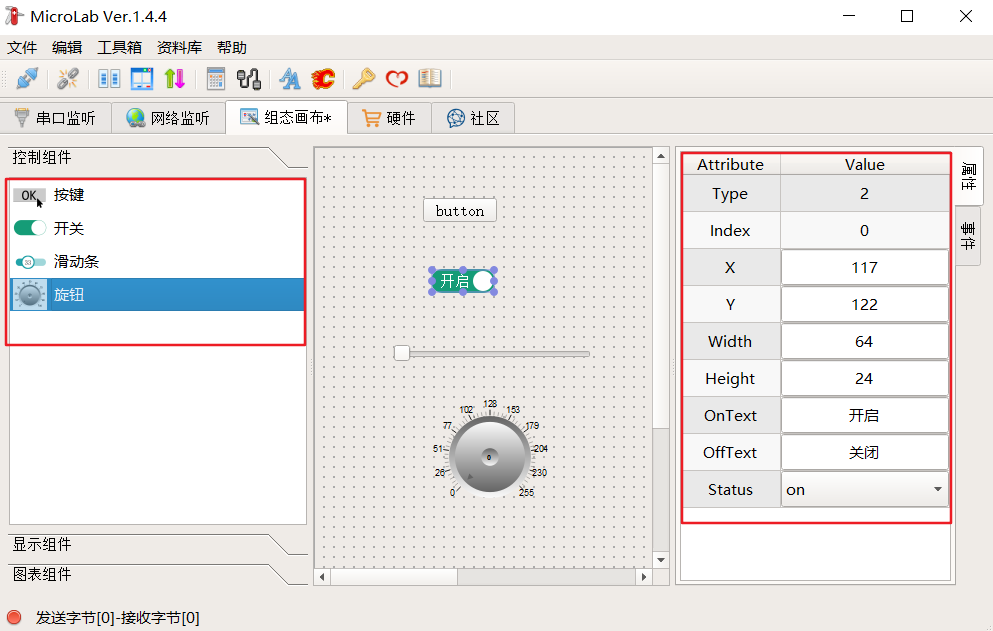
Switch to the configuration canvas page, then manually drag the relevant controls from the left to the central control placement area. When one of the controls is selected, you can change its properties on the right, similar to operating a serial screen. Even if you have never used it before, you can quickly get started without looking at the documentation. Once the controls are laid out, right-click in the control placement area and select Run. The interface you just designed will pop up, as shown below:

A Comprehensive Embedded Development Debugging Tool

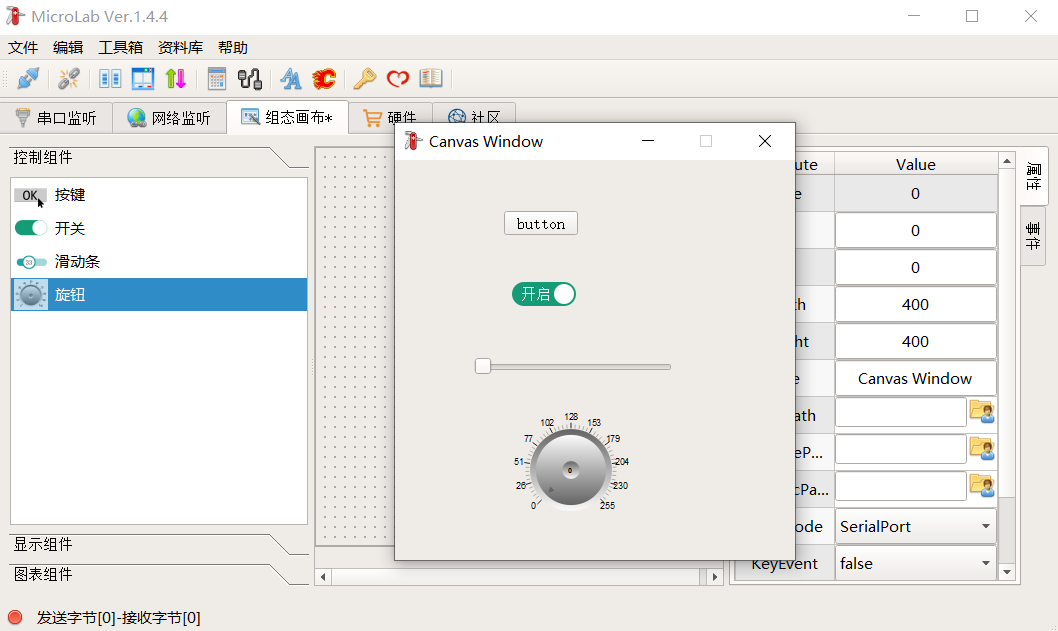
This way, when we are debugging the board, we can operate the interface in a very convenient and more visual manner, sending the corresponding instructions. Isn’t that very convenient? Doesn’t it have a bit of GUI feel?

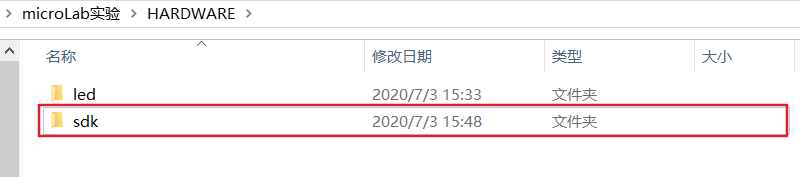
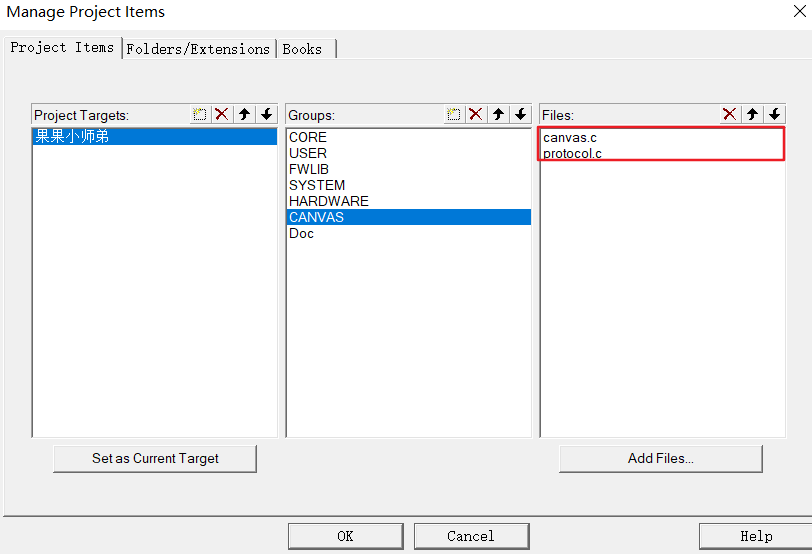
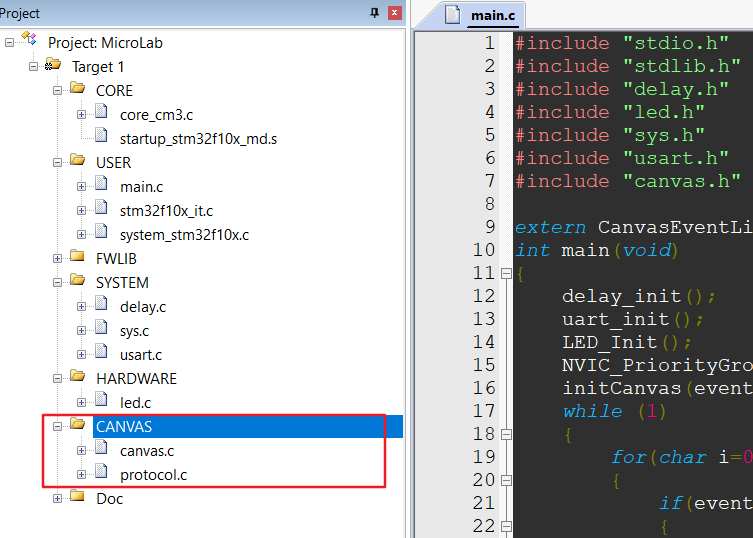
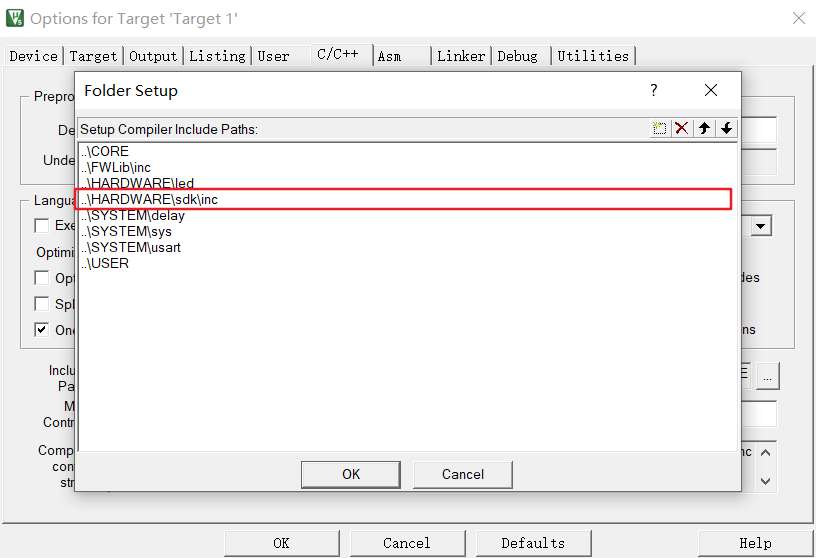
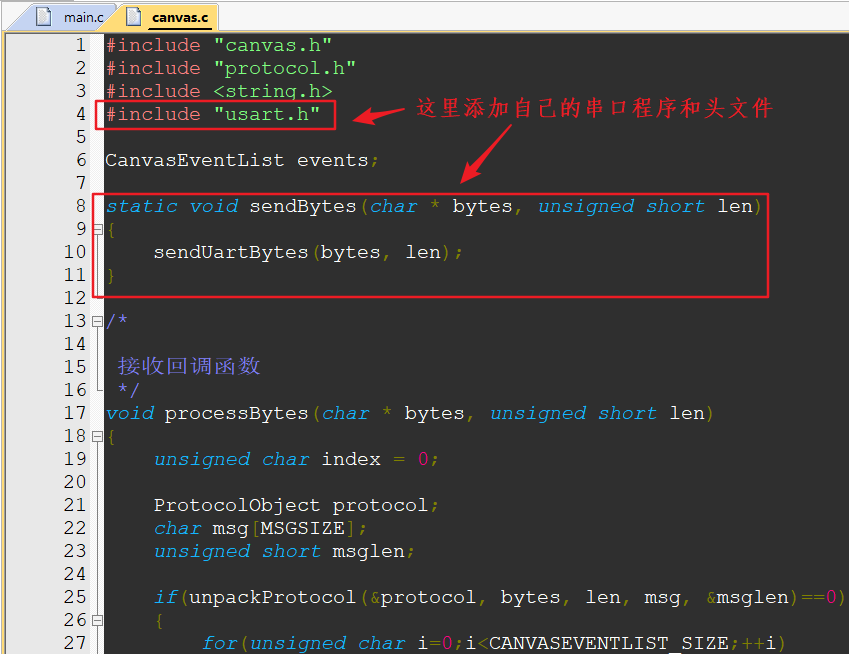
Porting the SDK to STM32
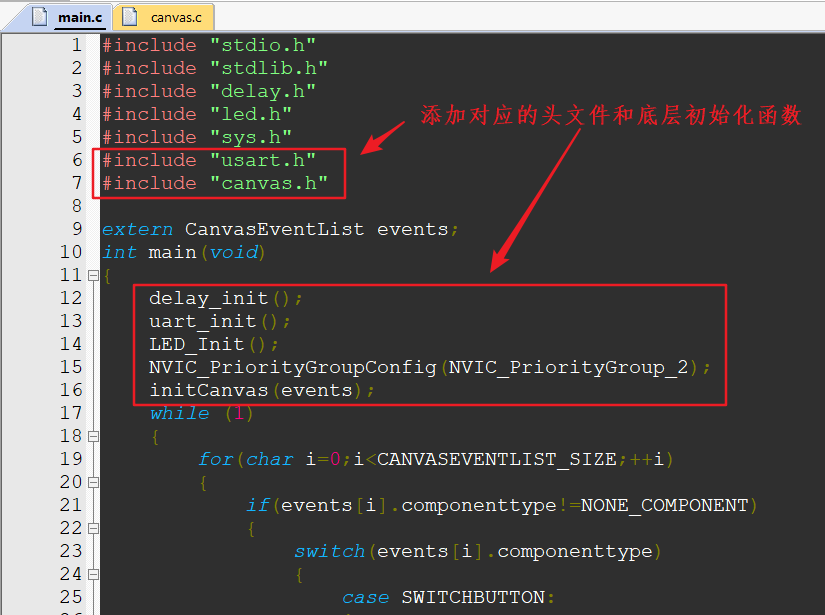
Here I am using the core board STM32F103C8T6. 1. Copy the SDK package into our project.
A Comprehensive Embedded Development Debugging Tool
2. Add the SDK source files in MDK and include the SDK header files in MDK.
A Comprehensive Embedded Development Debugging Tool
3. Modify the project
A Comprehensive Embedded Development Debugging Tool
4. Use Micro-Lab
A Comprehensive Embedded Development Debugging Tool
5. Here we use Micro-Lab’s dynamic canvas to control an LED light on the minimum system board.
int main(void)
{
 delay_init();
 uart_init();
 LED_Init();
 NVIC_PriorityGroupConfig(NVIC_PriorityGroup_2);
 initCanvas(events);
 while (1)
 {
 for(char i=0;i<CANVASEVENTLIST_SIZE;++i)
 {
 if(events[i].componenttype!=NONE_COMPONENT)
 {
 switch(events[i].componenttype)
 {
 case SWITCHBUTTON:
 {
 if(events[i].componentnumer==0)
 {
 if(events[i].componentmsgtype==SWITCH_ON)
 {
 LED=0;
 printf("SWITCHBUTTON  ON, ");
 printf("MSG : ");
 for(unsigned short j=0;j<events[i].msglen;++j)
 {
 printf("%2X ", events[i].msg[j]);
 }
 printf("\r\n");
 }else if(events[i].componentmsgtype==SWITCH_OFF)
 {
 LED=1;
 printf("SWITCHBUTTON  OFF, ");
 printf("MSG : ");
 for(unsigned short j=0;j<events[i].msglen;++j)
 {
 printf("%2X ", events[i].msg[j]);
 }
 printf("\r\n");
 }else
 {
 }
 }
 }
 break;
 default:
 break;
 }
 events[i].componenttype = NONE_COMPONENT;
 events[i].componentnumer = 0;
 events[i].componentmsgtype = NONE_MSG;
 events[i].msglen = 0;
 }else
 {
 }
 }
 }
}
}
Here you may notice that I used examples from ZhenDianYuanZi. Considering that most of my audience are students, they might be more familiar with ZhenDianYuanZi and YeHuo’s programs, making it easier for them to port or understand. Haha, isn’t it thoughtful of me?
6. Open MicroLab and create a new canvas.
A Comprehensive Embedded Development Debugging Tool
7. After downloading the program to the board, right-click on the dynamic canvas -> Run, click the button, and the LED light on the board will turn on and off together.
A Comprehensive Embedded Development Debugging Tool
The following video is courtesy of GuoGuoLittleBrother
Micro-Lab is continuously growing, and I believe there will be more fun features in the future. Stay tuned!

———— END ————

A Comprehensive Embedded Development Debugging Tool

● Column “Embedded Tools”

● Column “Embedded Development”

● Column “Keil Tutorial”

● Selected Tutorials from the Embedded Column

Follow the official account reply “Join Group” to join the technical exchange group according to the rules, reply “1024” to see more content.

A Comprehensive Embedded Development Debugging Tool

A Comprehensive Embedded Development Debugging Tool

Click “Read Original” to see more shares.

Leave a Comment