Transforming ESP32 into a Portable Oscilloscope

Transforming ESP32 into a Portable Oscilloscope

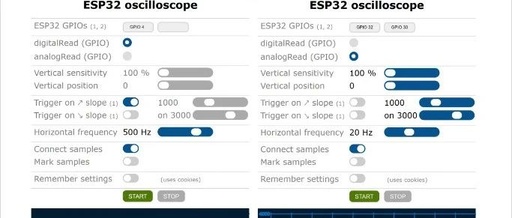
In embedded development, an oscilloscope is an essential debugging tool that allows developers to visually observe the signal waveforms in circuits, helping them quickly locate issues. However, traditional oscilloscopes are expensive and bulky, making them unsuitable for portable development. The ESP32, as a powerful Wi-Fi microcontroller, has abundant GPIO resources and strong processing capability, making … Read more

Master These Debugging Techniques in Android Studio

Master These Debugging Techniques in Android Studio

Reply 1024, randomly give you beautiful wallpapers Debugging breakpoints tracking is an important means of analyzing code and solving bugs during software development. The use of debugging tools varies across different IDEs, but the debugging features provided are certainly comprehensive. Many programmers’ debugging abilities are limited to basic step execution and breakpoint jumping, unaware that … Read more

Understanding ARM Cortex-M Debugging and Tracing Techniques

Understanding ARM Cortex-M Debugging and Tracing Techniques

Follow+Star Public Account, don’t miss exciting content Author | strongerHuang WeChat Official Account | strongerHuang Nowadays, the convenience of debugging numerous Cortex-M processors is due to a technology called CoreSight based on Arm Cortex-M processor devices, which introduces powerful new debugging and tracing functions. Next, let’s focus on the debugging and tracing aspects of CoreSight. … Read more

Experience Sharing on Using ARM Cortex-M Series MCU Error Code Automatic Tracking Library

Experience Sharing on Using ARM Cortex-M Series MCU Error Code Automatic Tracking Library

Have you encountered the HardFault issue while using STM32? I was troubled by this issue for a long time, and here’s a brief summary of it. Phenomenon restoration: During simulation debugging in debug mode, when running at full speed and then stopping, the program jumps to the HardFault_Handler function, resulting in a HardFault, which is … Read more

How to View and Debug Android Source Code Using Android Studio

How to View and Debug Android Source Code Using Android Studio

Today’s Tech News Recently, it was reported that the local life service company formed by the merger of Ele.me and Koubei has raised $4 billion in funding, bringing its valuation to $30 billion. According to insiders, over $3 billion of the new funding comes from Alibaba and SoftBank’s Vision Fund, with Primavera Capital Group and … Read more

Comprehensive Guide to Anti-Debugging Techniques in Android Reverse Engineering

Comprehensive Guide to Anti-Debugging Techniques in Android Reverse Engineering

Comprehensive Guide to Anti-Debugging Techniques in Android Reverse Engineering It has been a while since I last wrote an article. Recently, I have been working on several bank projects, and most financial apps have anti-debugging measures. Today, I would like to share some anti-debugging strategies that I frequently encounter in these projects. The following methods … Read more

Three Practical Tips for Debugging Automotive Embedded Software

Three Practical Tips for Debugging Automotive Embedded Software

Since graduating with a master’s degree, I have been working in the automotive embedded industry for three years. Compared to school projects, company projects have stricter requirements for code writing standards and test cases. In the automotive industry, most of the engineers’ code is generated by EB Tresos, Davinci, and Matlab, with only a few … Read more

VxWorks 7 Training Video: kprintf() Debugging Function

VxWorks 7 Training Video: kprintf() Debugging Function

To download the demonstration document from the video, please click “Read the original text” The kprintf() user interface is a lightweight logging mechanism that is very helpful for debugging startup issues on the target machine. You will see how to enable this feature and the problems you may encounter when debugging during the VxWorks startup … Read more