GDB Dashboard: A Visual Tool for GDB Modules

GDB Dashboard: A Visual Tool for GDB Modules

Shake Network Technology News Click the right side to follow for the latest tech news! About GDB Dashboard GDB Dashboard is a visual tool for GDB modules, developed in pure Python, providing a modular visual interface for GDB in Python. GDB Dashboard provides a standalone single-file .gdbinit, which, among other features, enables a configurable dashboard … Read more

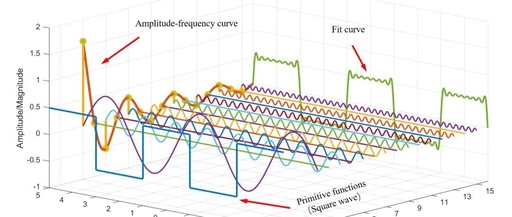
MATLAB Plotting Techniques | 3D Line Plot (With Code)

MATLAB Plotting Techniques | 3D Line Plot (With Code)

3D data visualization provides learners with intuitive images and is widely used. The previous post mainly introduced 3D surface plotting, involving functions such as meshgrid, mesh, meshc, surf, surfl, and surfc. The 3D line plot aims to showcase the curve distribution in three-dimensional space and uses the MATLAB function plot3. The difference from the 2D … Read more