The user interface rendering in Android generates a frame from the application and displays it on the screen. To ensure users have a smooth interaction experience, your application needs to complete the generation of each frame within the device’s refresh rate. For example, the Pixel 6 device supports rendering up to 90 frames per second, which means each frame task must be completed within 1000/90 = 11ms. If not, the Android framework will skip rendering that frame, and users will visually perceive the interface as running slowly, which we call “lag“.
There are many reasons for lag, such as lag caused by the application or lag caused by SurfaceFlinger. This article focuses on lag caused by the application and the tools provided by Android Studio to discover and eliminate these lags by checking recorded traces during application interaction to resolve performance issues.
Note: The lag detection interface shown in this article is updated in Android Studio Chipmunk and requires a real device or emulator running Android 12 (API level 31) or higher.
From Real-time Interaction Record Traces
The following example uses the JankStatsSample application from the GitHub performance sample repository to demonstrate how to use the CPU profiler to identify the cause of lag:
https://github.com/android/performance-samples/tree/main/JankStatsSample
1. Open JankStatsSample and run the application.
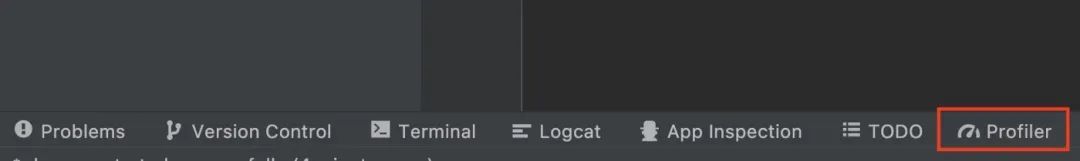
2. Open the Profiler tab at the bottom of Android Studio.
3. Click the + icon in the left pane of the Profiler to start a new performance analysis session, then select the device name and application process to run the profiler.

Note: Although you can analyze a “debuggable app”, it is recommended to analyze a “profileable app” because analyzing a “debuggable app” will significantly increase performance overhead. For more details, please refer to the documentation on profileable apps:
https://developer.android.google.cn/studio/profile#profileable-apps
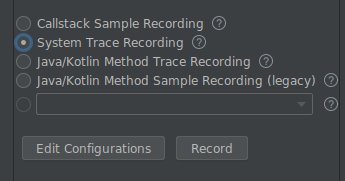
5. Select System Trace Recording, and click Record.
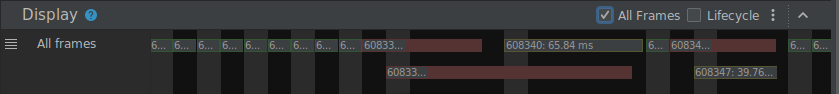
6. Interact with the application to collect data, then click the Stop button. Android Studio will display the Display pane, where lag frames are visible, and you can check the All Frames checkbox to also show non-lag frames in the trace recording.
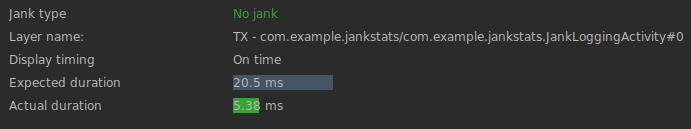
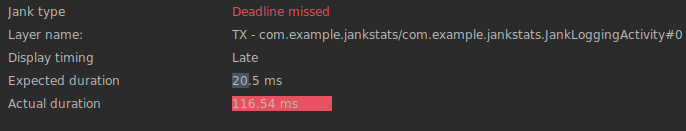
Hovering the mouse pointer over or clicking on a frame will show detailed frame information. If you check the All Frames checkbox, there will be three types of frames.
-
Frames considered lagging because the application process ran longer than expected and missed the deadline for the expected frame duration. From the perspective of application developers, actionable frames are usually red frames.
-
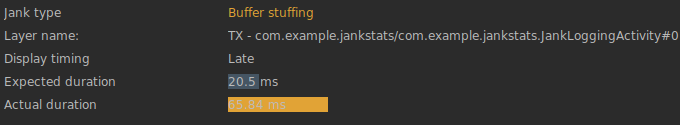
Frames considered as buffer filling, indicating that the application keeps sending frames to the system before rendering the previous frame. This is usually caused by the previous frame lag, and application developers have no power over yellow frames.
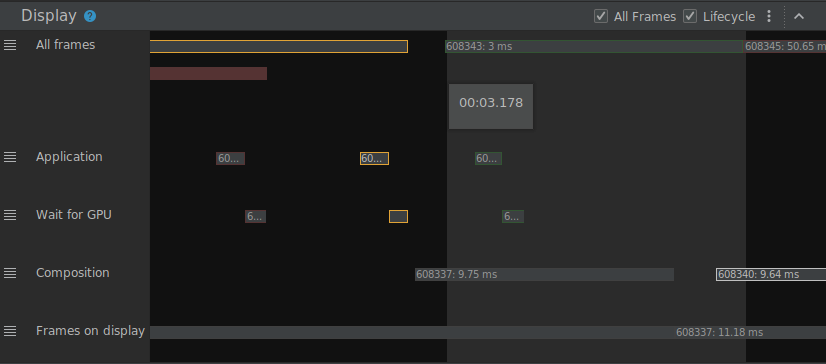
Checking the Lifecycle checkbox allows you to toggle the display/hide of four additional traces.
Four traces:
The display of these trace information has been added in Android Studio Bumblebee (2021.1.1) stable version. You can find detailed descriptions of each trace in the documentation:
https://developer.android.google.cn/studio/profile/jank-detection#jank-detection-android-11
Next, let’s identify the cause of lag frames.
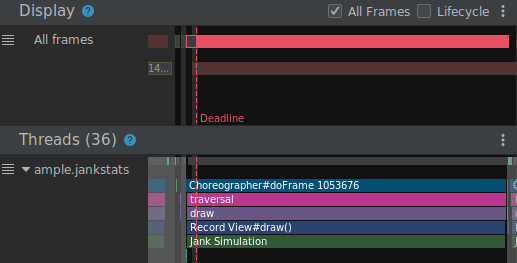
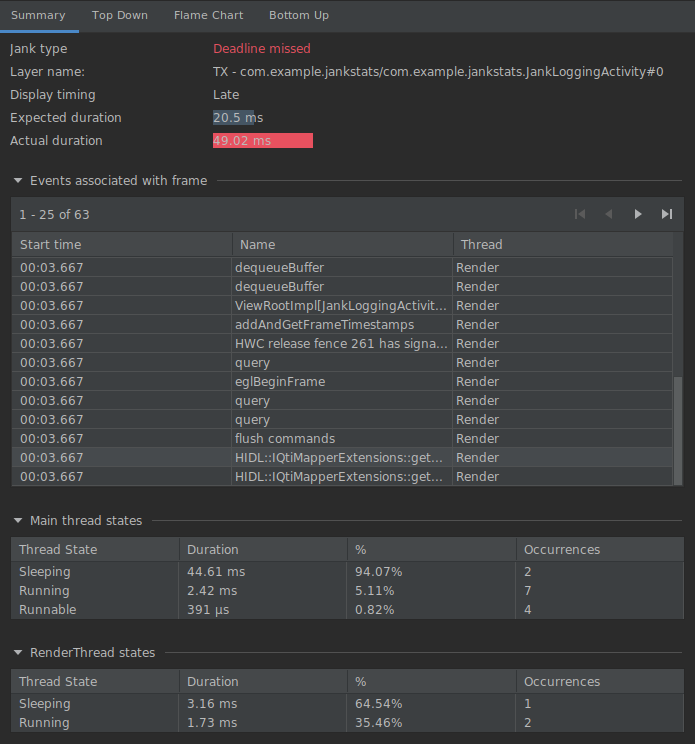
1. Select a lag frame in the Janky frames trace, the Display pane will highlight the corresponding lifecycle data, and the Threads pane will highlight the corresponding thread data.
The dashed Deadline represents the deadline. When the duration of the frame exceeds that deadline, the frame is considered lagging.
You can also view detailed analysis in the right pane of Android Studio.
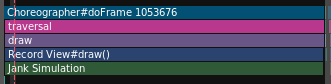
2. If you look at the corresponding trace pane of the application main thread, you can see a lot of time spent in “View#draw”.
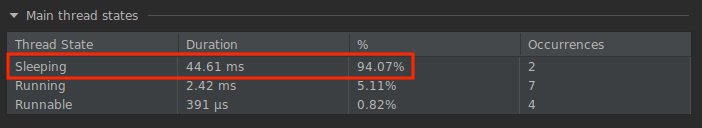
Additionally, as shown in the main thread state in the detailed analysis pane, many threads are in a sleeping state.
3. Let’s take a look at the code calling View#draw. The View#onDraw is overridden in the JankyView class:
https://github.com/android/performance-samples/blob/main/JankStatsSample/app/src/main/java/com/example/jankstats/JankyView.kt#L36
override fun onDraw(canvas: Canvas) { simulateJank() super.onDraw(canvas)}
The simulateJank method called from onDraw is defined as follows:
https://github.com/android/performance-samples/blob/main/JankStatsSample/app/src/main/java/com/example/jankstats/tools/simulateJank.kt#L29
fun simulateJank( jankProbability: Double = 0.3, extremeJankProbability: Double = 0.02) { val probability = nextFloat() if (probability > 1 - jankProbability) { val delay = if (probability > 1 - extremeJankProbability) { nextLong(500, 700) } else { nextLong(32, 82) } try { // Simulate lag for easier identification in the profiler trace("Jank Simulation") { Thread.sleep(delay) } } catch (e: Exception) { } }}
It is evident that the simulateJank method calls Thread.sleep. Clearly, this is because the JankStatsSample application was specifically created to simulate lag. However, it is worth noting that from the overview of lag frames to more detailed analysis, you can identify the actual code.
Note: While calling Thread.sleep in this example is clearly problematic, in reality, when optimizing actual application code, you will face more difficult decisions. The Microbenchmark Development Library can help measure whether the changes made achieve the desired effect:
https://developer.android.google.cn/topic/performance/benchmarking/microbenchmark-overview
Note: The system trace shows multiple parts captured by platform code and libraries belonging to the application, which usually do not have enough information. Adding custom traces can improve this situation, one way to add is by using the AndroidX Tracing library’s trace(“MySection”) { /* this will be in the trace */ }.
For example, the trace(“Jank Simulation”) { … } in this example shows up in the trace section of the corresponding thread.
For more information on reading traces and adding custom traces, refer to the System Trace Overview:
https://developer.android.google.cn/topic/performance/tracing
4. Change the code to not call the simulateJank method in onDraw and then check if lag frames still exist.
override fun onDraw(canvas: Canvas) { // simulateJank() super.onDraw(canvas)}
This time, when you rerun the system trace recording, you will find that there are no lag frames in the interaction with the application.
You can also follow these steps to save traces and load them later. After saving and loading traces, you can compare the tracking records of different versions or share them with others.
Note: You can also use the Macrobenchmark library to obtain system traces:
https://developer.android.google.cn/topic/performance/benchmarking/macrobenchmark-overview
1. Follow the same steps from step 1 to step 6 to record traces through real-time interaction.
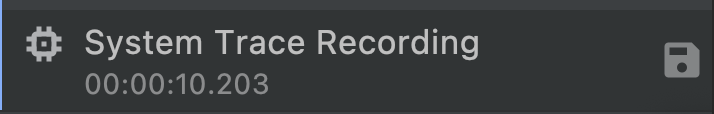
2. Click the save icon to export the record.
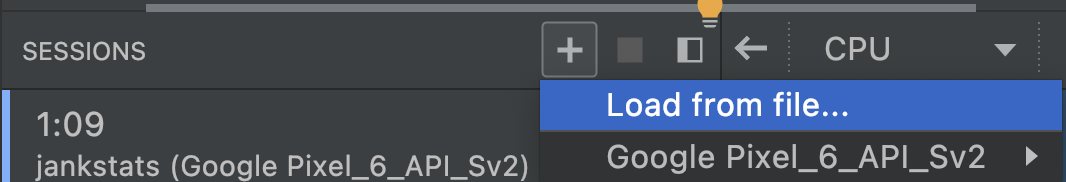
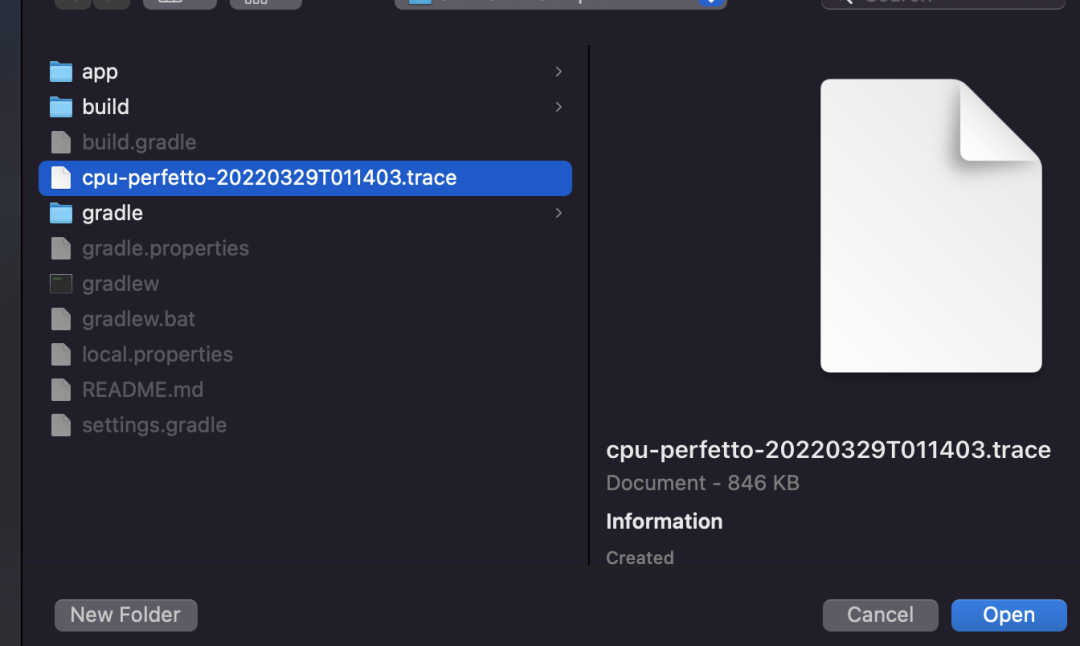
3. Then, navigate to + -> Load from file… to load the saved system trace recording, selecting the saved file exported in the previous step.
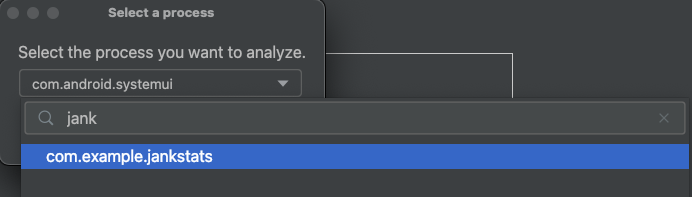
4. Select the process you want to analyze. After displaying the process list dropdown menu, you can quickly find it by entering part of the process name.
You can then load the saved trace and view lag frames just like from real-time interaction recording.
That’s all for this issue. Starting from Android Studio Chipmunk, you can see more accurate performance analysis data and quickly identify application lags.
Please check the documentation for more information on using the CPU profiler, and feel free to visit the “Help -> Submit Feedback” in Android Studio to help us improve the tools.
You can also check the video presentation at the Google I/O conference below — Recent Updates on Android Application Performance, which covers a wealth of topics regarding performance, including how to avoid lag frames.
△ Recent Updates on Android Application Performance
We have released a library that can be used to detect and report application lag running on user devices. If you want to know more details, please check the JankStats documentation:
https://developer.android.google.cn/studio/profile/jankstats
You can submit feedback, share your favorite content, or report issues through the QR code below or by sending a private message at the bottom of the article. Your feedback is very important to us, thank you for your support!

If the page does not load, please refresh and try again
 Click the screen end | Read the original text | Learn more about using the CPU profiler