Follow+Star PublicAccount, don’t miss exciting content
Source | IOT Internet of Things Town
Most of the friends who are engaged in embedded development have used GDB for debugging. If you say you haven’t used it, it can only mean that your development experience is not challenging enough and you still need to continue to be beaten by bugs.
This article will talk about the underlying principles of GDB debugging. The content is quite extensive, and it may take some time to read through this article. For your health, it is not recommended to read this article while squatting.

GDB Debugging Model
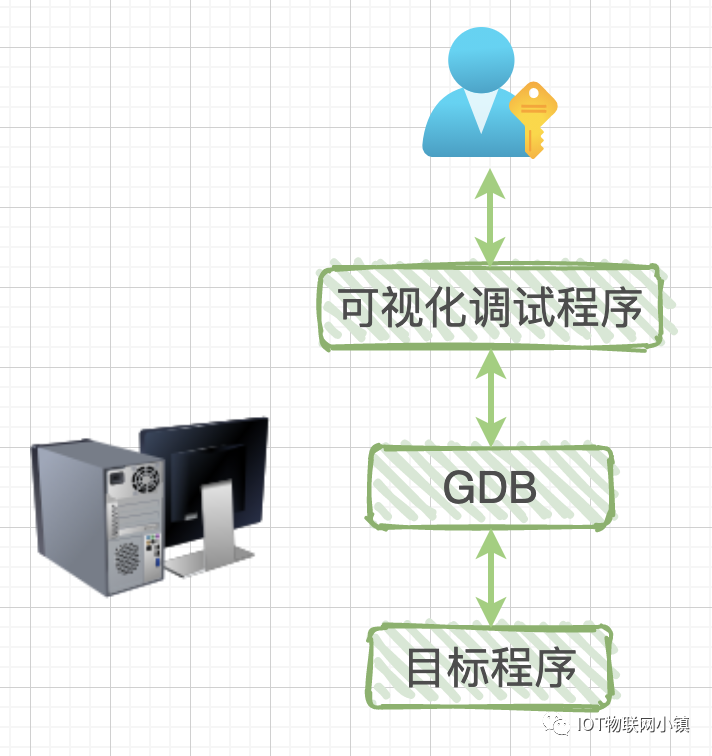
GDB debugging includes two programs: the gdb program and the program being debugged. Depending on whether these two programs run on the same computer, GDB’s debugging model can be divided into two types:local debugging and remote debugging.
Local debugging: The debugging program and the program being debugged run on the same computer.
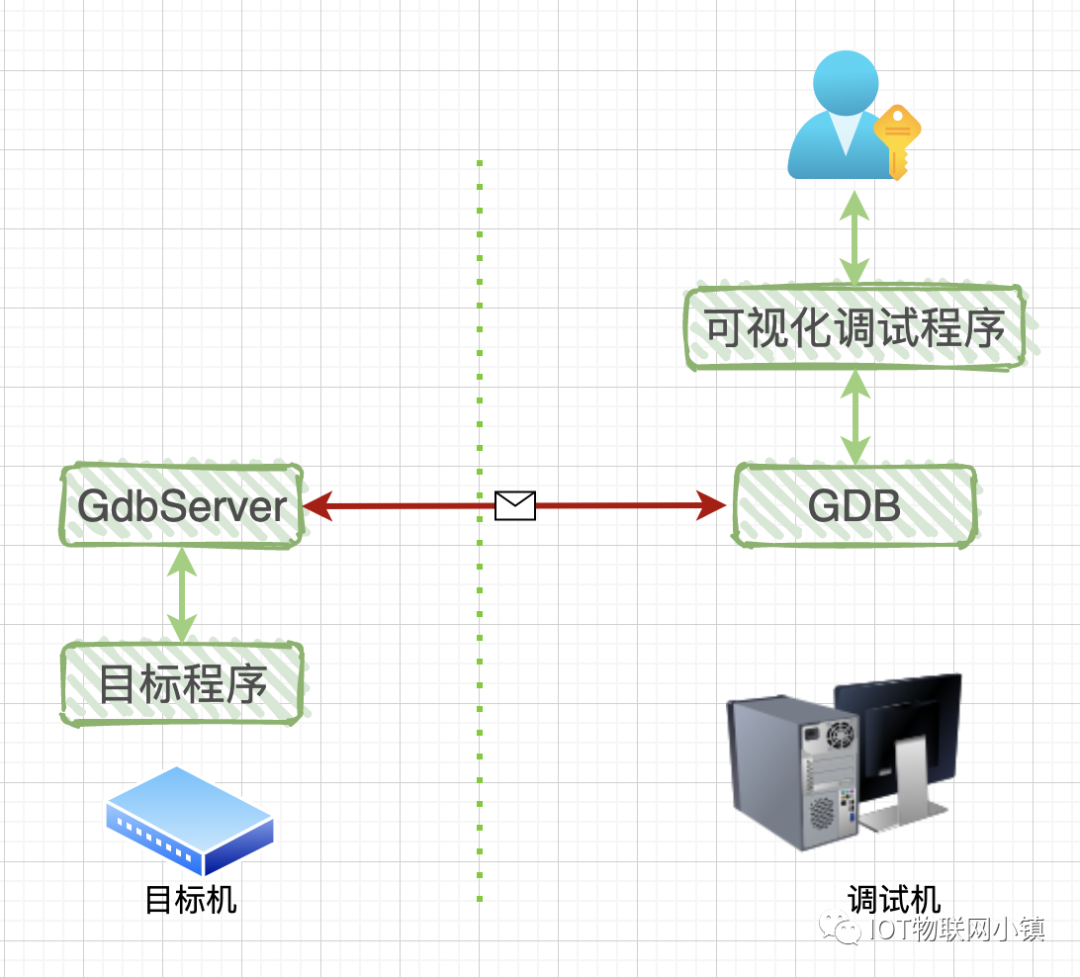
Remote debugging: The debugging program runs on one computer, while the program being debugged runs on another computer.
The focus is not on the visual debugging program; it is merely a shell to encapsulate GDB. We can use a dark terminal window to debug the program, or we can use an integrated development environment (IDE) that has a debugger embedded in it, allowing us to click various buttons instead of manually entering debugging commands.
Compared to local debugging, remote debugging adds GdbServer, which runs on the target machine, which may be an x86 computer or an ARM board. The red line in the diagram indicates that GDB communicates with GdbServer via a network or serial port. Since it’s communication, a communication protocol is needed: RSP protocol, which stands for GDB Remote Serial Protocol.
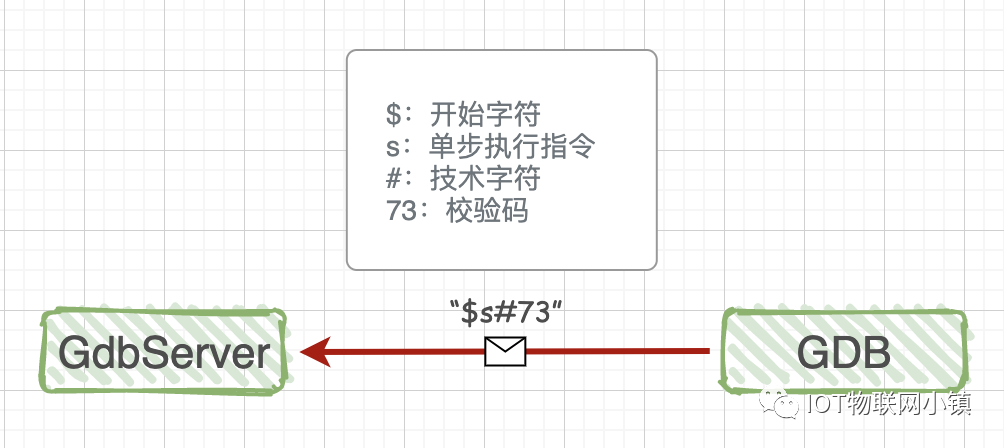
We don’t need to worry about the specific format and content of the communication protocol; we just need to know: they are all strings that have a fixed start character (‘$’) and an end character (‘#’), followed by two hexadecimal ASCII characters as a checksum. Knowing this much is enough. As for more details, if you’re really bored, you can take a glance; these protocols are like various bizarre regulations in society, all thought up by a bunch of experts in the bathroom.
In the second article explaining LUA, we will implement a similar remote debugging prototype. The communication protocol is also a string, which is a simplified version of the HTTP protocol, making it very clear and convenient.

GDB Debugging Commands
For completeness, here are some GDB debugging commands for general understanding. Not all commands are listed here; the ones listed are commonly used and relatively easy to understand. During the LUA explanation, we will choose some of these commands for detailed comparison, including the underlying implementation mechanisms.
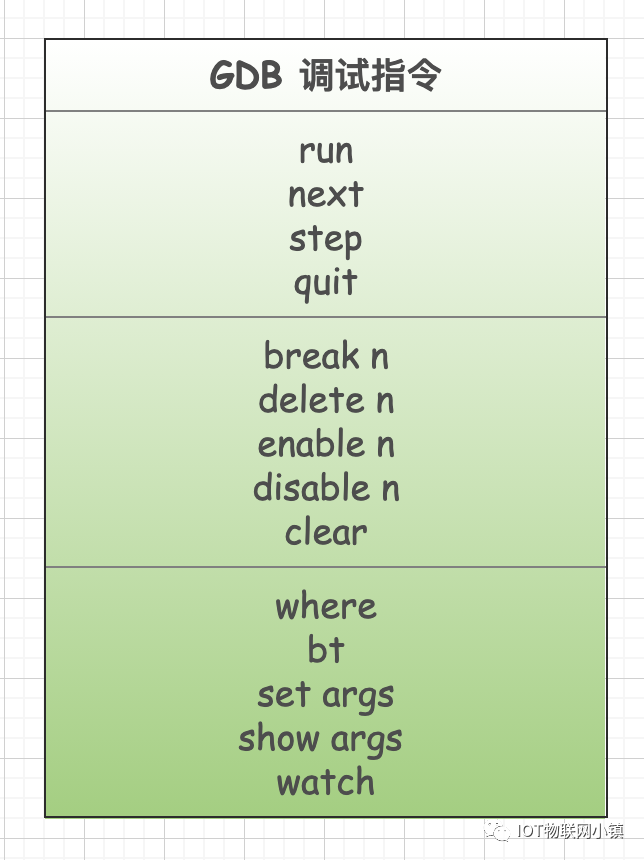
Each specific debugging command has many parameters, such as those related to breakpoints, which include: setting breakpoints, deleting breakpoints, conditional breakpoints, temporarily disabling and enabling, etc. The focus of this article is to understand the underlying debugging mechanism of gdb, so the usage methods of these commands at the application layer will not be listed here, as there are many resources available online.
GDB and the Relationship with the Program Being Debugged
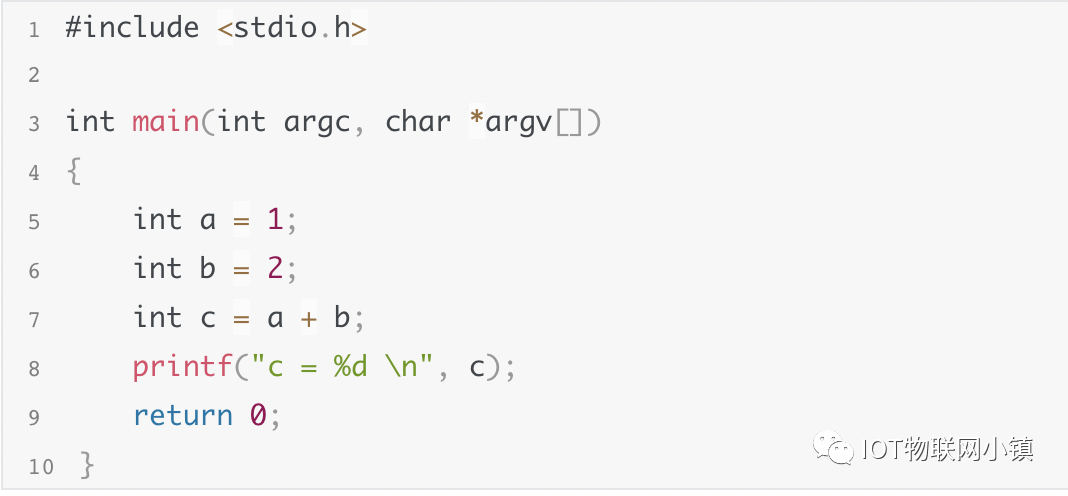
To facilitate description, let’s first write the simplest C program:

Compile command: $ gcc -g test.c -o test
We debug the executable program test by entering the command: $ gdb ./test,the output is as follows:
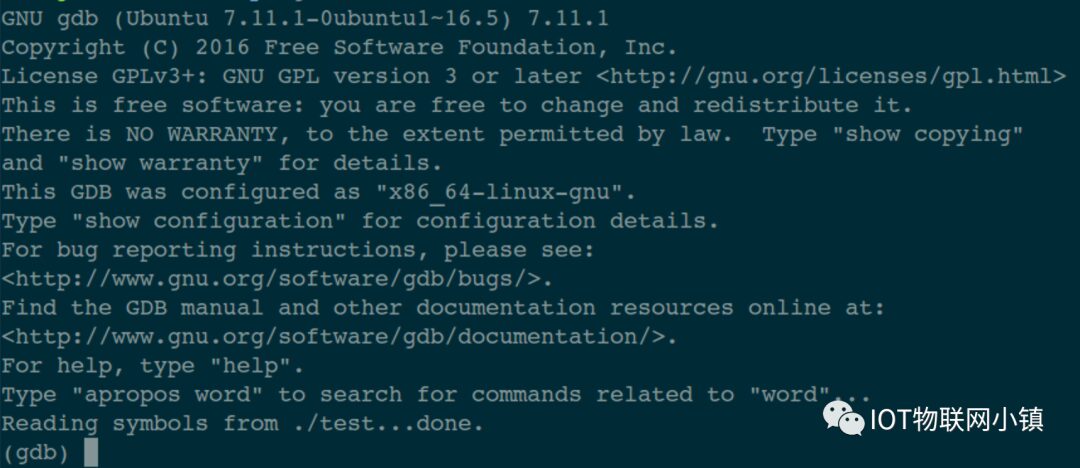
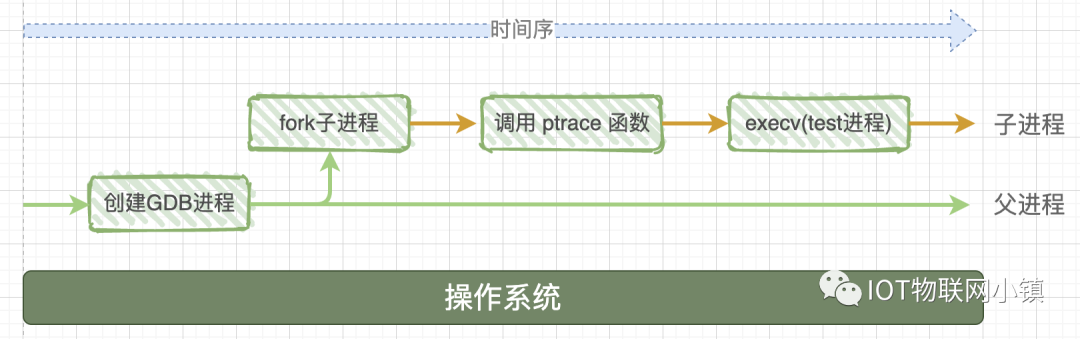
In the last line, you can see the cursor blinking, which indicates that the gdb program is waiting for us to issue debugging commands. When the dark terminal window above executes gdb ./test , many complex things happen in the operating system.
The operating system first starts the gdb process, which calls the system function fork() to create a child process, and this child process does two things:
(1) Calls the system function ptrace(PTRACE_TRACEME, [other parameters]);
(2) Loads and executes the executable program test through execc, so the test program starts executing in this child process.
To add a note: sometimes the text refers to a program, and sometimes it refers to a process. “Program” describes a static concept, which is a bunch of data lying on the hard disk, while “process” describes a dynamic process, which is the program being read and loaded into memory, having a task control block (a data structure) in the operating system specifically for managing this process.
After all this groundwork, the main character finally makes an appearance, which is the system call function ptrace (the parameters will be explained later). It is with its help that gdb has powerful debugging capabilities. The function prototype is:

Let’s first look at the introduction of this function in the man page:
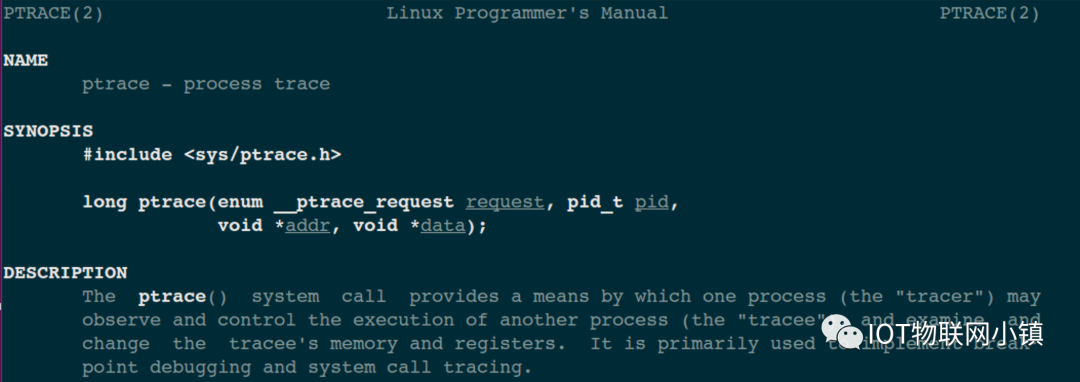
tracer is the debugging program, which can be understood as the gdb program; tracee is the program being debugged, corresponding to the target program test in the diagram. Foreigners generally like to use -er and -ee to represent active and passive relationships, for example: employer is the boss, employee is the poor hired worker.
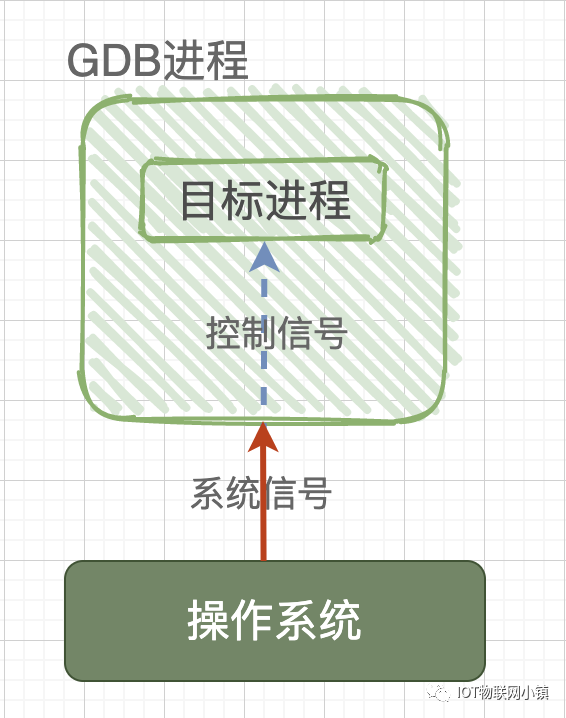
The ptrace system function is a system call provided by the Linux kernel for process tracing. Through it, one process (gdb) can read and write the instruction space, data space, stack, and register values of another process (test). Moreover, the gdb process takes over all signals from the test process, meaning that all signals sent by the system to the test process are received by the gdb process. This way, the execution of the test process is controlled by gdb, achieving the purpose of debugging.
This is equivalent to the following situation: if there is no gdb debugging, the operating system directly interacts with the target process; if gdb is used to debug the program, then the signals sent by the operating system to the target process will be intercepted by gdb, and gdb decides whether to pass the currently intercepted signal to the test process based on the properties of the signal, allowing the debugged program test to perform corresponding actions under the command of gdb.
How GDB Debugs Already Running Service Processes
Some friends may raise the question: the program test being debugged starts executing from the beginning; can gdb debug a service process that is already running? The answer is: yes. This involves the first parameter of the ptrace system function, which is an enumerated type value, two of which are important: PTRACE_TRACEME, PTRACE_ATTACH.
In the explanation above, the child process calls the ptrace system function using the parameter PTRACE_TRACEME. Note the orange text: it is the child process calling ptrace, which is equivalent to the child process telling the operating system: the gdb process is my parent, so any signals you want to send to me in the future, please send them directly to the gdb process!
If you want to debug an already running process B, then you need to call ptrace(PTRACE_ATTACH, [other parameters]) in the gdb parent process. At this point, the gdb process will attach to the already running process B, adopting process B as its child process, and the behavior of child process B is equivalent to it performing a PTRACE_TRACEME operation. At this point, the gdb process will send a SIGSTOP signal to child process B, and upon receiving the SIGSTOP signal, child process B will pause execution and enter the TASK_STOPPED state, indicating that it is ready to be debugged.
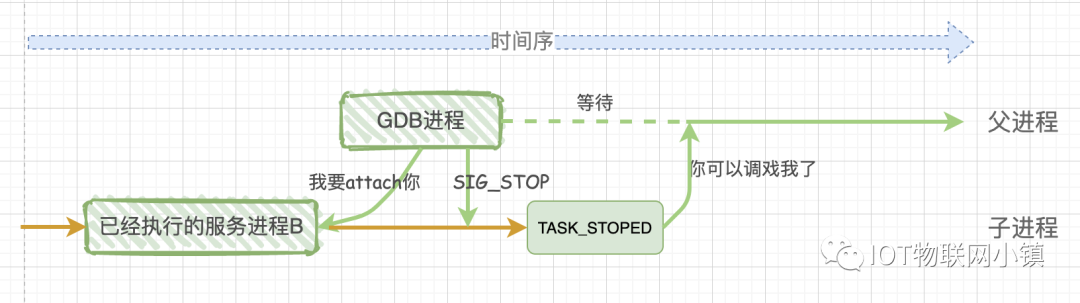
Therefore, whether debugging a new program or an already running service program, through the ptrace system call, the final result is:the gdb program is the parent process, and the debugged program is the child process. All signals from the child process are intercepted by the parent process gdb, and the parent process gdb can view and modify the internal information of the child process, including the stack and registers.
Regarding binding, there are a few restrictions to be aware of: self-binding is not allowed, multiple bindings to the same process are not allowed, and binding to process 1 is not allowed.

Peeking into How GDB Implements Breakpoint Instructions
The grand principles have been explained, and here we will peek into gdb’s internal debugging mechanism through the set breakpoint (break) debugging command.
Using the above code as an example, let’s repost the code:
Let’s take a look at what the compiled disassembled code looks like (compile command: gcc -S test.c; cat test.S)
Only a portion of the disassembled code is posted here; as long as it explains the underlying principles, it achieves our purpose.
As mentioned earlier, after executing gdb ./test, gdb will fork a child process. This child process first calls ptrace, then executes the test program, thus gdb becomes the parent process of test, allowing it to take over all signals from test.
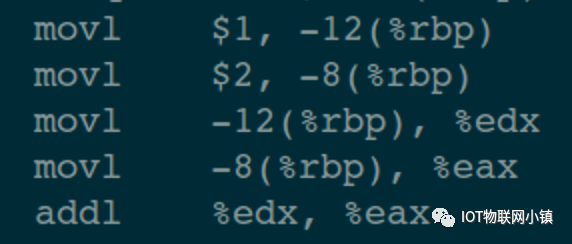
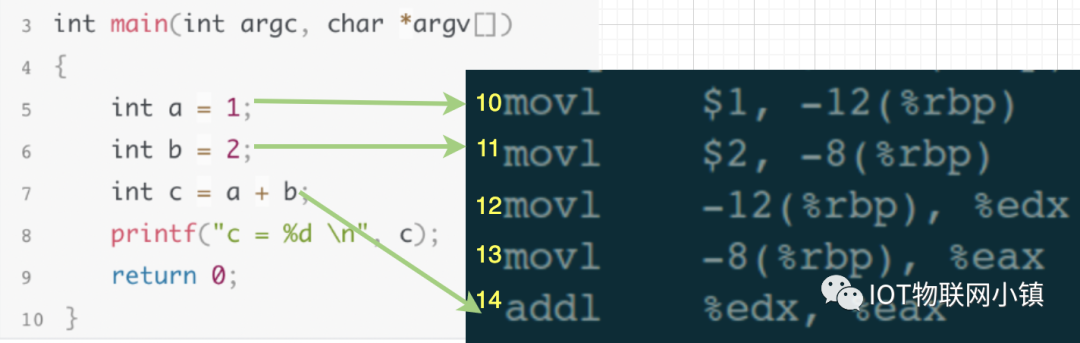
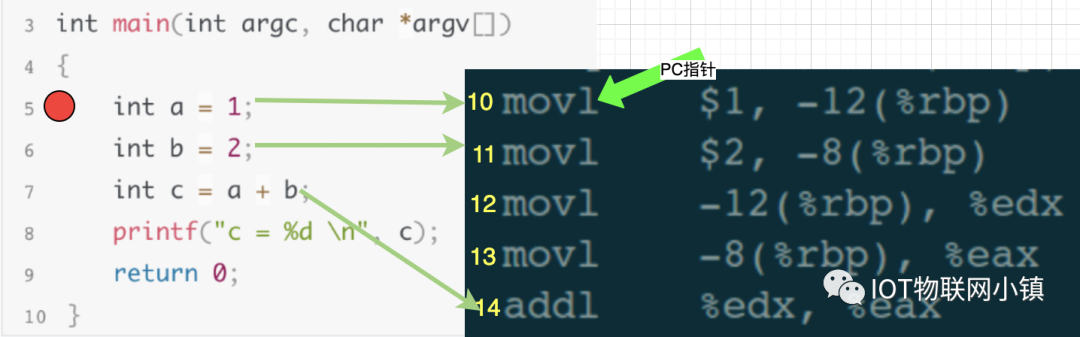
We will place the source code and assembly code together for easier understanding:
Now we enter the debugging command: in the debugging window, enter the set breakpoint command “break 5” and gdb does two things:
(1) Stores the assembly code corresponding to the 5th line of source code in the breakpoint list.
(2) Inserts the interrupt instruction INT 3 into the 10th line of assembly code, meaning that the 10th line of assembly code is replaced by INT3.
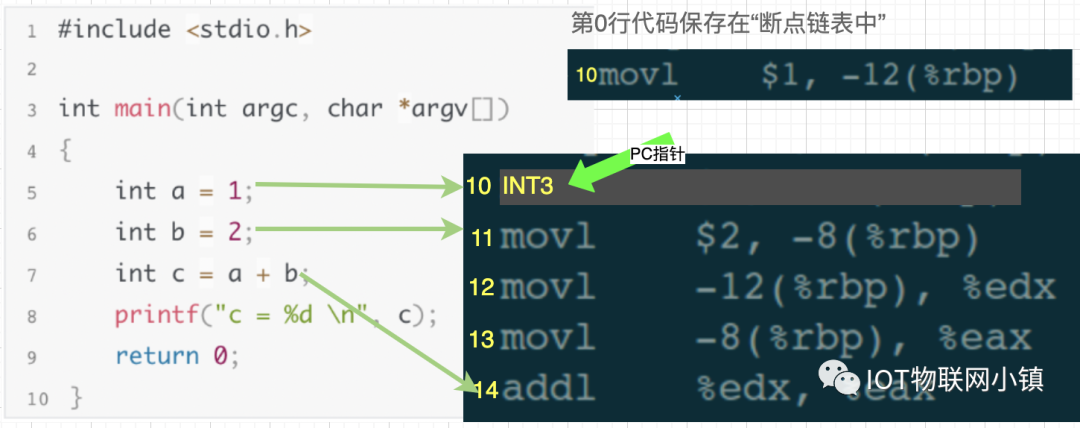
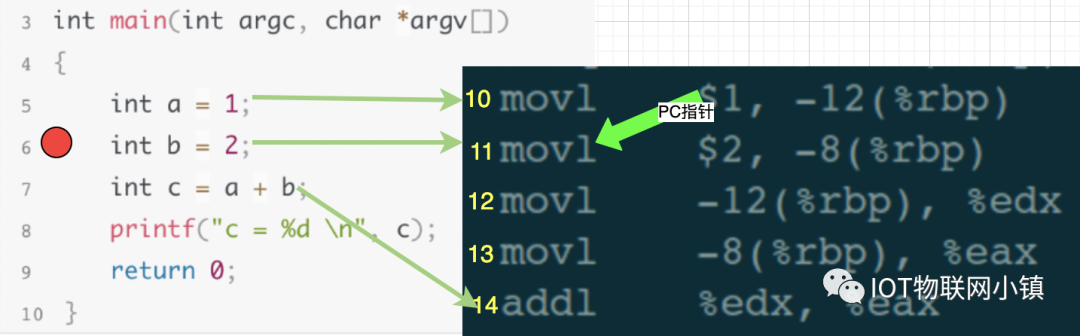
Then, continue to enter the execution command in the debugging window“run” (execute continuously until encountering a breakpoint and pause), when the PC pointer (an internal pointer pointing to the line of code to be executed) executes to the 10th line of assembly code, it finds the INT 3 instruction, and the operating system sends a SIGTRAP signal to the test process.
(At this moment, the 10th line of assembly code INT3 has been executed, and the PC pointer points to the 11th line.)
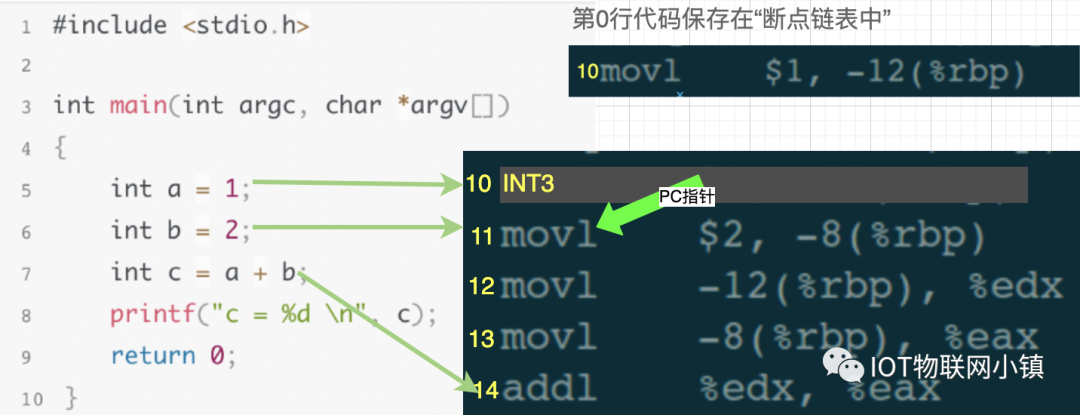
As mentioned earlier, any signals sent to the test process by the operating system are intercepted by gdb, meaning that gdb will receive this signal first. gdb discovers that the current assembly code is executing the 10th line, so it checks the breakpoint list and finds that the 10th line of code has a breakpoint set, at this moment, gdb performs three operations:
(1) Replaces the 10th line of assembly code INT3 with the original code in the breakpoint list.
(2) Moves the PC pointer back one step, setting it to point to the 10th line.
(3) Continues to wait for user debugging commands.
At this moment, the test program has paused, and the PC pointer points to the 10th line, which is the breakpoint in the 5th line of source code. From our perspective as debuggers, the debugged program has paused at the breakpoint on line 5, allowing us to continue entering other debugging commands to debug, such as viewing variable values, checking stack information, modifying local variable values, etc.
Peeking into How GDB Implements Step Instruction Next
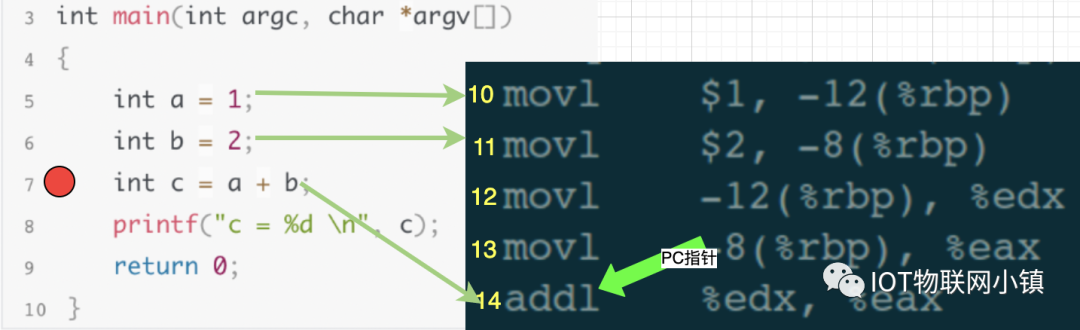
Using the previous source code and assembly code as an example, suppose the program is currently paused at the 6th line of source code, which is the 11th line of assembly code:
In the debugging window, enter the step execution command“next”, our goal is to execute one line of code, meaning to finish executing the 6th line of code in the source code and then pause at the 7th line. When gdb receives the “next” execution command, it calculates that the 7th line of source code corresponds to the 14th line of assembly code. Thus, gdb controls the PC pointer to execute until the end of the 13th line, meaning it stops when the PC points to the 14th line, and then continues to wait for user input debugging commands.
Summary
Through the break and next debugging commands, we have understood how gdb handles debugging commands. Of course, there are many more debugging commands in gdb, including more complex commands for obtaining stack information, modifying variable values, etc. Interested friends can continue to explore.
In the future, when I write about the debugging library in the LUA language, I will discuss this issue in greater depth and detail, as the LUA language is more compact and simpler. I will also demonstrate the part of the LUA code that sets the PC pointer, so we can better understand and master the internal implementation of a programming language, and I may even record a video to better explain the internal details in LUA.
———— END ————
●Column “Embedded Tools”
●Column “Embedded Development”
●Column “Keil Tutorial”
●Selected Tutorials from the Embedded Column
Follow the public account reply “join group” to join the technical exchange group according to the rules, reply “1024” to see more content.
Click “Read Original” to see more shares.