<span>top</span> is a very powerful real-time system monitoring tool in Linux that allows you to dynamically view the system’s operating status, including the usage of resources such as CPU, memory, and processes.
1. Starting top
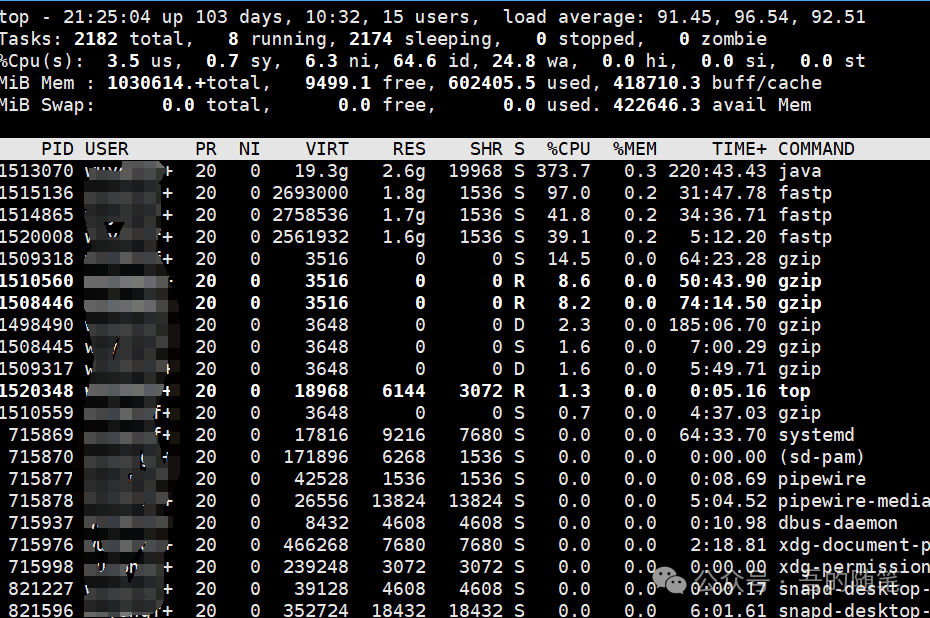
To start top, simply enter the following command in the terminal:
top2. Overview of the top Interface
The top interface is divided into two parts:
-
System Overview Area (Top):
-
Displays the overall status of the system, including uptime, number of users, load, tasks, CPU, memory, etc.
Process List Area (Bottom):
-
Displays detailed information about each process, sorted by CPU usage by default.
3. Analysis of the System Overview Area
3.1 First Line: System Uptime and Load
Example:
-
top - 14:32:01 up 10 days, 2:15, 3 users, load average: 0.15, 0.10, 0.05
-
Analysis:
-
Load value indicates the number of tasks waiting for CPU. If the load value is close to or exceeds the number of CPU cores, it indicates high system load.
-
14:32:01: Current time. -
up 10 days, 2:15: System uptime. -
3 users: Current number of logged-in users. -
load average: 0.15, 0.10, 0.05: System load (average values over 1 minute, 5 minutes, and 15 minutes).
3.2 Second Line: Task Status
-
Example:
-
Tasks: 123 total, 1 running, 122 sleeping, 0 stopped, 0 zombie
-
Analysis:
-
123 total: Total number of tasks. -
1 running: Number of tasks currently running. -
122 sleeping: Number of sleeping tasks. -
0 stopped: Number of stopped tasks. -
0 zombie: Number of zombie processes.3.3 Third Line: CPU Usage
-
Example:
%Cpu(s): 1.5 us, 0.5 sy, 0.0 ni, 97.5 id, 0.5 wa, 0.0 hi, 0.0 si, 0.0 st-
Analysis:
-
us: Percentage of CPU used by user space (running user processes). -
sy: Percentage of CPU used by kernel space (running system processes). -
ni: Percentage of CPU used by user processes with adjusted priority. -
id: Percentage of idle CPU. -
wa: Percentage of CPU waiting for I/O operations. -
hi: Percentage of CPU used by hardware interrupts. -
si: Percentage of CPU used by software interrupts. -
st: Percentage of CPU stolen by the virtual machine.
3.4 Fourth Line: Memory Usage
-
Example:
-
MiB Mem : 16000.0 total, 2000.0 free, 5000.0 used, 9000.0 buff/cache
-
Analysis:
-
total: Total memory. -
free: Free memory. -
used: Used memory. -
buff/cache: Memory used for caching and buffering.
3.5 Fifth Line: Swap Space Usage
-
Example:
-
MiB Swap: 2000.0 total, 1500.0 free, 500.0 used. 11000.0 avail Mem
-
Analysis:
-
total: Total swap space. -
free: Free swap space. -
used: Used swap space. -
avail Mem: Available memory.
4. Analysis of the Process List Area
4.1 Default Columns
-
PID: Process ID.
-
USER: Process owner.
-
PR: Process priority.
-
NI: Nice value of the process (priority adjustment value).
-
VIRT: Total virtual memory used by the process (including swap space).
-
RES: Size of physical memory used by the process.
-
SHR: Size of shared memory used by the process.
-
S: Process status (
R=running,S=sleeping,Z=zombie). -
%CPU: Percentage of CPU used by the process.
-
%MEM: Percentage of memory used by the process.
-
TIME+: Total CPU time used by the process.
-
COMMAND: Command name of the process.
4.2 Sorting
-
By default, sorted by
%CPU. -
Sort by
Mfor memory usage. -
Sort by
Pfor CPU usage. -
Sort by
Tfor uptime.
5. Common Shortcuts
-
k: Terminate a process. Enter PID and press enter. -
r: Adjust process priority (nice value). -
h: Display help information. -
q: Exittop. -
f: Enter field management interface to select displayed columns. -
1: Display usage for each CPU core. -
z: Toggle color display. -
W: Save current configuration to~/.toprcfile. -
u: Display processes for a specific user. Enter username and press enter.Introduction to top shortcuts
1. Global Shortcuts
-
h: Display help information. -
q: Exittop. -
z: Toggle color display. -
W: Save current configuration to~/.toprcfile (this configuration will load next timetopstarts). -
E: Toggle memory unit in the overview area (KiB/MiB/GiB/TiB). -
e: Toggle memory unit in the process list area (KiB/MiB/GiB/TiB). -
l: Show or hide system uptime and load information. -
t: Show or hide task and CPU state information. -
m: Show or hide memory and swap space information. -
1: Show usage for each CPU core (toggle between single-core/multi-core view).2. Process Sorting
-
P: Sort by CPU usage (default). -
M: Sort by memory usage. -
T: Sort by uptime. -
N: Sort by PID. -
<: Sort by the left column. -
>: Sort by the right column.
3. Process Operations
-
k: Terminate a process. Enter PID and press enter. -
r: Adjust the priority of a process (nice value). Enter PID and press enter, then enter nice value (-20 to 19). -
c: Display the full command path. -
i: Ignore idle processes (only show active processes). -
u: Display processes for a specific user. Enter username and press enter.
4. Display Column Management
-
f: Enter field management interface to select displayed columns. -
Press
dor spacebar to toggle the display status of columns. -
Press
sto set the sorting field. -
Press
qto exit the field management interface. -
F: Select sorting field (similar tof, but directly enters sorting field selection).
5. Refresh and Delay
-
s: Set refresh interval (seconds). Enter time and press enter. -
d: Set refresh interval (seconds). Enter time and press enter. -
Space: Immediately refresh the interface.
6. Other Shortcuts
-
x: Highlight the sorting field. -
y: Highlight running processes. -
b: Toggle bold display. -
V: Switch to tree view (show parent-child relationship of processes). -
H: Show or hide threads (toggle process/thread view). -
Z: Change color configuration.