Professor Patrick Schober from the Department of Anesthesiology at Amsterdam University Medical Center published a paper titled “Statistics From A (Agreement) to Z (z Score): A Guide to Interpreting Common Measures of Association, Agreement, Diagnostic Accuracy, Effect Size, Heterogeneity, and Reliability in Medical Research”, which introduces the thresholds for various common statistical indicators and suggests providing simple and understandable explanations for some commonly used statistical indicators in medical research. I will continue to introduce them one by one.

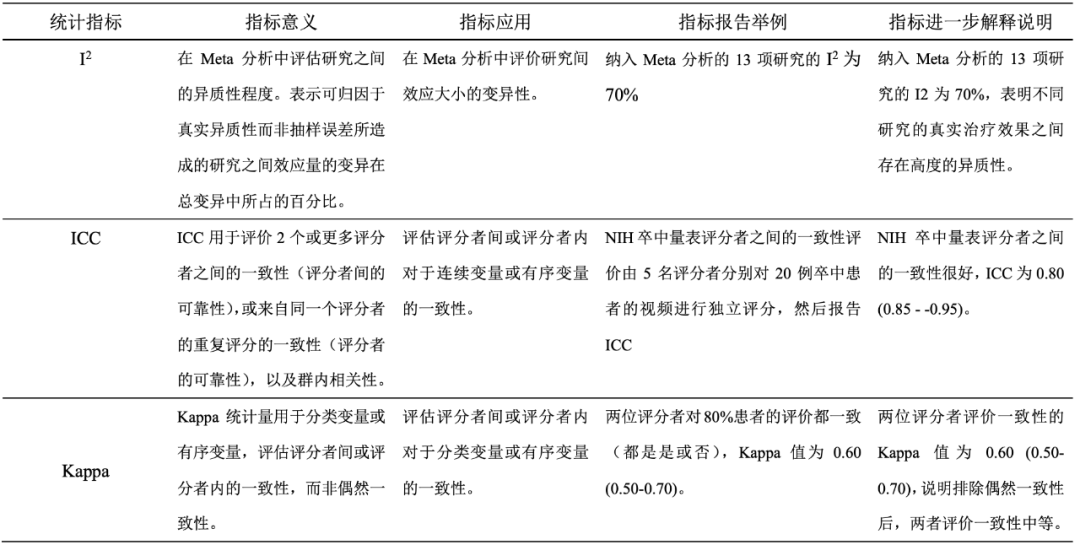
In meta-analysis, the variation in effect sizes observed between included studies is due to random sampling error on one hand and true variation in effect size on the other. The true variation in effect size between studies is referred to as heterogeneity. The I2 statistic is typically reported to quantify this heterogeneity.
I2 represents the percentage of variation in effect sizes between studies that can be attributed to heterogeneity rather than sampling error.Compared to the classical measure of consistency—Cochran’s Q, I2 is considered a better assessment metric because it does not depend on the number of studies included.
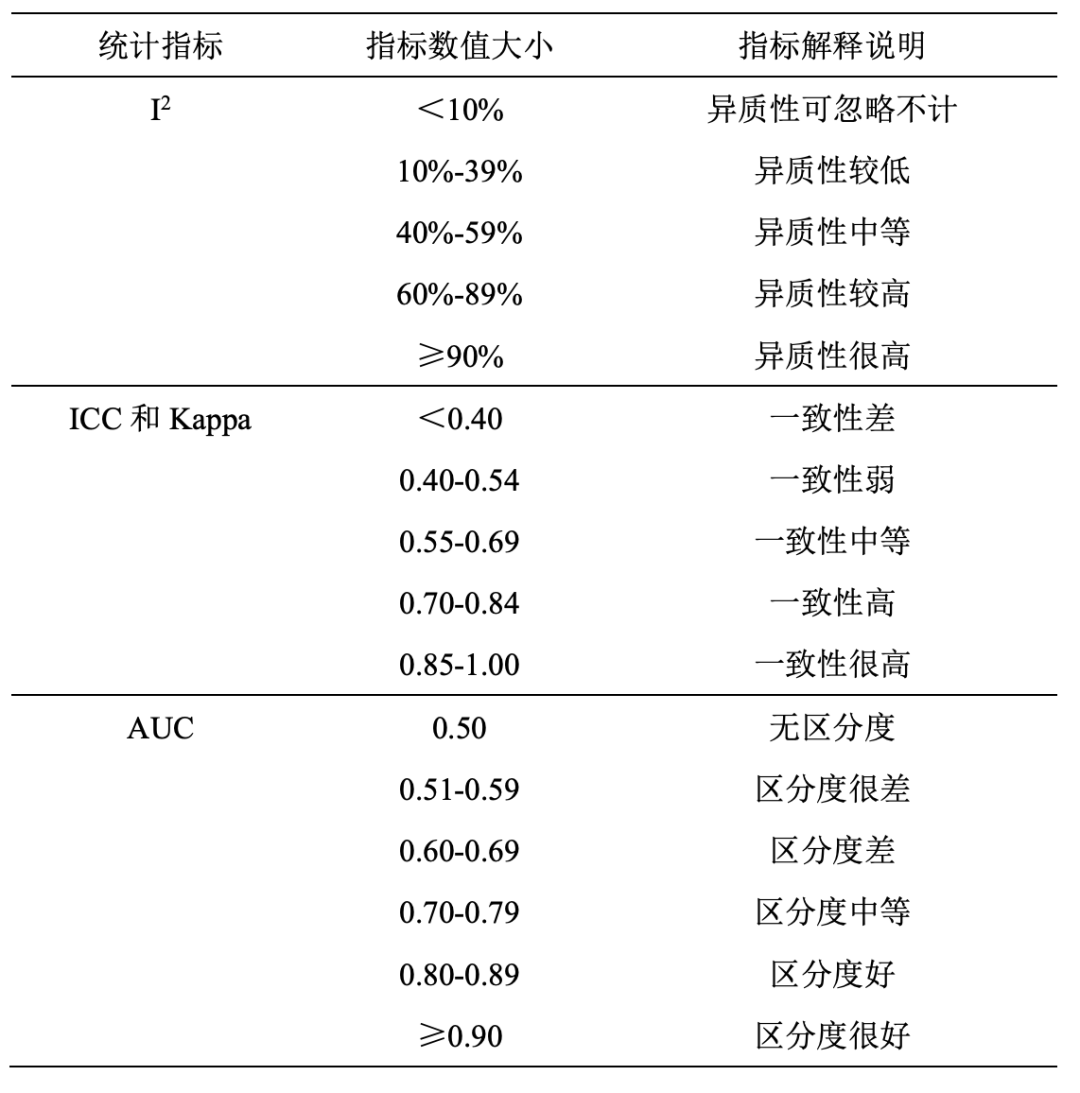
Since I2 is a percentage, it is a relative measure of heterogeneity and cannot quantify the absolute size of effect size variation in studies. The range of I2 is from 0% to 100%. Some scholars categorize I2 into low, moderate, and high heterogeneity at thresholds of 25%, 50%, and 75%, respectively, as shown in Table 1 at the end of the text.
When assessing consistency of quantitative data from the same measurement or measurement tool, such as inter-rater or intra-rater reliability of a scoring scale, the Intraclass Correlation Coefficient (ICC) is commonly used.
There are at least 10 types of ICC, and the choice of the most appropriate ICC depends on several factors, including whether all evaluations are performed by the same rater or different raters; whether the raters are considered a random sample; whether the focus is on individual ratings or average ratings; and whether absolute consistency is being assessed.
ICC coefficients typically range from 0 to 1, which can be interpreted as the proportion of variance between subjects (or raters) in the total variance. Since the weighted kappa statistic is a special case of ICC, ICC and Kappa statistics can be interpreted using similar thresholds, as shown in Table 1.
Receiver Operating Characteristic (ROC) analysis is commonly used to assess the accuracy of diagnostic tests. In diagnostic tests, subjects are classified as positive (disease) or negative (healthy) based on observations of a certain biomarker.
Broadly speaking, ROC analysis can be used to evaluate the predictive performance of statistical models to predict binary outcomes, such as logistic regression models.
The Y-axis of the ROC curve represents the true positive rate (sensitivity), while the X-axis represents the false positive rate (1-specificity), and the curve is plotted by measuring different observation cut-off values of a continuous variable.
The area under the ROC curve (AUC), also known as the c-statistic, is mainly used to evaluate the accuracy of diagnostic tests or the accuracy of predictions made by binary regression models.
An AUC of +1 indicates perfect accuracy, 0.5 corresponds to random classification (for example, flipping a coin to classify patients as healthy or diseased), and if AUC < 0.5, it suggests accuracy worse than chance.