Click the blue 'Arm Selected' at the top left and select 'Set as Star'.
The Performance Monitoring Unit (PMU) in the Armv8-A CPU provides hardware-level performance monitoring and analysis capabilities. The PMU collects hardware event counts through counters. The counters include cycle counters and event counters. You can configure:
-
5 event counters to count specified hardware events.
-
Each counter to collect hardware events from workloads at different CPU exception levels and states.
Tools like perf use the PMU to analyze Linux applications running on the Armv8-A CPU. However, there is no common method to analyze firmware using the PMU since it runs in a bare-metal environment.
A simple way to use the PMU to analyze firmware is to add PMU support as a library. In this blog post, we provide a PMU library as a reference implementation. The library has been validated on platforms based on the Armv8.0-A CPU. We also discuss how to add PMU support to firmware and use the PMU to analyze firmware. Trusted Firmware-A (TF-A) and U-Boot are used as example firmware.
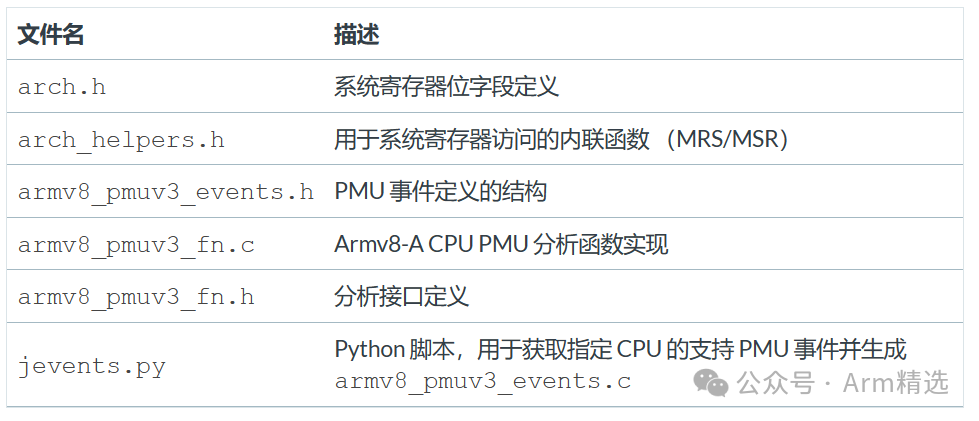
The table below lists the components of the PMU library.
 Phase 1: Add PMU Support to Firmware
Unzip all files of the PMU library into the path in the firmware using the following command.
unzip armv8_pmuv3_library.zip -d ${FIRMWARE_PATH}/lib/pmuDepending on the firmware you are using, you will need to make specific changes to the files as follows.

TF-A Type
Modify the existing Makefile located in the TF-A root path as follows.
BL_COMMON_SOURCES += lib/pmu/armv8_pmuv3_fn.c lib/pmu/armv8_pmuv3_events.cINCLUDES += -Ilib/pFull Screen
U-Boot
Modify the existing files in the U-Boot root directory as follows.Makefile
UBOOTINCLUDE += -Ilib/pmuCreate a file in the same directory as the PMU library.Fill the file as follows.Makefile
obj-y += armv8_pmuv3_fn.o armv8_pmuv3_events.o<span>Now, you can rebuild the firmware. If it builds successfully, proceed to Phase 2.</span>
Phase 2: Select PMU Events to Analyze
First, obtain the supported PMU events of the Armv8-A CPU running the firmware. For PMU events, refer to the CPU Technical Reference Manual (TRM).
You can also use a Python script named in the PMU library along with the following steps. jevents.py
Get Supported PMU Events for a Specified CPU
The GitHub repository maintains machine-readable data for each Arm CPU’s supported PMU events. It uses JSON format to store information like event mnemonics and event numbers of PMU events. This information is consistent with the information in the CPU TRM.
The Python script named in the PMU library clones the repository, converts the JSON format to C format, and generates a file named . You can use it as follows. jevents.pyarmv8_pmuv3_events.c
First, use the following command to list all names of the supported CPUs.
python3 jevents.py --listThen, use the following command to specify the name of the CPU to convert. This command will generate a file named armv8_pmuv3_events.c which contains two types of arrays. One is for the supported PMU events of the specified CPU. The other is for the selected PMU events for analysis.
python3 jevents.py --cpu <cpu name>The armv8_pmuv3_events.c file generated by jevents.py is shown below. We specified the cpu name as c. The array named pmu_events_map contains all supported PMU events for the Cortex-A53. The same applies to the Cortex-A53 TRM. You can select PMU events from here and place the selected events into an array named evt_select.ortex-a53
#include "armv8_pmuv3_events.h"
/* Selected PMU Events Table */struct pmu_event_selected evt_select[] = {    { .event.name = "INST_RETIRED", .event.number = 0x08 },    { .event.name = "CYCLES", .event.number = CYCLE_COUNTER_EVENT },     /* Always place the following one at the end of the table */    { .event.name = "NULL", .event.number = PMU_SELECTED_END } };
/* PMU Events Mapping Table */const struct pmu_event pmu_events_map[] = {    /* Supporting PMU events for event counter */     { .name = "SW_INCR", .number = 0x0 },    { .name = "L1I_CACHE_REFILL", .number = 0x1 },    { .name = "L1I_TLB_REFILL", .number = 0x2 },    { .name = "L1D_CACHE_REFILL", .number = 0x3 },    { .name = "L1D_CACHE", .number = 0x4 },    { .name = "L1D_TLB_REFILL", .number = 0x5 },    { .name = "LD_RETIRED", .number = 0x6 },    { .name = "ST_RETIRED", .number = 0x7 },    { .name = "INST_RETIRED", .number = 0x8 },    { .name = "EXC_TAKEN", .number = 0x9 },    { .name = "EXC_RETURN", .number = 0xa },    { .name = "CID_WRITE_RETIRED", .number = 0xb },    { .name = "PC_WRITE_RETIRED", .number = 0xc },    { .name = "BR_IMMED_RETIRED", .number = 0xd },    { .name = "BR_RETURN_RETIRED", .number = 0xe },    { .name = "UNALIGNED_LDST_RETIRED", .number = 0xf },    { .name = "BR_MIS_PRED", .number = 0x10 },    { .name = "CPU_CYCLES", .number = 0x11 },    { .name = "BR_PRED", .number = 0x12 },    { .name = "MEM_ACCESS", .number = 0x13 },    { .name = "L1I_CACHE", .number = 0x14 },    { .name = "L1D_CACHE_WB", .number = 0x15 },    { .name = "L2D_CACHE", .number = 0x16 },    { .name = "L2D_CACHE_REFILL", .number = 0x17 },    { .name = "L2D_CACHE_WB", .number = 0x18 },    { .name = "BUS_ACCESS", .number = 0x19 },    { .name = "MEMORY_ERROR", .number = 0x1a },    { .name = "BUS_CYCLES", .number = 0x1d },    { .name = "CHAIN", .number = 0x1e },    { .name = "BUS_ACCESS_RD", .number = 0x60 },    { .name = "BUS_ACCESS_WR", .number = 0x61 },    { .name = "BR_INDIRECT_SPEC", .number = 0x7a },    { .name = "EXC_IRQ", .number = 0x86 },    { .name = "EXC_FIQ", .number = 0x87 },    { .name = "0xc0", .number = 0xc0 },    { .name = "0xc1", .number = 0xc1 },    { .name = "0xc2", .number = 0xc2 },    { .name = "0xc3", .number = 0xc3 },    { .name = "0xc4", .number = 0xc4 },    { .name = "0xc5", .number = 0xc5 },    { .name = "0xc6", .number = 0xc6 },    { .name = "0xc7", .number = 0xc7 },    { .name = "0xc8", .number = 0xc8 },    { .name = "0xc9", .number = 0xc9 },    { .name = "0xca", .number = 0xca },    { .name = "0xcb", .number = 0xcb },    { .name = "0xcc", .number = 0xcc },    { .name = "0xd0", .number = 0xd0 },    { .name = "0xd1", .number = 0xd1 },    { .name = "0xd2", .number = 0xd2 },    { .name = "0xe0", .number = 0xe0 },    { .name = "0xe1", .number = 0xe1 },    { .name = "0xe2", .number = 0xe2 },    { .name = "0xe3", .number = 0xe3 },    { .name = "0xe4", .number = 0xe4 },    { .name = "0xe5", .number = 0xe5 },    { .name = "0xe6", .number = 0xe6 },    { .name = "0xe7", .number = 0xe7 },    { .name = "0xe8", .number = 0xe8 },    /* Supporting event for cycle counter */     { .name = "CYCLES", .number = CYCLE_COUNTER_EVENT } };
Select PMU Events to Analyze
In initial performance analysis, it is often necessary to select various PMU events. This will give you a comprehensive understanding of the code to be analyzed.
For the Armv8-A CPU, the available event counters for each CPU are limited. You can refer to the CPU TRM for that number. If the number of PMU events required exceeds the available counters, you can use the following method.
-
Group all PMU events to be selected. The number of events in each group must not exceed the available counters of the PMU.
-
Create multiple structure arrays and place each group into one array.
pmu_event_selected -
Analyze the same code multiple times, selecting one array at a time, and repeat the process until all events are measured.
For example, we created two structure arrays named and in the .c file. For the Cortex-A53, 1 cycle counter and 6 event counters are provided. The number of PMU events in each array does not exceed this value. Moreover, in each array, the PMU events are relevant to ensure that the analysis data is comparable. pmu_event_selectedevt_select_cacheevt_select_wlcarmv8_pmuv3_events
We use these two arrays in the following analysis examples.
/* PMU events for data access */struct pmu_event_selected evt_select_cache[] = {    { .event.name = "L1D_TLB_REFILL", .event.number = 0x5 },    { .event.name = "L1D_CACHE_REFILL", .event.number = 0x3 },    { .event.name = "L1D_CACHE", .event.number = 0x4 },    { .event.name = "L2D_CACHE_REFILL", .event.number = 0x17 },    { .event.name = "L2D_CACHE", .event.number = 0x16 },    { .event.name = "CYCLES", .event.number = CYCLE_COUNTER_EVENT },     /* Always place the following one at the end of the table */    { .event.name = "NULL", .event.number = PMU_SELECTED_END } };
/* PMU events for workload characterization */struct pmu_event_selected evt_select_wlc[] = {    { .event.name = "LD_RETIRED", .event.number = 0x6 },    { .event.name = "ST_RETIRED", .event.number = 0x7 },    { .event.name = "MEM_ACCESS", .event.number = 0x4 },    { .event.name = "BR_IMMED_RETIRED", .event.number = 0xd },    { .event.name = "BR_RETURN_RETIRED", .event.number = 0xe },    { .event.name = "CYCLES", .event.number = CYCLE_COUNTER_EVENT },     /* Always place the following one at the end of table */    { .event.name = "NULL", .event.number = PMU_SELECTED_END } };
Phase 3: Analyze Firmware Using PMU
Now, you can use the PMU to analyze the firmware. Use the following procedure for specific code in the firmware to be analyzed.
-
Place a start analysis point before the code. This will configure, enable the current value of each PMU counter, and read it as a pre-analysis value.
-
Place a stop analysis point after the code. This will disable each PMU counter value and read it as an analysis post value.
-
Rebuild the firmware and run the code again. Compute the difference between the pre-analysis value and the post-analysis value for each PMU counter. This will collect statistical analysis results.
A reference implementation is provided in the PMU library. armv8_pmuv3_fn.c
Place Performance Analysis Points in Firmware
Simply add two functions named and between the code you want to analyze. For each performance analysis, pass a structure array as a parameter. pmuv3_startProfilingpmuv3_stopProfilingpmu_event_selected
Depending on the number of PMU events to be analyzed, you may need to analyze once or multiple times. Here are two analysis examples.
Example 1
To analyze a function in TF-A and focus on cache behavior, you can only select an array named for a single performance analysis. enable_mmu_el3evt_select_cache
#include <armv8_pmuv3_fn.h>
extern struct pmu_event_selected evt_select_cache[];
void __init arm_bl31_plat_arch_setup(void){    //...
  pmuv3_startProfiling(evt_select_cache);    enable_mmu_el3(0);    pmuv3_stopProfiling(evt_select_cache);
    //...}
Full Screen
Example 2
To understand workload characteristics in U-Boot, you can select arrays named and . Thus, you need to analyze the same code multiple times to collect all analysis data. crc32evt_select_cacheevt_select_wlc
Since the function is invoked by command, you can program the firmware once and repeat the analysis by entering the same command multiple times. do_mem_crc
#include <armv8_pmuv3_fn.h>
extern struct pmu_event_selected evt_select_cache[];
extern struct pmu_event_selected evt_select_wlc[];
struct pmu_event_selected* pevt[] = {evt_select_cache,evt_select_wlc,NULL};
struct pmu_event_selected** p = pevt;
static int do_mem_crc(struct cmd_tbl *cmdtp, int flag, int argc,          char *const argv[]){  int ret = 0;
    // ...
    if(*p!=NULL) {        pmuv3_startProfiling(*p);    } else {        p = pevt;    }
    ret = hash_command("crc32", flags, cmdtp, flag, ac, av);        if(*p!=NULL) {        pmuv3_stopProfiling(*p);        ++p;    }
  return ret;}
Full Screen
Understand the Implementation of Analysis Using PMU
The function performs the following actions. startProfiling
-
Perform necessary initialization for the PMU. It checks whether the number of event counters supported by the CPU’s PMU fits the selected events. Then, it sets or to enable PMU analysis at the current exception level. This is because firmware typically runs in EL2/EL3 or in a secure state that prohibits analysis to prevent information leakage.
MDCR_EL2MDCR_EL3 -
Configure each PMU counter to analyze at the current exception level and the selected PMU events.
-
Enable each PMU counter.
-
Read the current value of each PMU counter as a pre-analysis value.
The function performs the following actions. stopProfiling
-
Disable each PMU counter.
-
Read the current value of each PMU counter as an analysis post value.
-
Dump the results of this analysis.
-
Perform necessary de-initialization for the PMU. This will disable the PMU working in EL2/EL3 or secure state.
Collect Statistical Analysis Results
Now, you can rebuild the firmware and run it again to collect statistical analysis results.
For the examples mentioned in the previous section, we performed the analysis on the Juno r2 platform. The output of the analysis is shown below.
Example 1
************************************************************ [armv8_pmuv3] Profiling Result************************************************************PMU EVENT, PREVAL, POSTVAL, DELTAL1D_TLB_REFILL,0,2,2L1D_CACHE_REFILL,0,8,8L1D_CACHE,0,6,6L2D_CACHE_REFILL,0,10,10L2D_CACHE,0,10,10CYCLES,1386,4293,2907***********************************************************As can be seen from the output, it records the pre-performance analysis and post-performance analysis values of each selected PMU event and cycles in this performance analysis. In addition, it also calculates the differences and logs them in a column named DELTA.
For the Cortex-A53 CPU, PMU events are included in the count of . Therefore, you may observe that the count value of is greater than the count value of .L1D_TLB_REFILLL1D_CACHE_REFILLL1D_CACHE_REFILLL1D_CACHE
Example 2
CRC32 for 80000100 ... 80001123 ==> c3ac0b65************************************************************ [armv8_pmuv3] Profiling Result************************************************************PMU EVENT, PREVAL, POSTVAL, DELTAL1D_TLB_REFILL,0,0,0L1D_CACHE_REFILL,0,19,19L1D_CACHE,11,80424,80413L2D_CACHE_REFILL,0,80,80L2D_CACHE,0,212,212CYCLES,147,884986,884839************************************************************As mentioned above, the results of the two performance analysis sessions are almost the same. cycles
From the first performance analysis result, you can refer to the Arm Architecture Reference Manual to abstract some meaningful metrics as follows.


【Store Address】

【Customer Service Consultation】