WeChat public platform followed by tens of thousands of nuclear medicine professionals


18F-FDG PET Reveals the Truth Behind Alzheimer’s Disease in Patients with Memory Impairment
Currently, the diagnosis of Alzheimer’s Disease (AD) still faces many challenges, especially in patients initially diagnosed with memory impairment, where accurately distinguishing AD from other types of dementia is particularly important. In recent years, 18F-FDG PET, as an advanced molecular imaging technology, has emerged in AD-related research. This article uses the molecular imaging ATN diagnostic framework as the standard for judging AD, and deeply evaluates the efficacy of 18F-FDG PET imaging in diagnosing AD in patients initially diagnosed with memory impairment, thus providing strong support for the early diagnosis and treatment of AD.

Citation: Zhang Yan, Zhang Chenpeng, Huang Gan, et al. 18F-FDG PET in Diagnosing Alzheimer’s Disease in Patients with Memory Impairment [J]. Chinese Journal of Nuclear Medicine and Molecular Imaging, 2024, 44(12): 712-717. DOI:10.3760/cma.j.cn321828-20240201-00051.
Corresponding Author: Liu Jianjun, Email: [email protected]


Research Background
Alzheimer’s Disease(Alzheimer’s disease, AD) is one of the common neurodegenerative diseases causing cognitive impairment in the elderly. In China, there are 15.07 million individuals over the age of 60 suffering from dementia, among which AD accounts for the largest proportion (about 9.83 million), followed by vascular dementia (VD) and frontotemporal dementia (FTD) [1]. In clinical practice, accurately distinguishing AD from other diseases is crucial. In 2018, the National Institute on Aging and the Alzheimer’s Association (NIA-AA) proposed the amyloid-tau-neurodegeneration (ATN) diagnostic framework: 18F-AV45 is the first β-amyloid PET imaging agent approved by the FDA, which can characterize “A”; “T” can be characterized by the second-generation tau PET imaging agent 18F-PI-2620; MRI or CT showing cortical atrophy, significant hippocampal reduction, or temporal horn enlargement can characterize “N” [1-4].
However, since Aβ PET and tau PET are not yet commercialized in China, the clinical application of the ATN framework for differential diagnosis in suspected AD patients is limited. 18F-FDG PET imaging is currently the most widely used molecular imaging technology in clinical practice. In studies related to AD using FDG PET, subjective scales are often used as the standard for judging AD [5-6]. This study uses the molecular imaging ATN diagnostic framework as the standard for judging AD and evaluates the efficacy of 18F-FDG PET imaging in diagnosing AD in patients initially diagnosed with memory impairment, exploring the application value of 18F-FDG PET imaging in AD patients.
Materials and Methods
1. Study Subjects.This study is a cross-sectional retrospective study. A total of 96 patients with memory impairment who underwent 18F-FDG, 18F-AV45, 18F-PI-2620 PET/CT or PET/MR examinations at Renji Hospital, affiliated with Shanghai Jiao Tong University School of Medicine from August 2019 to September 2023 were collected, including 40 males and 56 females, aged 69.0 (62.8, 74.0) years. Inclusion criteria: (1) Patients presented with cognitive impairment as the main complaint and had memory impairment, underwent clinical physical examination, and were assessed by a neurologist trained in neuropsychological testing, including the Mini-Mental State Examination (MMSE), Montreal Cognitive Assessment (MoCA), and Activities of Daily Living (ADL) scale; (2) Completed the aforementioned imaging examinations. Exclusion criteria: (1) Combined with severe medical diseases (such as heart and lung failure), malignant tumors, and intracranial infectious diseases (such as brain tumors, encephalitis, etc.); (2) Mild cognitive impairment (MCI) or subjective cognitive decline, i.e., the degree of cognitive impairment did not reach AD; (3) At least one imaging result was unclear; (4) Final diagnosis combined with two or more cognitive impairment diseases. Patients were diagnosed by a senior physician at the hospital and reviewed by a senior physician at the hospital. AD diagnostic criteria: (1) Neuropsychological evaluation and MRI or CT examination that meet the AD diagnostic criteria of the “2018 Chinese Guidelines for the Diagnosis and Treatment of Dementia and Cognitive Disorders” [7]; (2) Both 18F-AV45 and 18F-PI-2620 imaging were positive, and MRI or CT showed cortical atrophy, significant hippocampal reduction, or temporal horn enlargement. This study’s 18F-AV45 (Approval No.: 2018-191) and 18F-PI-2620 (Approval No.: 2020-NewTech-004) imaging were approved by the Medical Ethics Committee of Renji Hospital, affiliated with Shanghai Jiao Tong University School of Medicine, and all subjects signed informed consent before the examination.2. Probe Preparation and PET Imaging.18F-FDG, 18F-AV45, and 18F-PI-2620 were prepared by the Department of Nuclear Medicine at Renji Hospital, affiliated with Shanghai Jiao Tong University School of Medicine (18F produced by the Sumitomo HM-10 accelerator in Japan), following good manufacturing practice (GMP) standards and FDA standards for the generation and quality control of imaging agents, with the entire process and quality control being authorized and monitored by Xing Imaging Company in the USA. The examinations were performed using the uEXPLORER PET/CT or uPMR790 PET/MR (both products of Shanghai United Imaging Healthcare Co., Ltd.) imaging devices, 18F-FDG imaging: Patients were intravenously injected with 18F-FDG [(185.0±18.5) MBq], and then waited in a quiet environment for 45-50 minutes before undergoing PET scanning for 10 minutes or longer; 18F-AV45 imaging: The injection dose of the imaging agent was (375.0±37.5) MBq, and after injection, patients waited in a quiet environment for 50 minutes before undergoing PET scanning for 20 minutes or longer; 18F-PI-2620 imaging: The injection dose of the imaging agent was (185.0±18.5) MBq, and after injection, patients waited in a quiet environment for 60 minutes before undergoing PET scanning for 20 minutes or longer. The 18F-FDG, 18F-AV45 PET, and 18F-PI-2620 imaging were spaced more than 1 day and within 2 months apart.3. Imaging Result Determination.Three nuclear medicine physicians independently performed visual diagnosis, and at least two opinions were required for a final diagnosis. (1) 18F-AV45 PET images. Visual assessment used black and white grayscale reading, and images were read in order from the cranial base to the cranial apex (3D localization was performed if necessary). Negative criteria: The brain white matter shows significantly higher physiological uptake than surrounding gray matter, and the boundary between white matter and gray matter is clearly distinguishable; positive criteria: The boundary between white matter and gray matter is unclear (involving at least 2 gyri) or the gray matter imaging agent uptake and distribution are higher than adjacent white matter (involving at least 1 brain region), and confirmation is required on at least 2 adjacent levels [3]. If any cortical area visual assessment result is positive, it is considered positive [8]. The semi-quantitative analysis index used the SUV ratio (SUV ratio, SUVR). The SUVR of the entire cerebral cortex to the cerebellum was obtained through automated processing using NeuroQ software (https://www.syntermed.com/neuroq), with SUVR ≥ 1.10 being positive [3].(2) 18F-PI-2620 PET images. Visual assessment used both black and white and Rainbow color scales for dual verification, and images were read in order from the cranial base to the cranial apex (3D localization was performed if necessary), using the cerebellum as a reference area to determine whether there was tau deposition in the cortical areas [9]. If any cortical area visual assessment result is positive, it is considered positive. The semi-quantitative analysis index used SUVR. PET/CT medical imaging processing software (Uws-MI, Shanghai United Imaging Healthcare Co., Ltd.) was used to rigidly register each subject’s PET images with the software’s built-in template, using the lower part of the cerebellum as a reference area, and automated processing obtained the PET brain atlas region and cerebellum’s SUVR [10].(3) 18F-FDG PET images. Visual assessment was considered positive if there was significantly low metabolism in the temporal and parietal lobes compared to the frontal lobe, or if the metabolism in the posterior cingulate cortex (PCC) was lower than that in the adjacent parietal lobe. Semi-quantitative analysis: ① PET-SCORE. Using the PALZ module in Pmod software (Bruker, Germany), the actual uptake values of patients were compared with the expected uptake values to obtain voxel-level t-values; then the total of abnormal t-values in AD-related ROIs (including temporal lobe, parietal lobe, etc.) was calculated (t-sum), and the t-sum was transformed into a PET-SCORE that approximates a normal distribution, with the formula PET SCORE=log2(AD t-sum/11 089+1) [11]; then a ROC curve was constructed, and the optimal threshold was obtained from the Youden index, dividing the 18F-FDG PET results into negative and positive. ② The SUVR of the patient’s ROI was automatically obtained by NeuroQ software (the reference brain area was the whole brain) and compared with the built-in control group database, with a metabolic reduction ≥ 1.65 standard deviations in the ROI being positive.4. Statistical Processing.Statistical analysis was performed using Python 3.11.5. Quantitative data that did not conform to a normal distribution were expressed as M(Q1,Q3), and quantitative data that conformed to a normal distribution were expressed as ±s. Inter-group comparisons were performed using two independent sample t-tests; qualitative data were expressed as frequency (percentage), and inter-group comparisons were performed using χ2 or paired χ2 tests. Pearson correlation analysis was used to explore the relationship between PET-SCORE and MMSE, MoCA, and ADL scores. A P<0.05 was considered statistically significant for differences or correlations.
Results
1. Comparison of General Data Between Groups.Among the 96 patients with memory impairment, the final clinical diagnosis was AD in 61 cases (22 males, 39 females) and non-AD in 35 cases (18 males, 17 females). There was no statistically significant difference in age [(67.9±7.7) vs. (68.2±8.3) years; t=0.16, P=0.873] and gender (χ2=1.57, P=0.210) between the AD and non-AD groups. The MMSE score in the AD group was lower than that in the non-AD group [(14.96±6.99) vs. (18.59±7.44) points; t=2.26, P=0.026]; the MoCA scores were (11.00±6.41) vs. (12.90±4.96) points, and the ADL scores were (22.11±9.91) vs. (20.66±7.92) points, with no statistically significant differences (t values: 1.40, -0.66, both P>0.05).
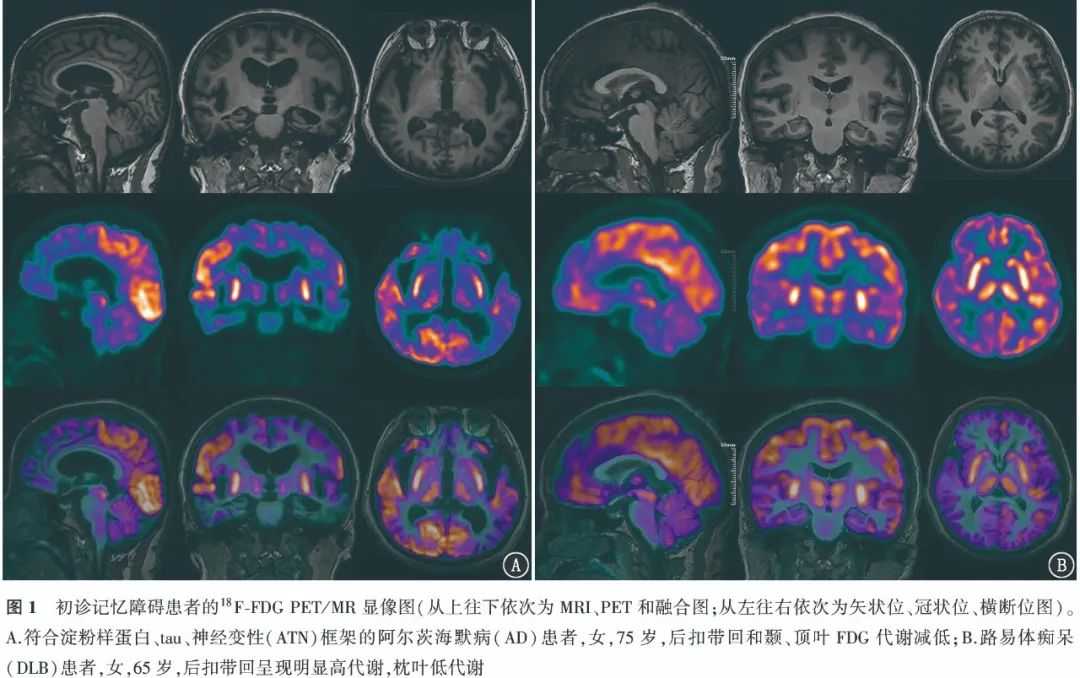
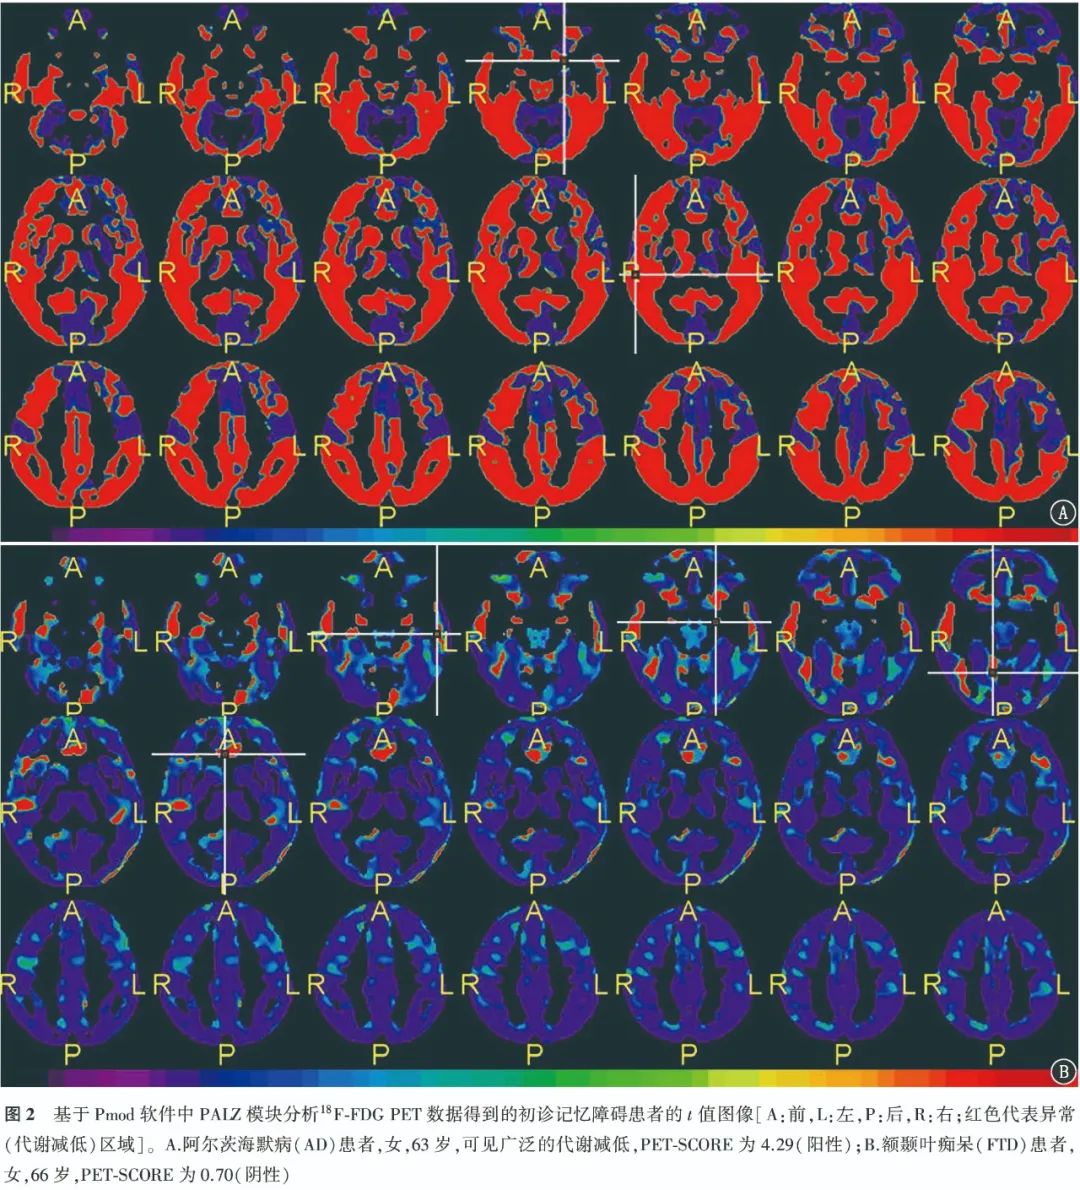
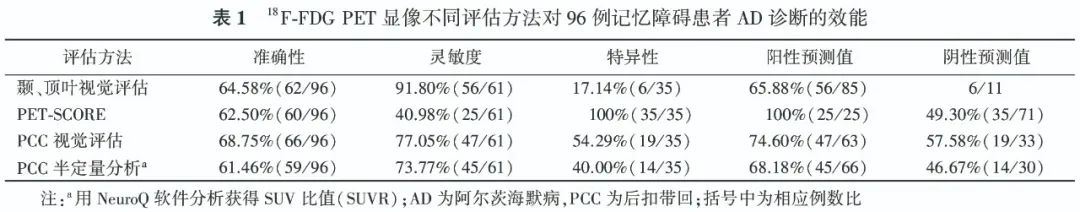
2. Diagnostic Efficacy of 18F-FDG PET for AD Patients.The typical cases of positive visual assessment for 18F-FDG PET are shown in Figure 1. The ROC curve indicates that the AUC for PET-SCORE diagnosing AD is 0.69, with the optimal threshold of 3.20 obtained from the Youden index (0.41). Typical case images of PET-SCORE analysis are shown in Figure 2. The visual assessment sensitivity for diagnosing AD in the temporal and parietal lobes was the highest [91.80% (56/61)], with statistically significant differences compared to PET-SCORE (χ2=29.03, P<0.001) and PCC visual assessment (χ2=5.82, P=0.016); the specificity was highest for PET-SCORE [100% (35/35)], with statistically significant differences compared to the temporal, parietal lobe visual assessments and PCC visual assessment (χ2 values: 27.03, 14.06, all P<0.001); the highest accuracy was for PCC visual assessment [68.75% (66/96)], exceeding other methods, but the difference was not statistically significant (χ2 values: 0.32, 0.57, 2.12, all P>0.05). The diagnostic efficacy of different parameters for AD is detailed in Table 1.
3. Correlation Analysis.In 96 patients, PET-SCORE was negatively correlated with MMSE scores (r=-0.38) and MoCA scores (r=-0.36), and positively correlated with ADL scores (r=0.31), all statistically significant (all P<0.01).
Discussion
AD is the most common disease causing dementia, and for patients with memory impairment as the main complaint, it is essential to consider whether AD is present. Although the NIA-AA proposed the ATN framework for AD diagnosis, evidence for Aβ PET and tau PET is relatively difficult to obtain, thus the more accessible 18F-FDG PET still holds an important position in clinical practice.
According to the pattern of FDG uptake reduction, it is closely related to the type of clinical symptoms, thus assisting in the diagnosis and differentiation of AD [12-13]. The typical metabolic pattern of 18F-FDG PET in AD patients includes low metabolism in the temporal and parietal lobes, with the precuneus and PCC often affected [14]. In this study, among 61 AD patients, 56 had reduced metabolism in the temporal and parietal lobes, indicating that this classification standard has high sensitivity (91.80%), but low specificity (17.14%); 47 patients had reduced metabolism in the PCC, with a sensitivity of 77.05% (47/61) and specificity of 54.29% (19/35), with accuracy higher than semi-quantitative parameters (NeuroQ SUVR, PET-SCORE) but no statistically significant difference (all P>0.05). PET-SCORE can be used to assist in diagnosing AD. Previous studies have shown that this parameter has a sensitivity of 83% and 78% for distinguishing AD patients from normal controls, and specificities of 78% and 94% respectively [15]. Brugnolo et al. [11] compared the statistical parametric mapping (SPM) method and PET-SCORE semi-quantitative parameters for distinguishing preclinical AD patients from normal controls, finding that the AUC of the latter (0.87) was higher than that of SPM visual analysis (0.79). Morbelli et al. [15] showed that in distinguishing memory impairment type MCI patients from normal controls, the specificity of PET-SCORE (91.7%) exceeded that of moderately skilled individuals with 3 years of experience (79.8%). In this study, to better fit the clinical practice scenario, AD patients were distinguished from non-AD patients rather than normal individuals, resulting in a lower sensitivity for PET-SCORE (40.98%), but with high specificity (100%) similar to previous studies.
Henkel et al. [16] performed regression analysis between cortical hypometabolism scores and MMSE scores, finding a negative correlation (r=-0.388, P<0.001), indicating a correlation between 18F-FDG PET and the degree of cognitive decline. This study found that PET-SCORE is correlated with MMSE, MoCA, and ADL scores, further confirming this conclusion and highlighting the therapeutic evaluation advantages of 18F-FDG PET.
The limitations of this study are: (1) Patients with AD combined with other cognitive impairment diseases were excluded, which may introduce selection bias, but the disease distribution in this study is generally within normal range; (2) The total number of patients is small, requiring validation with a larger sample size.
In conclusion, this study applied 18F-FDG PET visual assessment and semi-quantitative parameters in diagnosing and differentiating AD in patients with cognitive impairment, finding that the visual assessment standard of reduced metabolism in the temporal and parietal lobes has high sensitivity, while the PET-SCORE semi-quantitative analysis provides high specificity. Due to the limited sample size, the conclusions of this study need to be further confirmed with a larger sample size.

END

The cover image is sourced from the internet; please contact us for removal if there is any infringement.

Nuclear Medicine WeChat Public Platform
Hosted by: Chinese Society of Nuclear Medicine
Information Media Working Committee Information Media Group
Currently, over 55,000 people have followed us


Issue 5 of 2025 | Total Issue 1533Issue
Editor: Dai Wei
Responsible Editor: Yu Fei
Chief Reviewer: Ding Hong
Chinese Society of Nuclear Medicine
Information Media Working Committee Information Media Group
Group Leader: Ding Hong
Deputy Group Leaders: Yu Fei, Li Chunlin, Huang Qingqing, Lin Duanyu