Recently, I have been exploring the advanced features of MATLAB.
In addition to common functionalities such as matrix operations and plotting functions/data graphs, MATLAB can also be used to create user interfaces and call programs written in other languages (including C, C++, Java, Python, FORTRAN).
-
Numerical computation capabilities: The paper-like mathematical operations and high-quality, reliable numerical computation capabilities make it superior to other numerical computation software.
-
Symbolic computation capabilities: MATLAB has achieved symbolic computation capabilities through the acquisition of the rights to use MAPLE.
-
Data analysis and visualization capabilities: When analyzing large amounts of raw data in scientific research and engineering calculations, MATLAB can often present the analysis graphically, which not only clarifies the relationships between data but also plays a significant role in revealing their inherent nature.
-
Text processing capabilities: MATLAB Notebook provides users with powerful text processing capabilities. It allows users to access MATLAB’s numerical computation and visualization results from a word processing program (Microsoft Word).
-
SIMULINK dynamic simulation capabilities: SIMULINK is an interactive environment used for modeling, analyzing, and simulating various dynamic systems, providing an interactive interface for building system block models using mouse drag-and-drop methods.
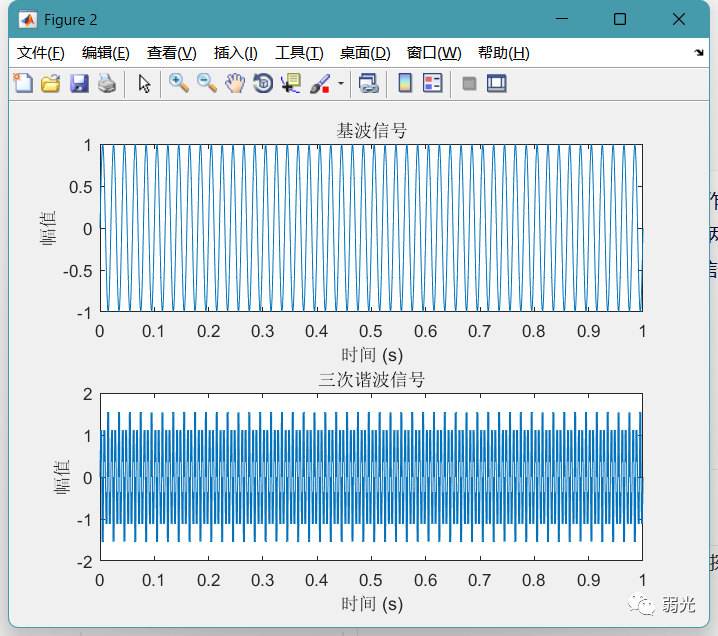
% Set sampling rate and sampling time Fs = 1000; % Sampling rate is 1000 Hz t = 0:1/Fs:1; % Sampling time is 1 second % Generate fundamental wave signal f1 = 50; % Fundamental frequency is 50 Hz x1 = sin(2*pi*f1*t); % Generate third harmonic signal f2 = 150; % Third harmonic frequency is 150 Hz x2 = sin(2*pi*f2*t) + sin(6*pi*f2*t); % Plot signal images figure; subplot(2,1,1); plot(t,x1); title('Fundamental Wave Signal'); xlabel('Time (s)'); ylabel('Amplitude'); subplot(2,1,2); plot(t,x2); title('Third Harmonic Signal'); xlabel('Time (s)'); ylabel('Amplitude');This code first sets the sampling rate and sampling time, then generates a 50 Hz sine wave as the fundamental wave signal. Next, it generates a signal containing the third and fifth harmonics as the third harmonic signal, and plots both signals in the same image. You can customize the generation of different harmonic signals by modifying the frequency and other parameters.
Result: