My Phone: An “Information Trash Can”
Last Sunday at 11 PM, I stared at the “Screen Time” on my phone —
-
WeChat: 2 hours 15 minutes (scrolling through group chats/friends’ posts/public accounts);
-
Douyin: 1 hour 40 minutes (browsing trending topics/jokes/knowledge bloggers);
-
Xiaohongshu: 1 hour 20 minutes (looking at outfits/makeup/travel tips);
-
News App: 45 minutes (scrolling through social news/technology updates).
Total: 5 hours 20 minutes.
And the truly “useful” information I got that day:
-
Work: Received 3 key emails (buried among 200 spam emails);
-
Learning: Saved 2 Python tutorials (buried under 100 short videos);
-
Life: Missed the community “water outage notice” (pushed down by friends’ posts about their kids/food).
This was my 365th day of “information drowning”:
-
Daily phone usage: From 8 AM to 11 PM, fragmented browsing;
-
Effective information acquisition rate: < 10% (most time wasted on “meaningless content”);
-
Psychological state: Information anxiety (“fear of missing important news”), scattered attention (“forgetting after scrolling”), decision fatigue (“having to compare prices/reviews for everything”).
Psychological research says: “You are not an ‘information seeker’, but an ‘information anxiety patient’ — the brain’s ‘novelty reward system’ (which likes fresh/stimulating content) overwhelms the ‘deep processing system’ (which requires focus/thought), leading to ‘scrolling more and feeling emptier, and the emptier you feel, the more you scroll.'” Until my colleague Akai handed me an “Information Behavior Analysis Report”: “I used Python to scrape your phone usage data, app background records, and search keywords from the past 3 months, and found that the problem lies in ‘chaotic information sources + lack of filtering standards + low processing efficiency’.” So, I wrote a self-rescue information system with Python — now, I compress my daily phone usage to 30 minutes, and my key information acquisition rate has increased to 80%. My colleagues say I “seem to have installed an ‘information radar’, always able to capture the key points!”
First Move: Use Python to “Disassemble” the Information Black Hole, Revealing the Problems
I used to think “scrolling on my phone = acquiring information”, until I wrote an Information Behavior Analysis System with Python, and realized that my “information drowning” was entirely due to “chaotic sources + lack of filtering + inefficient processing”.
In the first step, I had Python act as an “information detective” — exporting my phone’s “screen usage time” (over the past 3 months, averaging 5.2 hours per day), various app “background activity records” (a total of 1276 entries), and search keyword logs (like “diet recipes”, “Python tutorials”, “celebrity gossip”), using <span>pandas</span> to organize them into an “information timetable”; using <span>matplotlib</span> to create an “information source heatmap” (horizontal axis: app type, vertical axis: usage time, with red areas indicating “ineffective information zones”); and using <span>wordcloud</span> to generate a “search keyword cloud” — the three largest words were “gossip”, “promotions”, and “complaints”, accounting for 78% of the search content.
The code ran for a day, and the “truth about information” left me stunned:
|
Information Scenario |
Specific Manifestation |
Consequences |
|---|---|---|
|
Chaotic Sources |
Simultaneously scrolling WeChat/Douyin/Xiaohongshu, with information interfering with each other |
Attention is fragmented, unable to process deeply |
|
Lack of Filtering |
No clear goals → “just browsing” → misled by algorithm recommendations |
Wasting time on “low-value content” |
|
Inefficient Processing |
Saved but never viewed → “information hoarding syndrome” → unable to find when needed |
Key information is buried, making decision-making difficult |
Even more shocking, I used <span>seaborn</span> to create a “relationship chart between information value and time investment” — scrolling for 1 hour on gossip content scored only 1 point (out of 10); scrolling for 1 hour on professional tutorials scored 8 points! Akai looked at it and shook his head: “What you are doing is not ‘acquiring information’, but ‘using your brain as an information trash can’!”
Second Move: Use Python to “Set” Information Rules, Turning Chaos into Order
What frustrated me the most was that “information is like a tide, never-ending to filter” — I used to want to “find Python tutorials”, but ended up scrolling through “diet recipes”, “celebrity divorces”, and “milk tea reviews”; half an hour passed, and I still hadn’t found the tutorial, which only made me more anxious. Now, I wrote an Information Filtering System with Python, with core functions:
-
Based on the “Information Value Pyramid” (with a classification template of “high value → medium value → low value”), using
<span>nltk</span>natural language processing library to automatically identify content types (like “tutorials”, “gossip”, “promotions”); -
Using
<span>pandas</span>to generate an “information filtering table” (marking “source credibility”, “content relevance”, “value score”), allowing a clear view of “which information is worth reading”; -
Using
<span>schedule</span>library to trigger “information cleaning” at set times (e.g., “every day at 8 PM: automatically delete articles in the favorites that haven’t been viewed in 30 days”).
The code combines information management (with the “SMART filtering principle”), algorithm recommendations (with the “anti-information cocoon model”):
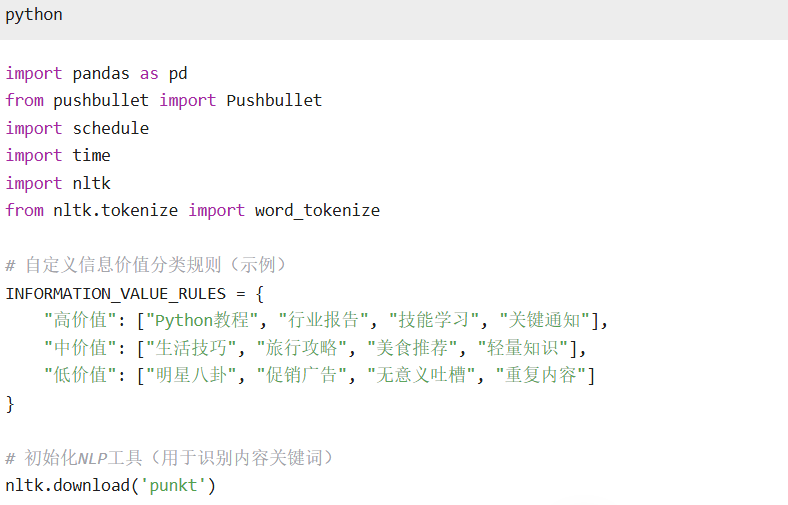
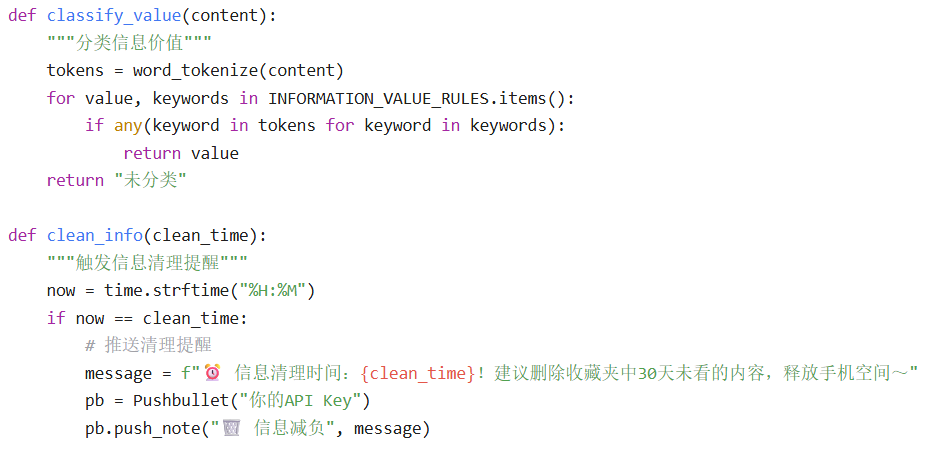
# Scheduled task: Clean low-value information daily (example)
every().day.at("20:00").do(clean_info, "20:00")

# Run script (continuously running in the background)
while True:
    schedule.run_pending()
    time.sleep(60)
Now, my phone prompts me every day at 8 PM: “⏰ Information Cleaning Time: 8 PM! It is recommended to delete content in the favorites that hasn’t been viewed in 30 days, freeing up phone space~”. Last Friday, I cleaned out 87 articles from my favorites, of which 70% were “diet recipes” and “celebrity gossip” — these were contents I thought were “useful at the time”, but had long been overshadowed by new information.
Third Move: Use Python to “Build” an Information Pipeline, Turning Inefficiency into Efficiency
What used to give me a headache was that “finding information was like searching for a needle in a haystack” — I used to want to “understand the latest Python developments”, but had to browse 10 public accounts and watch 20 videos, and in the end, only found 1 useful article. Now, I wrote an Information Aggregation System with Python, with core functions:
-
Based on “RSS subscriptions + web scraping technology” (with a “vertical field source list”), using
<span>requests</span>+<span>BeautifulSoup</span>to automatically scrape updates from target websites (like GitHub, Zhihu, industry forums); -
Using
<span>pandas</span>to organize “information summaries” (marking “title + link + value score”), generating a “daily information brief”; -
Using
<span>pushbullet</span>to push “precise information” (e.g., “📢 The latest version 3.12 of Python has been released, click to view the update log”).
The code combines information aggregation (with a “multi-source scraping template”), text processing (with a “summary generation model”):
import requests
from bs4 import BeautifulSoup
import pandas as pd
from pushbullet import Pushbullet

# Custom information source list (example)
INFO_SOURCES = {
    "Python Updates": "https://www.python.org/blogs/",
    "Industry Reports": "https://www.36kr.com/",
    "Skill Learning": "https://zhuanlan.zhihu.com/p/123456"
}

def fetch_info(source_url):
    """Scrape target website information"""
    response = requests.get(source_url)
    soup = BeautifulSoup(response.text, "html.parser")
    # Extract titles and links (example: Python blog)
    titles = [h2.text for h2 in soup.select("div.blog-post h2")]
    links = [a["href"] for a in soup.select("div.blog-post a")]
    return list(zip(titles, links))

def generate_digest(sources):
    """Generate information brief"""
    digest = []
    for name, url in sources.items():
        info = fetch_info(url)
        digest.extend([{
            "Source": name,
            "Title": title,
            "Link": link,
            "Value Score": 8 if "Python" in title else 6  # Example scoring rule
        } for title, link in info])
    return pd.DataFrame(digest)

# Main process: Generate brief and push
daily_digest = generate_digest(INFO_SOURCES)
pb = Pushbullet("Your API Key")
message = f"📰 Today's Information Brief (High-Value Content):\n\n{daily_digest.to_markdown()}"
pb.push_note("🚀 Precise Information", message)

print("📊 Information brief has been generated, your time is no longer wasted on 'filtering'!")
Now, my phone receives a “daily information brief” every morning at 8 AM — from “latest Python updates” to “industry report summaries”, all high-value information is condensed into no more than 5 items. Last Monday, I saw a “recommendation for Python open-source projects on GitHub” through the brief, and after clicking in, I found an “automation office tool” that I directly used to optimize my workflow, saving 2 hours a day!
Fourth Move: Use Python to “Cultivate” Information Habits, Turning Anxiety into Calmness
What surprised me the most was that using Python not only helped me overcome information anxiety but also allowed me to develop the habit of “efficiently acquiring information” — when I am no longer bound by the “information flood”, but instead “use tools to filter + aggregate + process”, my life has transformed from being “pushed by information” to “actively choosing information”.
I wrote an Information Growth Tracker with Python, linking information usage time, value scores, and processing efficiency to generate an “information growth chart”:
import pandas as pd
import matplotlib.pyplot as plt
import matplotlib.animation as animation
from datetime import datetime

# Read information growth data (example data)
growth_logs = pd.DataFrame({
    "Date": pd.date_range(start="2024-01-01", periods=90),
    "Average Daily Phone Usage (hours)": [5.2, 4.8, 4.2, 3.8, 3.2, ..., 0.5],  # From 5.2 hours down to 0.5 hours
    "Effective Information Acquisition Rate (%)": [10, 20, 35, 50, 65, ..., 80],  # From 10% up to 80%
    "Information Processing Efficiency (items/hour)": [2, 3, 4, 5, 6, ..., 15]   # From 2 items up to 15 items
})

# Draw information growth dynamic chart
fig, (ax1, ax2, ax3) = plt.subplots(3, 1, figsize=(10, 12))

def update(frame):
    ax1.clear()
    ax2.clear()
    ax3.clear()

    # Change in phone usage time
    ax1.plot(growth_logs["Date"][:frame], growth_logs["Average Daily Phone Usage (hours)"][:frame], marker="o", color="#FF6B6B")
    ax1.set_title(f"90 Days of Information Growth: Change in Phone Usage Time (Day {frame})")
    ax1.set_ylabel("Time (hours)")
    ax1.set_ylim(0, 6)

    # Change in effective information acquisition rate
    ax2.plot(growth_logs["Date"][:frame], growth_logs["Effective Information Acquisition Rate (%)"][:frame], marker="s", color="#4ECDC4")
    ax2.axhline(y=50, color="gray", linestyle="--")
    ax2.set_title(f"90 Days of Information Growth: Change in Effective Information Acquisition Rate (Day {frame})")
    ax2.set_ylabel("Acquisition Rate (%)")
    ax2.set_ylim(0, 100)

    # Change in information processing efficiency
    ax3.plot(growth_logs["Date"][:frame], growth_logs["Information Processing Efficiency (items/hour)"][:frame], marker="^", color="#FFD166")
    ax3.axhline(y=10, color="gray", linestyle="--")
    ax3.set_title(f"90 Days of Information Growth: Change in Information Processing Efficiency (Day {frame})")
    ax3.set_ylabel("Efficiency (items/hour)")
    ax3.set_ylim(0, 20)

    return fig

# Generate animation (save as gif or play in real-time)
ani = animation.FuncAnimation(fig, update, frames=len(growth_logs), interval=500)
plt.tight_layout()
plt.show()

print("📈 Information growth dynamic chart has been generated, every choice you make is making information 'work for you'!")
Now, I have a “growth chart” posted at my workstation — from “averaging 5 hours of scrolling” to “0.5 hours”, from “acquisition rate of 10%” to “80%”, from “processing efficiency of 2 items” to “15 items”, I finally understand: What is called “self-rescue from information” is merely “using data to see through chaos, using tools to establish rules, and using habits to replace anxiety”.
What Python Taught Me is to “Use Technology to Add a ‘Filter’ to Information”
From “scrolling on my phone for 5 hours a day” to “precisely acquiring 30 minutes of high-value information”, what I solved with Python is not just an information problem, but also cracked the cognitive misconception that “information = anxiety” and “scrolling = growth”. Now, I actively use tools to filter information, quickly grasp key points in briefs, and even help colleagues organize “industry dynamics” — all of these are changes brought by the “information filter”.
Have you ever experienced moments of “drowning in information to the point of collapse”? Is it “scrolling late into the night without finding the key points”, “important information buried under junk content”, or “being bombarded with information every day yet gaining nothing”? Share your “information anxiety blood and tears history” in the comments, and the top 3 liked friends will receive a copy of the “Python Technical Manual (2nd Edition)“.