 Introduction
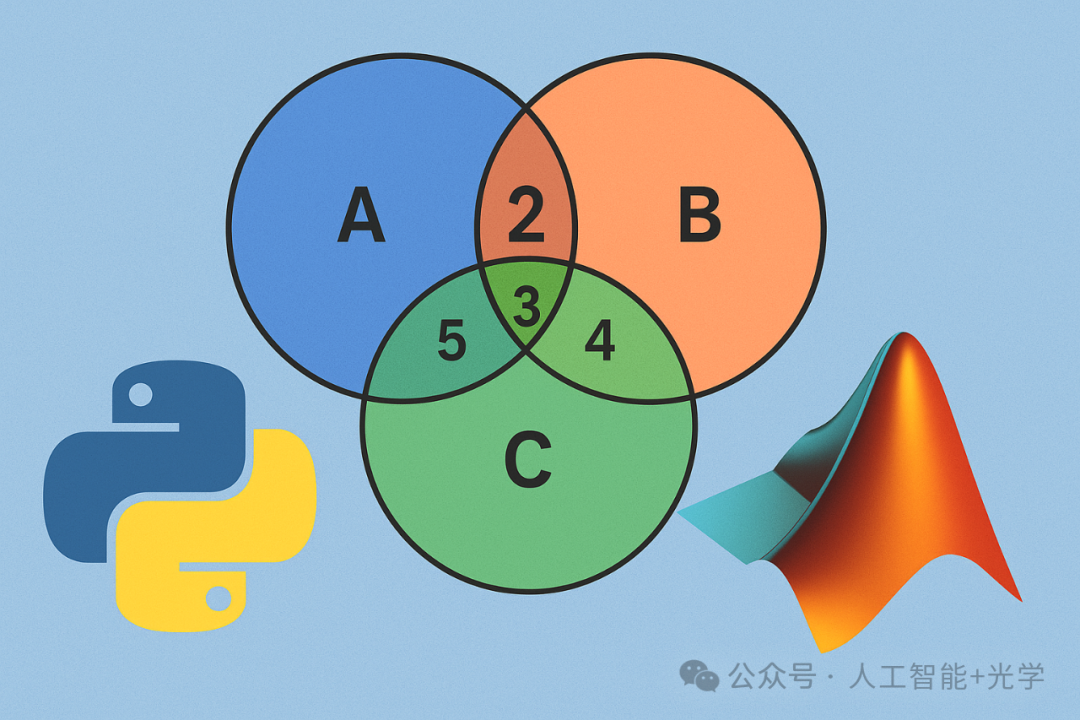
In data analysis, scientific papers, and even daily work reports, we often encounter a very common type of chart: several overlapping circles with numbers in the middle.
Its name is Venn Diagram.
Although it looks simple, you might not know that it is one of the most intuitive and efficient tools for expressing set relationships, and it is also an indispensable visualization method in various analysis scenarios, which means it clarifies complex set relationships using the simplest graphics.
What is a Venn Diagram?
**A Venn Diagram** is a graphic that uses overlapping circles to represent the relationships between different sets. It answers simple yet critical questions:
-
Which elements belong only to set A?
-
Which belong only to set B?
-
Which belong to both A and B?
-
How do three sets intersect?
In simpler terms: it is a tool that makes the complex relationships of “who has, who does not, who shares” clear at a glance.
🌄 Drawing Venn Diagrams with MATLAB
clc
clear all
close all
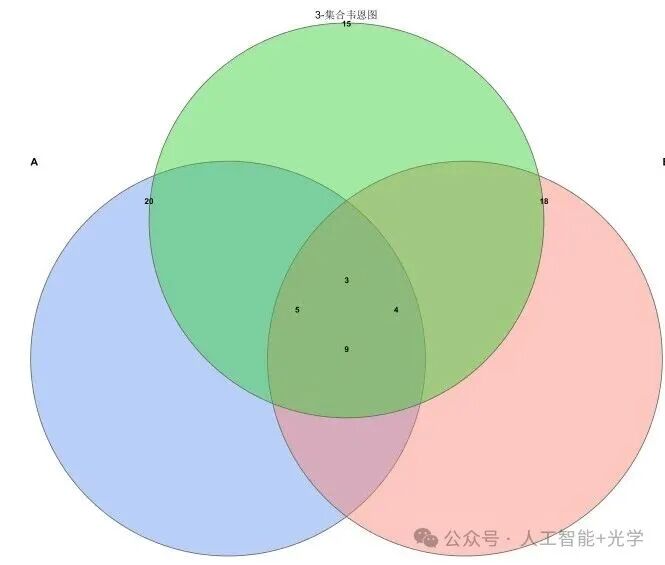
drawVenn3(20,18,9,15,5,4,3)
function drawVenn3(a_only, b_only, ab_only, c_only, ac_only, bc_only, abc, varargin)
% drawVenn3 - 3-set Venn Diagram (based on three circle overlap)
% Usage:
%   drawVenn3(20,18,9,15,5,4,3)
% name-value:
%   'Labels', {'A','B','C'}
%   'Colors', { [0.3922 0.5843 0.9294], [0.9804 0.5020 0.4471], [0.1961 0.8039 0.1961] }
%   'Alpha', 0.45
%   'Title', '3-set Venn Diagram'
p = inputParser;
addParameter(p,'Labels',{'A','B','C'});
addParameter(p,'Colors',{[0.3922 0.5843 0.9294],[0.9804 0.5020 0.4471],[0.1961 0.8039 0.1961]});
addParameter(p,'Alpha',0.45);
addParameter(p,'Title','3-set Venn Diagram');
parse(p,varargin{:});
labels = p.Results.Labels;
colors = p.Results.Colors;
alphaVal = p.Results.Alpha;
titleStr = p.Results.Title;
theta = linspace(0,2*pi,300);
r = 1.0;% centers chosen for nice overlaps
cA = [-0.6, 0];
cB = [0.6, 0];
cC = [0, 0.7];
xA = cA(1) + r*cos(theta);
yA = cA(2) + r*sin(theta);
xB = cB(1) + r*cos(theta);
yB = cB(2) + r*sin(theta);
xC = cC(1) + r*cos(theta);
yC = cC(2) + r*sin(theta);
figure('Color','w'); hold on; axis equal; axis off;
patch(xA,yA,colors{1},'FaceAlpha',alphaVal,'EdgeColor',[0.4 0.4 0.4],'LineWidth',1.2);
patch(xB,yB,colors{2},'FaceAlpha',alphaVal,'EdgeColor',[0.4 0.4 0.4],'LineWidth',1.2);
patch(xC,yC,colors{3},'FaceAlpha',alphaVal,'EdgeColor',[0.4 0.4 0.4],'LineWidth',1.2);
% place counts: manually positioned for clarity
text(cA(1)-0.4, cA(2)+0.8, sprintf('%d',a_only),'FontSize',12,'FontWeight','bold','HorizontalAlignment','center');
text(cB(1)+0.4, cB(2)+0.8, sprintf('%d',b_only),'FontSize',12,'FontWeight','bold','HorizontalAlignment','center');
text(cC(1), cC(2)+1.0, sprintf('%d',c_only),'FontSize',12,'FontWeight','bold','HorizontalAlignment','center');
% pairwise overlaps (approximate positions)
text(0, 0.05, sprintf('%d',ab_only),'FontSize',12,'FontWeight','bold','HorizontalAlignment','center');
text(-0.25, 0.25, sprintf('%d',ac_only),'FontSize',12,'FontWeight','bold','HorizontalAlignment','center');
text(0.25, 0.25, sprintf('%d',bc_only),'FontSize',12,'FontWeight','bold','HorizontalAlignment','center');
% triple overlap
text(0, 0.4, sprintf('%d',abc),'FontSize',12,'FontWeight','bold','HorizontalAlignment','center');
% set names
text(cA(1)-1.0, cA(2)+1.0, labels{1}, 'FontSize',16,'FontWeight','bold');
text(cB(1)+1.0, cB(2)+1.0, labels{2}, 'FontSize',16,'FontWeight','bold');
text(cC(1), cC(2)+1.8, labels{3}, 'FontSize',16,'FontWeight','bold');
title(titleStr,'FontSize',16);
set(gcf,'Position',[100 100 700 700]);
hold off;
end
🌄 Drawing Venn Diagrams with Python
import matplotlib.pyplot as plt
from matplotlib_venn import venn2, venn3, venn2_circles, venn3_circles

def nice_venn2(subset_sizes=(30, 20, 10),               set_labels=('A', 'B'),               colors=('tab:blue','tab:orange'),               alpha=0.5,               title='Beautiful 2-set Venn Diagram',               savepath=None):    """    subset_sizes: (only A, only B, A∩B)    """    plt.figure(figsize=(6,6))    v = venn2(subsets=subset_sizes, set_labels=set_labels, set_colors=colors, alpha=alpha)    # Beautification: set font size, add circles    for text in v.set_labels:        if text: text.set_fontsize(14)    for text in v.subset_labels:        if text: text.set_fontsize(12)    c = venn2_circles(subset_sizes, linestyle='solid', linewidth=2, color='gray')    plt.title(title, fontsize=16, pad=10)    plt.tight_layout()    if savepath:        plt.savefig(savepath, dpi=300)    plt.show()
def nice_venn3(subset_sizes=(10, 10, 5, 10, 5, 3, 2),               set_labels=('A','B','C'),               colors=('tab:blue','tab:orange','tab:green'),               alpha=0.45,               title='Beautiful 3-set Venn Diagram',               savepath=None):    """    subset_sizes order for venn3: (100*A only, 010*B only, 110*A&B only, 001*C only, 101*A&C only, 011*B&C only, 111*A&B&C)    Example typical input: (A_only, B_only, A&B only, C_only, A&C only, B&C only, A&B&C)    """    plt.figure(figsize=(7,7))    v = venn3(subsets=subset_sizes, set_labels=set_labels)    # matplotlib-venn does not directly support set_colors for venn3, fill manually    patches = ['100','010','110','001','101','011','111']    color_map = {        'A': colors[0],        'B': colors[1],        'C': colors[2]    }    # Fill individual area colors approximately (layered filling)    # Here a simple method is used: draw three circles with semi-transparent fills    ax = plt.gca()    # draw circles behind labels to get nicer color blends    circle_kw = dict(alpha=alpha, linewidth=2, edgecolor='gray')    from matplotlib.patches import Circle    # coordinates chosen by matplotlib-venn (center positions)    centers = [(-0.6, 0.0), (0.6, 0.0), (0.0, 0.6)]    radius = 0.9    ax.add_patch(Circle(centers[0], radius, facecolor=colors[0], **circle_kw))    ax.add_patch(Circle(centers[1], radius, facecolor=colors[1], **circle_kw))    ax.add_patch(Circle(centers[2], radius, facecolor=colors[2], **circle_kw))
    # Adjust labels size and position    for text in v.set_labels:        if text: text.set_fontsize(14)    for text in v.subset_labels:        if text and text.get_text() != '':            text.set_fontsize(11)    plt.title(title, fontsize=16, pad=10)    plt.axis('equal')    plt.axis('off')    plt.tight_layout()    if savepath:        plt.savefig(savepath, dpi=300)    plt.show()
if __name__ == "__main__":    nice_venn2(subset_sizes=(40, 30, 15),               set_labels=('Girls','Boys'),               colors=('cornflowerblue','salmon'),               alpha=0.6,               title='Example: Overlap of Interests between Girls and Boys',               savepath='venn2_example.png')
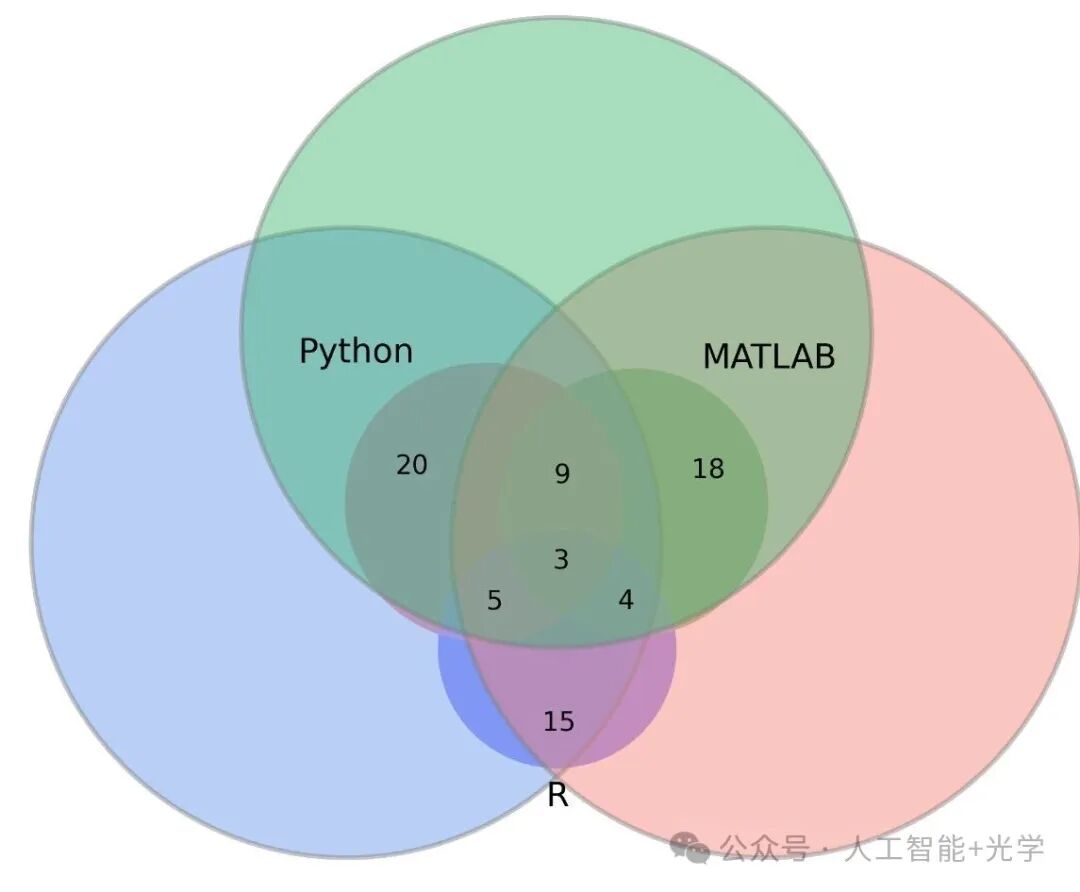
    # Subset order (A_only, B_only, A&B only, C_only, A&C only, B&C only, A&B&C)    nice_venn3(subset_sizes=(20, 18, 9, 15, 5, 4, 3),               set_labels=('Python','MATLAB','R'),               colors=('cornflowerblue','salmon','mediumseagreen'),               alpha=0.45,               title='Example: Skill Overlap of Three Languages',               savepath='venn3_example.png')